

Abstract
The characteristics of a livestock area, including farm density and animal species, influence the spread of foot-and-mouth disease (FMD). In this study, the impact of livestock area on FMD epidemics was examined using an FMD transmission model. For this simulation, three major livestock areas were selected: the 2010 FMD epidemic area in Japan as the baseline area (BS), a cattle and pig mixed production area (CP) and a cattle production area (C). Simulation results demonstrated that under the 24-hr culling policy, only 12% of epidemics among 1,000 simulations were abated within 100 days in the CP area, whereas 90% of the epidemics ceased in the BS area. In the C area, all epidemics were successfully contained within 100 days. Evaluation of additional control measures in the CP area showed that the 0.5-km pre-emptive culling, even when only targeting pig farms, raised the potential for successful containment to 94%. A 10-km vaccination on day 7 or 14 after initial detection was also effective in halting the epidemics (80%), but accompanied a large number of culled or vaccinated farms. The combined strategy of 10-km vaccination and 0.5-km pre-emptive culling targeting pig farms succeeded in containing all epidemics within 100 days. The present study suggests the importance of preparedness for the 24-hr culling policy and additional control measures when an FMD outbreak occurs in a densely populated area. Considering the characteristics of the livestock area is important in planning FMD control strategies.
Keywords: animal species, control measure, foot-and-mouth disease, livestock density, simulation model
Foot-and-mouth disease (FMD) is one of the most significant infectious diseases in animals worldwide [35], and its prevention and control is thus of great concern for animal health authorities. In Japan, a large-scale FMD epidemic occurred in 2010 [26], in which control measures including culling of animals on the detected farms; restricting movement of livestock animals, animal products and other contaminated commodities; and strengthening of biosecurity measures on farms were employed. However, within one month after detection, the disease had spread so rapidly that emergency vaccination was performed, and the epidemic was contained. During the three-month epidemic, 292 infected farms were detected, and almost 290,000 animals were culled. Introduction of the disease in an area densely populated with cattle and pigs is considered as one of the causes of rapid and extensive spreading of FMD [19, 26].
Difficulties in preventing the spread of the disease in highly dense livestock areas were also reported in the previous FMD outbreaks in the United Kingdom (U.K.), the Netherlands and Korea [2, 5, 16, 30, 32]. Whereas epidemics in European countries primarily entailed the infection of cattle and sheep, FMD epidemics in Korea and in Japan occurred in cattle and pigs. During the epidemic in Korea in 2010–2011, the invasion of FMD into highly populated cattle and pig areas caused the widespread dissemination of the disease [30]. Because the susceptibility and transmissibility of FMD are different between animal species [1, 8, 34], the patterns of FMD epidemics depend on the predominant livestock species in the area where the disease occurs. Therefore, the features of the species and the population density of susceptible animals in the affected area should be considered when developing effective FMD control measures.
Quantitative modeling is a useful approach for evaluating the spread and control of disease. The effects of livestock population density on epidemic size have been examined using a modeling approach for FMD [4, 10, 23], classical swine fever [11, 24] and avian influenza [9, 36]. Furthermore, the previous modeling studies suggested that densely populated areas were at higher risk for large-scale epidemics than sparsely populated areas. Based on prior simulation studies, when the disease spread in densely populated areas, culling infected animals on farms was insufficient for disease control, and additional control measures, such as vaccination or pre-emptive culling, were required [4, 10, 11, 23, 24].
To select control measures that are suitable and appropriate for each region, it is necessary to understand the consequences of the epidemic and evaluate the effectiveness of control measures. In our previous study, an FMD transmission simulation model was developed based on the 2010 FMD epidemic [20]. The simulation results indicated that early detection of the initial case and prompt culling on detected farms reduced the epidemic size in the epidemic area. In addition, the results revealed that pre-emptive culling and vaccination strategies had the potential to contain the epidemic in a smaller scale. However, considering preparedness for future outbreaks of FMD, it is necessary to evaluate the risk of the disease spread and the effectiveness of control measures in different regions, because livestock characteristics vary across the country and some regions are more densely populated than the areas affected by the epidemic in 2010.
In the present study, we evaluated the potential spread of FMD in major livestock farming areas with different characteristics of animal species composition and farm densities in Japan using the spatial stochastic FMD transmission model to provide useful information for the development of FMD control strategies for decision-makers.
MATERIALS AND METHODS
Selection of simulation areas: Considering the great economic damage to the livestock industry caused by FMD outbreaks, this study assumed that an FMD outbreak occurred in a major livestock farming region in Japan. To evaluate the potential spread of the FMD epidemic, three major livestock regions were selected based on differences in animal species and densities between the areas. In each selected region, the most densely populated 100-km2 areas, defined as the central section, and the surrounding area of the central sections were selected as the simulation areas. Based on the pre-simulation results, each simulation area was arranged to allow enough size so as not to limit the possible spread of the disease. The distributions of farms in each selected area are shown in Fig. 1. Characteristics of the selected simulation areas are summarized as follows (Table 1).
Fig. 1.

Distribution of farms in each simulation area.(A) the base area (BS area, 3,000 km2), (B) the cattle and pig mixed production area (CP area, 3,000 km2) and (C) the cattle production area (C area, 900 km2). The central sections in each area were bordered with green (100 km2).
Table 1. Summary of simulation areas.
| Simulation area | km2 | Number of farms | Number of animals × 103 | Farm density/km2 | Animal density/km2 | ||||||||
|---|---|---|---|---|---|---|---|---|---|---|---|---|---|
| cattle | pig | cattle | pig | cattle | pig | cattle | pig | ||||||
| Base area | Whole | 3,000 | 2,391 | 183 | 100 | 279 | 0.80 | 0.06 | 33 | 93 | |||
| (BS area) | Central | 100 | 268 | 100 | 15 | 158 | 2.68 | 1.00 | 151 | 1,576 | |||
| Cattle and pig mixed production area | Whole | 3,000 | 9,468 | 715 | 254 | 987 | 3.16 | 0.24 | 85 | 329 | |||
| (CP area) | Central | 100 | 718 | 62 | 24 | 85 | 7.18 | 0.62 | 237 | 852 | |||
| Cattle production area | Whole | 900 | 320 | 4 | 123 | 1.4 | 0.36 | 0.00 | 137 | 2 | |||
| (C area) | Central | 100 | 71 | 0 | 48 | 0 | 0.71 | 0.00 | 479 | 0 | |||
- The baseline area (BS) was the major FMD epidemic area in Japan in 2010, which was densely populated with both cattle and pig. Cattle and pig farm densities in the central sections were 2.7 farms/km2 and 1.0 farm/km2, respectively.
- A cattle and pig mixed production area (CP) was one of the most heavily populated areas with both cattle and pigs in Japan, in which cattle farm density was 7.2 farms/km2 and pig farm density was 0.6 farms/km2 in the central section. Specifically, cattle farm density in the central section of the CP area was almost 2.7 times larger that of the BS area. The surrounding areas of the central section also had a high density of cattle and pig farms when compared to the BS area.
A cattle production area (C) was a major area of dairy cattle farming in Japan. The number of cattle per farm in this area was larger than those in the BS and CP areas, where breeding beef cattle was more prevalent. The median number of cattle per farm in the C area was 139 animals, while the median number in the BS and CP areas were 11 and 9 animals, respectively. Thus, although the cattle farm density was smaller than the density in the BS area, the cattle population density in the C area was greater than the BS and CP areas. The pig population in the C area was low.
Farm information, including location (latitude and longitude), number of animals and animal species in the selected areas, was used in the simulation of the disease spread. For the simulation within the BS area, farm data collected during the 2010 FMD epidemic were used, and for the simulation within the CP and C areas, information from 2013 on farms in these areas was obtained from the database of the Animal Health Division of the Ministry of Agriculture, Fisheries and Forestry (MAFF) in Japan. Data from cattle and pig farms were used for the present study, because other cloven foot animals that are susceptible to FMD, such as sheep or goats, are minor livestock species in Japan.
Simulation of disease spread using the FMD transmission model: An FMD transmission model developed for the 2010 FMD epidemic in Japan [20] was adapted to the present study. The details of the transmission model are described in the previous study [20]. Briefly, the model is a spatial stochastic simulation model that replicates the spread of disease between farms. The between-farm transmission was simulated using a transmission parameter called the transmission kernel, which determines the infection hazard posed by an infectious farm to a susceptible farm as a function of the intra-farm distance (r). Based on the model fitting of the four kernel function types to the epidemic data by the maximum-likelihood estimation, the following function of the transmission kernel h(r) was used in this study:
Simulation of disease spread using the FMD transmission model: An FMD transmission model developed for the 2010 FMD epidemic in Japan [20] was adapted to the present study. The details of the transmission model are described in the previous study [20]. Briefly, the model is a spatial stochastic simulation model that replicates the spread of disease between farms. The between-farm transmission was simulated using a transmission parameter called the transmission kernel, which determines the infection hazard posed by an infectious farm to a susceptible farm as a function of the intra-farm distance (r). Based on the model fitting of the four kernel function types to the epidemic data by the maximum-likelihood estimation, the following function of the transmission kernel h(r) was used in this study:
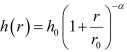 |
where h0, r0 and α are specific parameters that were estimated for the kernel, h0 indicates the maximum value for h(r) at r= 0 and r0 and α determines the shape of the h(r curve. By applying the transmission kernel, the force of infection λi (t), namely the rate at which a susceptible farm i is infected by an infectious farm j on a certain day t, is then determined by:
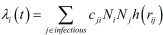 |
where Ni and Nj are the logarithmic number of animals on the susceptible farm i and the infectious farm j, cji refers to the transmission coefficient, a parameter that accounts for the species-specific transmissibility corresponding the animal species on the susceptible farm i and the infectious farm j, rij is the distance between the susceptible farm i and the infectious farm j.
Parameters of the transmission kernel and transmission coefficient were estimated by maximum-likelihood estimation using the epidemic data during the period after the initial detection of the disease until the implementation of emergency vaccination [20]. Thus, the estimated parameter values of the transmission kernel used in this study were r0=0.58, h0=0.00074 and α=2.47. The relative transmission coefficient for cattle-to-pig transmission (ccp) was 0.77, while those for pig-to-cattle (cpc) and pig-to-pig (cpp) transmission were 2.45 and 3.01, respectively, when the coefficient for cattle-to-cattle transmission (ccc) was 1.
The probability that the susceptible farm i acquires infection on a day t was then given by,
 |
Once animals on a farm were identified as infected, an affected farm was assumed to progress through the following states: latent (infected, but not yet infectious), asymptomatic (infectious, but no clinical signs), clinical onset, detected and culled. An infected farm was assumed to have an incubation period of 4 days (latent state for 2 days and asymptomatic state for 2 days) [7, 22]. On the basis of the median duration from clinical onset to detection during the 2010 epidemic, the infection in a farm was assumed to be detected 4 days after the clinical onset. After detection, animals on infected farms were assumed to be culled within 24 hr, based on the principal policy of the major FMD-free countries, including Japan [3, 14, 25, 37]. An infected farm was assumed to remain infectious until the completion of culling.
Because the transmission kernel used in the present study was estimated based on epidemic data after implementation of the movement restriction during the 2010 epidemic in Japan [20], the disease spread under the movement restriction was mimicked by the simulation in this study. As the worst-case situation, the disease spread was assumed to begin in the central section, which is the most densely populated area in each simulation area. Because FMD had already spread and at least 10 farms were estimated to be infected by the time of the initial detection in the 2010 FMD epidemic [26], 10 initially infected farms that start the disease spread in the simulation were randomly selected from the farms in the central sections of each simulation area, and 10 different sets of initial infected farms were generated as the starting configurations. We ran 100 iterations for each set of initially infected farms, and a total of 1,000 simulated epidemics were obtained for each simulation area. Every iteration of the epidemic ran for 100 days from initial detection of the disease, with each discrete time step equaling 1 day. Total numbers of infected farms and animals on day 100 were obtained as model outputs. The probability of containing the disease within 100 days, which indicates how many simulated epidemics among the total 1,000 iterations fully ceased within 100 days, was calculated.
Additional control measures: The effectiveness of additional control measures, including pre-emptive culling and vaccination, was evaluated using the FMD transmission model (Table 2). Based on the epidemic in 2010, the implementation of the culling strategy alone to target infected farms appeared insufficient to achieve prompt containment of FMD, once the disease invaded the area more densely populated than the major epidemic area in 2010. Therefore, in the present study, evaluation of additional control measures was focused on measures to effectively and efficiently contain the disease in the CP area.
Table 2. Additional control measure scenarios.
| Scenarios | Scenario description | |
|---|---|---|
| Baseline | ||
| culling 24 hr (cl24 hr) | Culling of an infected farm within 24 hr after detection | |
| Pre-emptive culling | ||
| 0.5 km (pc0.5 km) | Pre-emptive culling of farms 0.5 km around a detected farm within 48 hr after detection | |
| 0.5 km-target pig (pc0.5 km-tp) | Pre-emptive culling targeting only pig farms 0.5 km around a detected farm within 48 hr after detection | |
| 0.5 km-around pig (pc0.5 km-ap) | Pre-emptive culling of farms 0.5 km around only a pig detected farm within 48 hr after detection | |
| Vaccination | ||
| Day 7–5 km (vc7d 5 km) | 5 km vaccination around a detected farm 7 days after the first detection | |
| Day 7–10 km (vc7d 10 km) | 10 km vaccination around a detected farm 7 days after the first detection | |
| Day 14–5 km (vc14d 5 km) | 5 km vaccination around a detected farm 14 days after the first detection | |
| Day 14–10 km (vc14d 10 km) | 10 km vaccination around a detected farm 14 days after the first detection | |
| Vaccination & Pre-emptive culling | ||
| Day 7–10 km & 0.5 km-target pig (vc7d 10 km & pc0.5 km-tp) | Vaccination (day 7–10 km) & Pre-emptive culling (0.5 km − target pig) | |
In the pre-emptive culling scenario, animals on all farms within a 0.5-km radius of detected farms were preventively culled within 48 hr. Because the pre-emptive culling strategy has never been implemented in Japan, the width of the pre-emptive culling radii was selected based on the width used during FMD outbreaks in Korea [39]. Furthermore, epidemiological analysis of the 2010 FMD epidemic suggested that pig farms played a significant role in the dissemination of the disease during the epidemic [19, 27]. Therefore, to examine the role of pig farms in disseminating the disease, 2 types of pre-emptive culling strategies targeting pig farms were evaluated in the current study. One scenario targeted only pig farms within a 0.5-km radius of detected farms, and the other scenario targeted both cattle and pig farms within a 0.5-km radius of only detected pig farms.
Based on the condition that the disease was introduced in an area densely populated with cattle and pigs, it was assumed that vaccination scenarios were conducted in the early phase of the epidemic, beginning on day 7 or 14 after initial detection, to allow adequate time to conduct a vaccine matching test and to arrange personnel and resources for vaccination. We assumed sufficient vaccine availability based on the vaccine stockpile policy of the Japanese government. The vaccination capacity was also assumed sufficient for conducting all planned vaccination within a scheduled time. Vaccinated farms were hypothesized to be fully protected 7 days and 14 days after vaccination of cattle and pigs, respectively [12, 13, 17, 38]. Farms that were infected before being protected by vaccination were assumed to be as infectious as non-vaccinated infected farms. In this scenario, vaccination was applied in 5-km and 10-km radii around detected farms. The 10-km radius was referenced in the vaccination program applied during the 2010 FMD epidemic in Japan, whereas the 5-km radius was applied to evaluate whether narrowing the vaccination range, which required minimal effort, had an effect on disease prevention. Additionally, the effectiveness of joint control measures involving both vaccination and pre-emptive culling was evaluated. The joint scenario included a vaccine strategy involving implementation within a 10-km radius 7 days after initial detection, and the pre-emptive culling strategy that targeted only pig farms within a 0.5-km radius of detected farms.
To evaluate the effectiveness of control measures, the number of infected farms and the total number of farms that were either culled or vaccinated were obtained as model output, and the probability of containing the disease within 100 days was calculated. Also, as an indicator of the workload necessary to complete the ongoing control measures, the maximum number of farms to be culled or vaccinated per day was estimated.
Sensitivity analysis: Three kinds of sensitivity analyses were conducted to investigate the influence on the disease spread, by altering the initial situations for each simulation area. First, the number of initially infected farms was changed from 10 farms to 5 farms, 3 farms or 1 farm. Next, the effect of the prompt 24-hr culling policy, which required an infected farm to be fully culled within 24 hr after detection, was compared with those of the 48 hr or 72 hr culling policy. Lastly, the width of the transmission kernel was changed in order to evaluate the effect of using the transmission kernel estimated from the previous epidemic area to other areas. To vary the width of the transmission kernel, the value of r0, which determines the shape of the h(r) curve, was increased 2 times or 4 times the initial value, which increases the transmission distance and the risk of disease transmission.
RESULTS
Comparison of the epidemic size among areas with different livestock densities: The epidemic size simulated under the 24 hr culling policy in each simulation area is shown in Table 3, Fig. 2 and the Supplementary file. Large-scale epidemics were confirmed in the high density cattle and pig areas, including the BS and CP areas, even under the 24 hr culling policy. In the BS area, the median number of infected farms was 187 (5th–95th percentiles, 109–238), and the median number of infected animals was 125 × 103 (68–159 × 103) on day 100. Further, pig accounted for almost 90% of the infected animals (115 × 103). In the CP area, which was more densely populated than the BS area, the number of infected farms and animals was greater and included an estimated 1,056 farms (13–1,465) and 315 × 103 animals (0.47–460 × 103). Further, at the peak of the epidemic, approximately 20 farms were infected per day. Based on the median value, 86% of the infected animals were pigs (271 × 103). The probability of containing the disease within 100 days was 90% in the BS area under the 24 hr culling policy and 12% in the CP area. Conversely, the epidemic size was small in the C area, and infection only occurred on cattle farms. The median number of infected farms was 12 (10–15), but the median number of infected animals reached 7.9 × 10³ (2.2–17 × 103), which was slightly smaller than the number of infected cattle in the BS area. All epidemics abated within 35 days (median value 16 days) in the C area.
Table 3. FMD epidemic sizes on day 100 under the 24 hr culling policy in each simulation area.
| Simulation area | Number of infected farms | Number of infected animals (×103) | Probability of containing the disease within 100 days | |||||||||
|---|---|---|---|---|---|---|---|---|---|---|---|---|
| Cattle | Pigs | Cattle | Pigs | |||||||||
| Median | (5th–95th percentiles) | Median | (5th–95th percentiles) | Median | (5th–95th percentiles) | Median | (5th–95th percentiles) | |||||
| Baseline area (BS) | 124 | (74–162) | 63 | (36–81) | 11 | (6.2–18) | 115 | (61–144) | 90% | |||
| Cattle and pig mixed production area (CP) | 879 | (16–1,229) | 177 | (0–240) | 43 | (0.4–59) | 271 | (0–396) | 12% | |||
| Cattle production area (C) | 12 | (10–15) | 0 | (0–0) | 7.9 | (2.2–17) | 0 | (0–0) | 100% | |||
Fig. 2.
Epidemic curves in the BS and CP areas. Left column shows the infected farms per day, and right column shows the cumulative number of infected farms in the BS and CP areas. The solid blue line in each graph indicates the median values, and the dashed blue lines in each graph indicate the 5th and 95th percentiles.
The sensitivity analysis examined potential impact on the epidemic size in each area by altering the parameter values used in the simulation model (Supplementary Fig. 1, Tables 1, 2, 3). Reducing the number of initially infected farms was less likely to cause disease spread and reduced the median value of the number of infected farms on day 100 in each simulation area. The probabilities of containing the disease within 100 days were increased compared with that of the original assumption in the BS and CP areas. However, in these areas, the 95th percentiles of the number of infected farms were almost as large as those in the original assumption when the simulation of the disease spread started with 5 or 3 infected farms. Prolonging the days required for culling on detected farms leads to an increase in the number of infected farms in both the BS and CP areas, but this change scarcely affected the epidemic size in the C area. As the width of the transmission kernel increased, the size of the epidemic drastically increased in the BS and CP areas. An increase in the number of infected farms and animals was also observed in the C area when using the wider transmission kernels.
Evaluation of control measures in the cattle and pig mixed production area: The results of the simulation indicated that the 24 hr culling strategy alone was insufficient to control FMD in the CP area. Effectiveness of additional control measures was therefore examined in the CP area, the results of which are summarized in Tables 4, 5 and Fig. 3. When farms within a 0.5-km radius of detected farms were preemptively culled, the number of infected farms was decreased to approximately 10% of the farms following implementation of the 24 hr culling scenario alone (91, 11–159; Table 4). If only pig farms within a 0.5-km radius of detected farms were preemptively culled, the epidemic size was likewise reduced to a size similar to the 0.5-km pre-emptive culling scenario. In these scenarios, more than 90% of the epidemics were contained within 100 days. On the contrary, in regards to the pre-emptive culling scenario, only culling the farms neighboring pig detected farms did not effectively prevent the spread of disease when compared to other pre-emptive culling scenarios. The total number of culled farms in each pre-emptive culling scenario was almost the same as that in the 24 hr culling scenario (Fig. 3 and Table 4). However, the maximum number of farms culled per day was larger in each pre-emptive culling scenario than in the 24 hr culling scenario, as the median value reached more than 70 farms in the 0.5-km pre-emptive culling scenarios targeting either both cattle and pigs, or targeting only pigs (Table 5).
Table 4. Results of additional control measure scenarios on day 100 in the cattle and pig mixed production area.
| Scenarios | Number of infected farms | Total number of culled or vaccinated farms | Probability of containing the disease within 100 days | ||||||
|---|---|---|---|---|---|---|---|---|---|
| Median | (5th-95th percentiles) | Reduction ratio* | Median | (5th-95th percentiles) | Reduction ratio* | ||||
| Baseline | |||||||||
| culling 24 hr (cl24 h) | 1,056 | (16–1,465) | 1.00 | 1,010 | (16–1,352) | 1.00 | 12% | ||
| Pre-emptive culling | |||||||||
| 0.5 km (pc0.5 km) | 91 | (11–159) | 0.09 | 974 | (111–1,601) | 0.96 | 94% | ||
| 0.5 km-target pig (pc0.5 km-tp) | 96 | (15–140) | 0.09 | 953 | (187–1,432) | 0.94 | 94% | ||
| 0.5 km-around pig (pc0.5 km-ap) | 509 | (367–700) | 0.48 | 880 | (643–1,131) | 0.87 | 35% | ||
| Vaccination | |||||||||
| Day 7–5 km (vc7d5 km) | 153 | (14–586) | 0.14 | 1,213 | (896–1,695) | 1.20 | 63% | ||
| Day 7–10 km (vc7d10 km) | 57 | (14–373) | 0.05 | 2,484 | (2,267–2,985) | 2.46 | 80% | ||
| Day 14–5 km (vc14d5 km) | 468 | (16–1,132) | 0.44 | 1,338 | (426–2,084) | 1.32 | 33% | ||
| Day 14–10 km (vc14d10 km) | 199 | (16–1,025) | 0.19 | 2,474 | (765–3,478) | 2.45 | 61% | ||
| Vaccination & Pre-emptive culling | |||||||||
| Day7–10 km & 0.5 km-target pig (vc7d 10 km & pc0.5 km-tp) | 31 | (14–74) | 0.03 | 379 | (151–719) | 0.38 | 100% | ||
* Ratio of the median value in the control measure scenario to that at baseline.
Table 5. Maximum number of farms culled or vaccinated per day in the cattle and pig mixed production area.
| Scenarios | Culling | Vaccination** | ||||
|---|---|---|---|---|---|---|
| Median | (5th−95th percentiles) | Median | (5th−95th percentiles) | |||
| Baseline | ||||||
| culling 24 hr | 32 | (3–41) | - | - | ||
| Pre-emptive culling | ||||||
| 0.5 km | 77 | (32–161) | - | - | ||
| 0.5 km-target pig | 73 | (48–125) | - | - | ||
| 0.5 km-around pig | 44 | (26–73) | - | - | ||
| Vaccination* | ||||||
| Day7–5 km | 7 | (3–19) | 1,085 | (861–1,499) | ||
| Day7–10 km | 5 | (3–16) | 2,465 | (2,259–2,970) | ||
| Day14–5 km | 17 | (3–33) | 923 | (0–1,679) | ||
| Day14–10 km | 11 | (3–32) | 2,364 | (0–3,247) | ||
| Vaccination* & Pre-emptive culling | ||||||
| Day7–10 km & 0.5 km-target pig | 56 | (37–119) | 2,353 | (2,217–2,650) | ||
*Infected vaccinated farms that were culled after detection were counted; non-infected vaccinated farms were not included. **Vaccination was assumed to be conducted within one day based on the schedule in each scenario.
Fig. 3.

Box-plot of the total number of culled or vaccinated farms in each control measure scenario. The x-axis shows the abbreviated control measures as described in Table 2. The middle of the box is the median, the bottom and top of the box are the 25th and 75th percentiles, respectively, and the ends of the whiskers are the 5th and 95th percentiles.
The implementation of vaccination scenarios within a 10-km radius of detected farms on day 7 following initial detection of the disease proved to be effective in reducing the number of infected farms (Table 4). The number of infected farms in the vaccination scenario was 57 (14–373), which was equivalent to 5% of the number of infected farms in the 24 hr culling scenario. Additionally, 80% of the epidemics were contained within 100 days using the vaccination scenario. The 5-km radius vaccination on day 7 also reduced the number of infected farms to almost 15% of the 24 hr culling scenario. Although the 5-km radius vaccination on day 14 following initial detection could not effectively prevent the spread of disease, the 10-km radius vaccination on day 14 exhibited sufficient effectiveness to reduce the epidemic size to almost 20% of the 24 hr culling scenario. The total number of culled or vaccinated farms exceeded 1,000 farms in the median value in each vaccination scenario (Fig. 3). In all vaccination scenarios, the maximum number of farms culled per day was smaller than that of the 24 hr culling scenario (Table 5). The median value of the maximum number of farms to be vaccinated per day nearly surpassed 1,000, under the assumption that all vaccinations were conducted within the one day scheduled in each scenario (Table 5).
The combined scenario of vaccination and pre-emptive culling, which included 10-km vaccination on day 7 and 0.5 km pre-emptive culling targeting only pig farms, resulted in the smallest-scale of epidemics among the control measure scenarios examined in this study, as the number of infected farms was reduced to 3% of the 24 hr culling scenario (31, 14–74 farms). Further, the combined scenario succeeded in abating all epidemics within 100 days of initial detection, with a median epidemic duration of 51 days.
DISCUSSION
In the current study, the potential spread of FMD in three major livestock farming areas, which have different animal species composition and farm densities, was examined using an FMD transmission model. Results of the simulation model indicated that the difference of cattle and pig farm density had a profound impact on the spread of the disease. The disease spread more extensively in the areas densely populated cattle and pig (BS and CP areas). This result suggests that areas with high density of cattle and pigs will pose a high risk of causing a large-scale outbreak, once the disease is introduced. Specifically, because the CP area had a higher livestock density in both the central section (the 100 km2 area where the disease simulation started) and its surrounding area than the BS area, a severe epidemic was more likely to occur, with a high possibility that the epidemic lasts for more than 100 days and reaches a total median epidemic size of more than 1,000 farms. Conversely, epidemics in the cattle production area (C area) were effectively controlled by the 24 hr prompt culling policy without additional control measures. Because the C area had a low density of farms and fewer pig farms, the disease appeared less likely to spread compared to the BS and CP areas.
In this study, the transmission kernel estimated from the 2010 FMD epidemic was applied for the simulation of disease spread. Although the transmission kernel theoretically included all potential routes of disease transmission between farms [6], the potential existence of other transmission routes that were not included in the kernel could not be ruled out. In addition, disease transmission within a livestock farming area could be influenced by farm management practices, movement patterns of animals, people, or vehicles, farm bio-security and virulence of the pathogen. If the disease was introduced into a dairy farming area that differed from the 2010 epidemic area, which predominantly included beef cattle farms, long-distance transmission of the disease might occur via frequent movements of milk tankers. To evaluate the effects of the density and other factors on the simulation outputs, we conducted a sensitivity analysis that increased the transmission distance and the risk of disease transmission by changing the shape of the transmission kernel, reflecting these uncertain effects. The results of the sensitivity analysis indicated that as the transmission distance increased, the number of infected farms and animals likewise increased. In this condition, the median number of infected farms increased by 1.6 or 2.4 fold in the C area, whereas it increased by four or five fold in the BS area and six or seven fold in the CP area, thus indicating that these kernels had a greater influence on the epidemic size in the BS and CP areas.
In this study, the simulation of the disease spread started from 10 initially infected farms based on the 2010 FMD epidemic. In the sensitivity analysis, the number of initial infected farms was changed to investigate the influence on disease spread. According to the sensitivity analysis, a certain likelihood of causing widespread dissemination of the disease remained in the CP area, even after the number of initially infected farms was reduced. The results imply that prompt culling alone could not achieve efficient eradication of the disease once the disease was introduced into areas densely populated with cattle and pigs. This finding was consistent with the results of previous studies that suggested the necessity for additional control measures in densely populated livestock areas [4, 10, 11, 23, 24].
The simulation model demonstrated that the 24 hr culling policy was insufficient to effectively eradicate FMD in the densely populated cattle and pig areas, and therefore, the effectiveness of additional control measures, including pre-emptive culling and vaccination, was evaluated. The 0.5-km pre-emptive culling strategy targeting both cattle and pig farms surrounding a detected farm could prevent the disease spread more effectively than the 24 hr prompt culling scenario. Likewise, the 0.5-km pre-emptive culling scenario targeting only pig farms around a detected farm exhibited equal effectiveness in controlling the spread of disease. Furthermore, the pre-emptive culling scenarios succeeded in containing disease spread in 94% of the simulated epidemics within 100 days. However, the 0.5-km pre-emptive culling scenario surrounding only detected pig farms was less effective. The results imply that prevention of and rapid, effective reaction to infection on pig farms are critical to controlling the spread of FMD and that once the disease is introduced into a pig farm, it might be difficult to rapidly contain the disease spread in densely populated areas. Therefore, once an outbreak occurs in a densely populated area, the immediate implementation of control measures against pig farms is vital for preventing the spread of infection and transmission on pig farms. However, some logistical problems exist, as the pre-emptive culling strategy requires more resources to cull animals due to the increased number of farms to be culled daily. As an alternative to the pre-emptive culling strategy, administration of an FMD antiviral agent to pigs may be an option for controlling the disease [18, 29, 33]. The FMD antiviral agent is known to have potent and selective anti-RNA-viral activity [15, 33], but it has not been familiar with for FMD control so far, in contrast to FMD vaccination, which has been sometimes implemented to control FMD outbreaks. Prior studies have shown that administration of antiviral agents to pigs during the early phase of the infection rapidly prevented the development and onset of clinical symptoms, and reduced viral shedding [15, 18, 33]. Provided the antiviral agents took effect within 48 hr of administration on a pig farm, the results of the pre-emptive culling scenario targeting only pig farms could be interpreted as the results of using the antiviral agents on pig farms surrounding the infected farms, though it was a rough assumption. After the 2010 FMD epidemic, the Japanese government stockpiled a certain volume of the FMD antiviral agents as a precaution against future outbreaks [25]. However, the antiviral agents have never been applied in field, so further investigations are required to establish the practical use of the antiviral agents as a new option of the FMD control.
The emergency vaccination strategy in the early phase of the epidemic also exhibited effectiveness in preventing the spread of FMD in high density cattle and pig areas. When initiated on day 7 following the initial detection of the disease, the 10-km vaccination mostly reduced the number of infected farms among the vaccination and pre-emptive culling scenarios evaluated in the current study. Nonetheless, it must be noted that even under this scenario, the probability of containing the disease within 100 days remained 80%, which implies that the vaccination strategy was not entirely successful in preventing disease spread in the densely populated area. Generally, the vaccination strategy requires a period of time to allow for the induction of immunity in vaccinated animals, which was assumed in this study to be 7 days for cattle and 14 days for pigs [12, 13, 17, 38]. Thus, there is a risk of spreading the disease within or outside the vaccination zone before the vaccine takes effect, which makes it difficult to accurately predict the results of the vaccination strategy. In fact, during the 2010 FMD epidemic in Japan, 68 cases were confirmed after vaccination within the vaccination zone, and most of these farms are considered to have been infected within 7 days after vaccination, i.e., before the vaccine became effective [26]. In addition, during the 2001 FMD epidemic in the Netherlands, despite the implementation of the vaccination strategy within a 2-km radius of infected farms in the beginning, the vaccination area was expanded to cover the entire local affected area because of the rapid spread of the epidemic [5, 32].
Although vaccination within a 10-km radius on day 7 was nearly effective in halting the epidemic, the number of vaccinated farms reached more than 2,000, and the total number of culled or vaccinated farms exceeded that of the 24 hr culling scenario. Thus, it appears unavoidable that the vaccine strategy involves more animals than the prompt culling scenarios. If the “vaccine-to-kill” strategy was implemented, the government would face problems dealing with the extensive loss of vaccinated animals. Conversely, if the “vaccine-to-live” strategy was employed, the government would have to increase efforts to manage the vaccinated animals and their products, as well as implement serological surveillance. Nonetheless, one of the merits to implementing the vaccination strategy is that it would retard the spread of the disease. In addition, if the disease progress is successfully abated by emergency vaccination, then the workload required for culling daily operations would be reduced, and the government would be afforded the opportunity to allocate limited human and material resources efficiently. However, at the same time, adequate logistical support for vaccination is essential for efficient implementation of the emergency vaccination strategy. As an indicator of workload, the maximum number of vaccination farms was estimated to be more than 1,000 farms per day, although this estimate seems excessive because of the optimistic assumption that all planed vaccination is conducted within one day with sufficient capacity. Actually, during the FMD epidemic in 2010, vaccinations in almost 1,000 farms were completed within only four days owing to the nationwide dispatch of veterinarian and other stuffs [26]. Therefore, resource management is important in planning vaccination strategy.
Because of concerns regarding the possibility of failure to contain the spread of the disease following implementation of the vaccination strategy, we examined the effectiveness of combining the vaccination and pre-emptive culling control measures. The combined control measure scenario involved the 10-km vaccination strategy on day 7 and the 0.5-km pre-emptive culling targeting only pigs. The joint strategy was the most effective among the control measure scenarios examined in this study in containing small-scale epidemics, as implementation of the combined measures resulted in the abatement of all epidemics within 100 days. The results following simulation of additional control measures also suggested that devising intensive control measures, such as targeting high risk populations or combining control measures, would be useful for effectively controlling FMD in the densely populated area.
The present study demonstrated that the difference of cattle and pig farm density can have a major impact on the spread of FMD and that additional control measures, such as vaccination and pre-emptive culling, have the potential to contain the epidemic on a small scale in areas densely populated with cattle and pigs. Because the characteristics of a livestock farming area depend on its livestock density, diversity of species, and distribution and aggregation of farms, it is important to develop an FMD control strategy suitable for each specific area. In particular, it is necessary for national and local animal health authorities to develop a practical plan to swiftly and appropriately apply control measures against FMD; such plans should include how to manage human and material resources in an emergency, how to plan and perform the procedures of culling animals on farms, and how to dispose of animal carcasses. Furthermore, considering the previous large FMD outbreaks in U.K. and the Netherlands in 2001 [2, 32], once a large-scale outbreak FMD occurs, massive culling of animals would be inevitable, causing large public concern in addition to economic damage and psychological influences on livestock farmers [28, 31]. Besides, as reported during the 2010 FMD epidemic [21], culling or disposal operations cause mental distress among workers, such as veterinarians and livestock technicians. Therefore, in planning the control strategy, fostering the awareness of the importance of prevention and control of FMD among relevant stakeholders, veterinarians and staffs as well as the public also would be important, and it will help to smoothly gain their acceptance of control strategies, such as prompt culling, preemptive culling and vaccination, if an outbreak occurs.
As demonstrated in the current study, when planning an FMD control strategy, simulation models that can reflect the characteristics of the areas could provide useful information for understanding the consequence of disease spread and for evaluating the effectiveness of control measures. Meanwhile, it is generally important to remember that simulation models greatly simplify real-world phenomena, and always involve uncertainty and limitations. Therefore, when interpreting the model outputs and discussing the results with decision makers or stakeholders, it is important to understand the limitations of the model as well as the appropriate application. Nevertheless, despite these limitations, we believe that these simulation exercises provide useful insights for the decision making processes, and for establishing appropriate strategies to prevent and control FMD outbreaks.
Supplementary Material
Acknowledgments
Funding for this study was provided with by the “Regulatory Research Projects for Food Safety, Animal Health and Plant Projection (2304),” Ministry of Agriculture, Forestry and Fisheries in Japan.
REFERENCES
- 1.Alexandersen S., Donaldson A. I.2002. Further studies to quantify the dose of natural aerosols of foot-and-mouth disease virus for pigs. Epidemiol. Infect. 128: 313–323. [DOI] [PMC free article] [PubMed] [Google Scholar]
- 2.Anderson I.2002. Foot and Mouth Disease 2001: Lessons to be learned Inquiry Report The Stationary Office, London. [Google Scholar]
- 3.Animal Health Australia. 2014. Australian Veterinary Emergency Plan AUSVETPLAN, Disease Strategy Foot-and-mouth disease Version 3.4, 2014. http://www.animalhealthaustralia.com.au/wp-content/uploads/2011/04/FMD-22-FINAL25Jun14.pdf.
- 4.Backer J. A., Hagenaars T. J., Nodelijk G., van Roermund H. J.2012. Vaccination against foot-and-mouth disease I: epidemiological consequences. Prev. Vet. Med. 107: 27–40. doi: 10.1016/j.prevetmed.2012.05.012 [DOI] [PubMed] [Google Scholar]
- 5.Bouma A., Elbers A. R., Dekker A., de Koeijer A., Bartels C., Vellema P., van der Wal P., van Rooij E. M., Pluimers F. H., de Jong M. C.2003. The foot-and-mouth disease epidemic in The Netherlands in 2001. Prev. Vet. Med. 57: 155–166. doi: 10.1016/S0167-5877(02)00217-9 [DOI] [PubMed] [Google Scholar]
- 6.Chis Ster I., Ferguson N. M.2007. Transmission parameters of the 2001 foot and mouth epidemic in Great Britain. PLoS ONE 2: e502. doi: 10.1371/journal.pone.0000502 [DOI] [PMC free article] [PubMed] [Google Scholar]
- 7.Cox S. J., Voyce C., Parida S., Reid S. M., Hamblin P. A., Paton D. J., Barnett P. V.2005. Protection against direct-contact challenge following emergency FMD vaccination of cattle and the effect on virus excretion from the oropharynx. Vaccine 23: 1106–1113. doi: 10.1016/j.vaccine.2004.08.034 [DOI] [PubMed] [Google Scholar]
- 8.Donaldson A. I., Herniman K. A., Parker J., Sellers R. F.1970. Further investigations on the airborne excretion of foot-and-mouth disease virus. J. Hyg. (Lond.) 68: 557–564. doi: 10.1017/S0022172400042480 [DOI] [PMC free article] [PubMed] [Google Scholar]
- 9.Dorigatti I., Mulatti P., Rosa R., Pugliese A., Busani L.2010. Modelling the spatial spread of H7N1 avian influenza virus among poultry farms in Italy. Epidemics 2: 29–35. doi: 10.1016/j.epidem.2010.01.002 [DOI] [PubMed] [Google Scholar]
- 10.Dürr S., Fasel-Clemenz C., Thur B., Schwermer H., Doherr M. G., Dohna H. Z., Carpenter T. E., Perler L., Hadorn D. C.2014. Evaluation of the benefit of emergency vaccination in a foot-and-mouth disease free country with low livestock density. Prev. Vet. Med. 113: 34–46. doi: 10.1016/j.prevetmed.2013.10.015 [DOI] [PubMed] [Google Scholar]
- 11.Dürr S., Zu Dohna H., Di Labio E., Carpenter T. E., Doherr M. G.2013. Evaluation of control and surveillance strategies for classical swine fever using a simulation model. Prev. Vet. Med. 108: 73–84. doi: 10.1016/j.prevetmed.2012.07.006 [DOI] [PubMed] [Google Scholar]
- 12.Eblé P. L., Bouma A., de Bruin M. G., van Hemert-Kluitenberg F., van Oirschot J. T., Dekker A.2004. Vaccination of pigs two weeks before infection significantly reduces transmission of foot-and-mouth disease virus. Vaccine 22: 1372–1378. doi: 10.1016/j.vaccine.2003.11.003 [DOI] [PubMed] [Google Scholar]
- 13.Eblé P. L., de Bruin M. G., Bouma A., van Hemert-Kluitenberg F., Dekker A.2006. Comparison of immune responses after intra-typic heterologous and homologous vaccination against foot-and-mouth disease virus infection in pigs. Vaccine 24: 1274–1281. doi: 10.1016/j.vaccine.2005.09.040 [DOI] [PubMed] [Google Scholar]
- 14.European Union (EU). 2003. Council Directive 2003/85/EC of 29 September 2003 on Community measures for the control of foot-and-mouth disease repealing Directive 85/511/EEC and Decisions 89/531/EEC and 91/665/EEC and amending Directive 92/46/EEC (Text with EEA relevance) http. //eur-lex.europa.eu/LexUriServ/LexUriServ.do?uri=CONSLEG. 2003L0085. 20110628. EN:PDF.
- 15.Fukai K., Ohashi S., Onozato H., Morioka K., Yamazoe R., Yoshida K., Takahashi K., Furuta Y., Sakamoto K.2009. Inhibition of excretion of foot-and-mouth disease virus from foot-and-mouth virus-infected pigs by an anti-viral agent. Proc. Jpn. Pig. Vet. Soc. 55: 28–32(in Japanese). [Google Scholar]
- 16.Gibbens J. C., Sharpe C. E., Wilesmith J. W., Mansley L. M., Michalopoulou E., Ryan J. B., Hudson M.2001. Descriptive epidemiology of the 2001 foot-and-mouth disease epidemic in Great Britain: the first five months. Vet. Rec. 149: 729–743. [PubMed] [Google Scholar]
- 17.Golde W. T., Pacheco J. M., Duque H., Doel T., Penfold B., Ferman G. S., Gregg D. R., Rodriguez L. L.2005. Vaccination against foot-and-mouth disease virus confers complete clinical protection in 7 days and partial protection in 4 days: Use in emergency outbreak response. Vaccine 23: 5775–5782. doi: 10.1016/j.vaccine.2005.07.043 [DOI] [PubMed] [Google Scholar]
- 18.Grubman M. J.2005. Development of novel strategies to control foot-and-mouth disease: marker vaccines and antivirals. Biologicals 33: 227–234. doi: 10.1016/j.biologicals.2005.08.009 [DOI] [PubMed] [Google Scholar]
- 19.Hayama Y., Muroga N., Nishida T., Kobayashi S., Tsutsui T.2012. Risk factors for local spread of foot-and-mouth disease, 2010 epidemic in Japan. Res. Vet. Sci. 93: 631–635. doi: 10.1016/j.rvsc.2011.09.001 [DOI] [PubMed] [Google Scholar]
- 20.Hayama Y., Yamamoto T., Kobayashi S., Muroga N., Tsutsui T.2013. Mathematical model of the 2010 foot-and-mouth disease epidemic in Japan and evaluation of control measures. Prev. Vet. Med. 112: 183–193. doi: 10.1016/j.prevetmed.2013.08.010 [DOI] [PubMed] [Google Scholar]
- 21.Hibi J., Kurosawa A., Watanabe T., Kadowaki H., Watari M., Makita K.2015. Post-traumatic stress disorder in participants of foot-and-mouth disease epidemic control in Miyazaki, Japan, in 2010. J. Vet. Med. Sci. 77: 953–959. doi: 10.1292/jvms.14-0512 [DOI] [PMC free article] [PubMed] [Google Scholar]
- 22.Kitching R. P., Alexandersen S.2002. Clinical variation in foot and mouth disease: pigs. Rev. Sci. Tech. 21: 513–518. [DOI] [PubMed] [Google Scholar]
- 23.Le Menach A., Legrand J., Grais R. F., Viboud C., Valleron A. J., Flahault A.2005. Modeling spatial and temporal transmission of foot-and-mouth disease in France: identification of high-risk areas. Vet. Res. 36: 699–712. doi: 10.1051/vetres:2005025 [DOI] [PubMed] [Google Scholar]
- 24.Mangen M. J., Nielen M., Burrell A. M.2002. Simulated effect of pig-population density on epidemic size and choice of control strategy for classical swine fever epidemics in The Netherlands. Prev. Vet. Med. 56: 141–163. doi: 10.1016/S0167-5877(02)00155-1 [DOI] [PubMed] [Google Scholar]
- 25.Ministry of Agriculture and Forestry and Fisheries (MAFF)2011. Guidelines for Control of Foot and Mouth Disease (in Japanese) http://www.maff.go.jp/j/syouan/douei/katiku_yobo/k_fmd/pdf/fmd_guide3.pdf.
- 26.Muroga N., Hayama Y., Yamamoto T., Kurogi A., Tsuda T., Tsutsui T.2012. The foot-and-mouth disease epidemic in Japan, 2010. J. Vet. Med. Sci. 74: 399–404. doi: 10.1292/jvms.11-0271 [DOI] [PubMed] [Google Scholar]
- 27.Nishiura H., Omori R.2010. An epidemiological analysis of the foot-and-mouth disease epidemic in Miyazaki, Japan, 2010. Transbound. Emerg. Dis. 57: 396–403. doi: 10.1111/j.1865-1682.2010.01162.x [DOI] [PubMed] [Google Scholar]
- 28.Olff M., Koeter M. W., Van Haaften E. H., Kersten P., H.and Gersons B. P.2005. Impact of a foot and mouth disease crisis on post-traumatic stress symptoms in farmers. Br. J. Psychiatry 186: 165–166. doi: 10.1192/bjp.186.2.165 [DOI] [PubMed] [Google Scholar]
- 29.Parida S. 2009. Vaccination against foot-and-mouth disease virus: strategies and effectiveness. Expert Rev. Vaccines 8: 347–365. doi: 10.1586/14760584.8.3.347 [DOI] [PubMed] [Google Scholar]
- 30.Park J. H., Lee K. N., Ko Y. J., Kim S. M., Lee H. S., Shin Y. K., Sohn H. J., Park J. Y., Yeh J. Y., Lee Y. H., Kim M. J., Joo Y. S., Yoon H., Yoon S. S., Cho I. S., Kim B.2013. Control of foot-and-mouth disease during 2010–2011 epidemic, South Korea. Emerg. Infect. Dis. 19: 655–659. doi: 10.3201/eid1904.121320 [DOI] [PMC free article] [PubMed] [Google Scholar]
- 31.Peck D. F., Grant S., McArthur W., Godden D.2002. Psychological impact of foot-and-mouth disease on farmers. J. Ment. Health 11: 523–531. doi: 10.1080/09638230020023877 [DOI] [Google Scholar]
- 32.Pluimers F. H., Akkerman A. M., van der Wal P., Dekker A., Bianchi A.2002. Lessons from the foot and mouth disease outbreak in The Netherlands in 2001. Rev. Sci. Tech. 21: 711–721. [DOI] [PubMed] [Google Scholar]
- 33.Sakamoto K., Ohashi S., Yamazoe R., Takahashi K., Furuta Y.2006. The inhibition of FMD virus excretion from the infected pigs by an antiviral agent, T-1105. In: International. Control. of. Foot-and-Mouth. Disease: Tools, Trends and Perspectives. Paphos, Cyprus 414 (2006) (Appendix 464). [Google Scholar]
- 34.Sellers R. F., Parker J.1969. Airborne excretion of foot-and-mouth disease virus. J. Hyg. (Lond.) 67: 671–677. doi: 10.1017/S0022172400042121 [DOI] [PMC free article] [PubMed] [Google Scholar]
- 35.The World Organisation for Animal Health (OIE). 2014. Terrestrial Animal Health Code. http://www.oie.int/index.php?id=169&L=0&htmfile=chapitre_fmd.htm.
- 36.Truscott J., Garske T., Chis Ster I., Guitian J., Pfeiffer D., Snow L., Wilesmith J., Ferguson N. M., Ghani A. C.2007. Control of a highly pathogenic H5N1 avian influenza outbreak in the GB poultry flock. Proc. Biol. Sci. 274: 2287–2295. doi: 10.1098/rspb.2007.0542 [DOI] [PMC free article] [PubMed] [Google Scholar]
- 37.United States Department of Agriculture Animal and Plant Health Inspection Service (USDA-APHIS). 2010. Foot-and-mouth disease response plan the red book. http://www.aphis.usda.gov/animal_health/acah/downloads/documents/FMD_Response_Plan_November_2010_FINAL.pdf.
- 38.van Roermund H. J., Eble P. L., de Jong M. C., Dekker A.2010. No between-pen transmission of foot-and-mouth disease virus in vaccinated pigs. Vaccine 28: 4452–4461. doi: 10.1016/j.vaccine.2010.04.019 [DOI] [PubMed] [Google Scholar]
- 39.Yoon H., Yoon S. S., Wee S. H., Kim Y. J., Kim B.2012. Clinical Manifestations of foot-and-mouth disease During the 2010/2011 epidemic in the Republic of Korea. Transbound. Emerg. Dis. 59: 517–525. doi: 10.1111/j.1865-1682.2011.01304.x [DOI] [PubMed] [Google Scholar]
Associated Data
This section collects any data citations, data availability statements, or supplementary materials included in this article.