

Abstract
The suppressor of cytokine signaling (SOCS) proteins are negative regulators of the JAK/STAT pathway activated by proinflammatory cytokines, including the tumor necrosis factor-α (TNF-α). SOCS3 is also implicated in hypertriglyceridemia associated to insulin resistance. Proprotein convertase subtilisin kexin type 9 (PCSK9) levels are frequently found to be positively correlated to insulin resistance and plasma very low density lipoprotein (VLDL) triglycerides concentrations. The present study aimed to investigate the possible role of TNF-α and JAK/STAT pathway on de novo lipogenesis and PCSK9 expression in HepG2 cells. TNF-α induced both SOCS3 and PCSK9 in a concentration-dependent manner. This effect was inhibited by transfection with siRNA anti-STAT3, suggesting the involvement of the JAK/STAT pathway. Retroviral overexpression of SOCS3 in HepG2 cells (HepG2SOCS3) strongly inhibited STAT3 phosphorylation and induced PCSK9 mRNA and protein, with no effect on its promoter activity and mRNA stability. Consistently, siRNA anti-SOCS3 reduced PCSK9 mRNA levels, whereas an opposite effect was observed with siRNA anti-STAT3. In addition, HepG2SOCS3 express higher mRNA levels of key enzymes involved in the de novo lipogenesis, such as fattyacid synthase, stearoyl-CoA desaturase (SCD)-1, and apoB. These responses were associated with a significant increase of SCD-1 protein, activation of sterol regulatory element-binding protein-1c (SREBP-1), accumulation of cellular triglycerides, and secretion of apoB. HepG2SOCS3 show lower phosphorylation levels of insulin receptor substrate 1 (IRS-1) Tyr896 and Akt Ser473 in response to insulin. Finally, insulin stimulation produced an additive effect with SOCS3 overexpression, further inducing PCSK9, SREBP-1, fatty acid synthase, and apoB mRNA. In conclusion, our data candidate PCSK9 as a gene involved in lipid metabolism regulated by proinflammatory cytokine TNF-α in a SOCS3-dependent manner.
Keywords: hepatocyte, insulin, proprotein convertase subtilisin/kexin type 9 (PCSK9), suppressor of cytokine signaling 3 (SOCS3), tumor necrosis factor (TNF), HepG2, stat-3
Introduction
The family of suppressor of cytokine signaling (SOCS)2 consists of eight members (SOCS-1 to SOCS-7 and cytokine-inducible SH2 protein (CIS) all sharing a central SH2 domain and a C-terminal SOCS box. Expression of CIS, SOCS-1, SOCS-2, and SOCS-3 is induced by various cytokines, including IL-6 and tumor necrosis factor-α (TNF-α) (1), and has been implicated in the negative regulation of several pathways, particularly the Janus kinase (JAK) signal transducer and activator of transcription (STAT) one (2). SOCS proteins are highly and selectively induced in a tissue-specific manner by a diverse range of stimuli other than the classical activators of the JAK/STAT pathway, including insulin (3), leptin (4), and resistin (5). In obesity, the expression of SOCS proteins is elevated in a variety of tissues that are vital for regulating fatty acid (FA) metabolism and insulin sensitivity. For instance, SOCS1 and SOCS3 are up-regulated in the liver of obese diabetic db/db mice and other insulin resistance (IR) models such as ob/ob mice and mice fed high fat diet (6, 7). The functional role of SOCS3 on hepatic steatosis and hyperlipidemia was also demonstrated by using SOCS antisense approach. The latter reduced in db/db mice the elevated hepatic lipid content and plasma triglycerides close to the normal observed in control mice (7). Furthermore, liver of morbidly obese subjects exhibits higher expression of SOCS3 protein and attenuated JAK/STAT signaling, resulting in enhanced sterol regulatory element-binding protein-1c (SREBP-1c) transcriptional activity, a key regulator of de novo lipid biosynthesis (8). This evidence might suggest that the inhibition of JAK/STAT pathway by SOCS3 is mechanistically related to the development of hepatic IR and dyslipidemia in humans.
Proprotein convertase subtilisin kexin type 9 (PCSK9) belongs to the proprotein convertase family (9). Genetic and, more recently, pharmacological studies have clearly demonstrated its involvement in the regulation of low density lipoprotein cholesterol (LDL) levels by inducing the degradation of the LDL receptor (LDLR) in a manner independent from its proteolytic activity (10–13). Similarly to the genes involved in the regulation of the cholesterol homeostasis, i.e. hydroxyl-methyl-glutaryl-CoA reductase and synthase and the LDLR, PCSK9 is under the control of the SREBP-2 (14). For this reason the pharmacological activation of the SREBP pathway by HMG-CoA reductase inhibitors, statins, induces PCSK9 both in experimental and clinical settings (15–17). Although SREBP-1a and SREBP-1c preferentially activate genes involved in the synthesis of fatty acids and triglycerides, their homologous SREBP-2 preferentially transcribes for genes involved in the cholesterol biosynthetic pathway (18, 19). To this regard, PCSK9 appears to be regulated by both SREBP-2 and SREBP-1c (14, 20), where the latter mediates the induction of PCSK9 in response to insulin (14, 21–23). The involvement of SREBP-1c in the regulation of PCSK9 levels has also been observed in humans, where PCSK9 levels positively correlated with IR, liver steatosis, and very low density lipoprotein (VLDL-TG) triglycerides (TG) (24).
This evidence suggests that, although PCSK9 is an important regulator of LDL-C levels, it could also be implicated in the homeostasis of TG-rich lipoproteins. It is, indeed, of interest that the association between plasma PCSK9 and LDL-C is weak and has been estimated to account for only the 7% of the variations in LDL-C (25), whereas PCSK9 levels are more significantly associated with plasma concentrations of TG, glucose, and insulin (21, 25–27). Based on these premises, the present study aimed to investigate the possible role of TNF-α and JAK/STAT pathway on de novo lipogenesis and PCSK9 expression in the human HepG2 cell line.
Experimental Procedures
Cell Cultures
The Human hepatocellular liver carcinoma cell line, HepG2, was cultured in 10% FCS/MEM supplemented with penicillin (10,000 units/ml), streptomycin (10 mg/ml), nonessential amino acids, and sodium pyruvate. For the experiments, cells were incubated with MEM containing either 10% of lipoprotein plasma-deprived serum (LPDS) or 10% fetal calf serum (FCS) as indicated in the figures legend.
Reagents and Antibodies
MEM, trypsin EDTA, penicillin, streptomycin, nonessential amino acid solution, FCS, disposable culture flasks, and Petri dishes were from Euroclone (Pero, Milan, Italy), and filters were from Millipore (Billerica, MA). Molecular weight protein standards were from Bio-Rad. SDS, TEMED, ammonium persulfate, glycine, and acrylamide solution (30% T, 2.6% C) were obtained from Bio-Rad. BCA assay for determination of protein concentrations was purchased from Thermo Fischer Scientific (Waltham, MA). [14C]Acetate was from Amersham Biosciences. Recombinant insulin, TNF-α, and bovine serum albumin (BSA) were purchased from Sigma. STAT3 inhibitor, MD77, was kindly provided by Prof. Daniela Barlocco (Università degli Studi di Milano, Milan, Italy) 31. The JAK inhibitor JAK1 was purchased from Millipore (Millipore, Milan, Italy). Actinomycin D was purchased from Abcam (Cambridge, UK), and fatostatin hydrobromide and 25-hydroxycholesterol (25-OH cholesterol) were from Sigma. For Western blot (WB) analysis, the following antibodies were used: anti-PCSK9 and anti-SREBP-2 (Cayman, Tallinn, Estonia), anti-α-tubulin (Sigma), anti-pAKT (Millipore), anti-AKT and anti-SOCS3 (Cell Signaling Technology, Danver, MA), anti-pSTAT3, anti-insulin receptor substrate (pIRS-1), anti-stearoyl-CoA desaturase (SCD-1), and anti-hepatocyte nuclear factor (HNF)-1α (Abcam), anti-STAT3 and SREBP-1 (Santa-Cruz Biotechnology, Santa Cruz, CA), and anti-mouse and anti-rabbit peroxidase-conjugated secondary antibodies (Jackson ImmunoResearch, Cambridgeshire, UK).
Animals
Four-week-old male ob/ob mice and their lean, wild-type male C57BL/6J controls were purchased from Charles River (Calco, Italy). In compliance with the Principles of Laboratory Animal Care (National Institutes of Health publication 86-23), mice were housed at constant room temperature (23 °C) in a 12-h light/dark cycle (7 a.m. to 7 p.m.) receiving standard chow and water ad libitum. Mice were sacrificed at 14 weeks of age in the fasted state.
Generation of Human SOCS3 Expression Construct and Retroviral Infection in HepG2 Cells
Full-length human SOCS3 (accession no. 003955) was generated by polymerase chain reaction (PCR) using the following primers: 5′-CGGGATCCATGGTCACCCACAGCAAGTTTCC-3′ and 5′-CGCTCGAGTTAAAGCGGG GCATCGTACTGG-3′ and the Expand High-Fidelity PCR System (Roche Diagnostics). The sequence of the polymerase chain reaction-generated construct was confirmed by sequencing (Primm, Milan, Italy). Retroviral expression plasmid was then constructed using the pBM-IRES-PURO (28) expressing the puromycin resistance gene as a selectable second cistron gene, generated from the original pBM-IRES-EGFP, generously provided by Garry P. Nolan (Stanford University, Stanford, CA). Retroviral infections of HepG2 were performed as previously described (28, 29). A polyclonal population of HepG2 control and SOCS3-overexpressing cells has been then selected with 10 μg/ml puromycin.
Transfection of siRNA
ON-TARGET plus SMART pool siRNA directed to STAT3 and SOCS3 or scramble control were purchased from DharmaconTM (Carlo Erba Reagents, Milan, Italy). Transfections were performed as previously described using SilentFectTM Lipid Reagent (Bio-Rad) according to the manufacturer's protocol (30, 31). HepG2 cells were seeded at a density of 6 × 10⁵/well (6 well tray) the day before the transfection in completed medium. Cells were then transfected with 20 nm siRNA for 48 h, then the medium was replaced with MEM containing 5% LPDS ± TNF-α for an additional 24 h before performing the quantitative real time PCR (qPCR) or WB analysis.
Synthesis of Total Cholesterol
Cholesterol biosynthesis was estimated by measuring the incorporation of [14C]acetate into cellular cholesterol, as previously described (32).
Evaluation of Intracellular TG and Cholesterol Levels
Total cellular lipids were extracted with hexane/isopropyl alcohol 3:2, and TG and cholesterol contents were determined with enzymatic assays (HORIBA ABX, Montpellier, France).
ELISA Assay
Conditioned media was cleared by centrifugation (13,000 rpm for 10 min) and store at −20 °C. The amount of apolipoprotein B (apoB) (Vinci-Biochem, Firenze, Italy) and PCSK9 (R&D System, Minneapolis, MN) was then quantified by using the ELISA assays according to manufacturer's instructions. The values were normalized with total cell protein contents, extracted from the cell monolayer, and determined by BCA assay (Thermo Fischer Scientific).
Luciferase Reported Promoter Activities Assay
The plasmid pGL3-PCSK9-D4 contains the 5′ flanking region of the PCSK9 gene from −440 to −94 relative to the ATG start codon as previously described (33). To measure the PCSK9 promoter activity, HepG2 cells were seeded in 48-well plates at a density of 8 × 10⁵ cells per well. On the next day cells were transiently transfected with pGL3-PCSK9-D4 plasmids with turbofect reagent (Carlo Erba Reagents), and 48 h post transfection cells were incubated with serum-free medium in the presence or absence of insulin (10−7 m) for an additional 24 h. Luciferase activities were measured by using Neolite reagent (PerkinElmer Life Sciences according to the manufacturer's instructions. pCMV-β vector, encoding for β-galactosidase (Clontech, Mountain View, CA) was cotransfected as the internal control. β-Galactosidase activity was assayed as described (34). Luciferase activity was normalized to the β-galactosidase activity of the cotransfected pCMV-β construct.
RNA Preparation and Quantitative Real Time PCR
Total RNA was extracted with the iScript Sample Preparation Buffer (Bio-Rad) cDNA synthesis preparation reagents (Bio-Rad) according to manufacturer's instructions. Reverse transcription-polymerase first-strand cDNA synthesis was performed by using the iScript cDNA synthesis Kit (Bio-Rad). qPCR was then performed by using the Kit Thermo SYBR Green/ROX qPCR Master Mix (Carlo Erba Reagents) and specific primers for selected genes. Primer sequences used for qPCR analysis are shown in Table 1. The analyses were performed with the ABI Prism® 7000 Sequence Detection System (Applied Biosystems; Life Technologies Europe BV, Milan, Italy). PCR cycling conditions were as follows: 94 °C for 3 min, 40 cycles at 94 °C for 15 s, and 60 °C for 1 min. Data were expressed as Ct values and used for the relative quantification of targets with the ΔΔCt calculation.
TABLE 1.
Primer sequence utilized for the qPCR analysis
| Human | Sequences |
|---|---|
| Fatty acid synthase forward | 5′-GCAAATTCGACCTTTCTCAGAAC-3′ |
| Fatty acid synthase reverse | 5′-GGACCCCGTGGAATGTCA-3′ |
| HMG-CoA reductase forward | 5′-CTTGTGTGTCCTTGGTATTAGAGCTT-3′ |
| HMG-CoA reductase reverse | 5′-GCTGAGCTGCCAAATTGGA-3′ |
| SOCS3 forward | 5′-GACCAGCGCCACTTCTTCAC-3′ |
| SOCS3 reverse | 5′-CTGGATGCGCAGGTTCTTG-3′ |
| SREBP-1 forward | 5′-CGGAACCATCTTGGCAACA-3′ |
| SREBP-1 reverse | 5′-GCCGGTTGATAGGCAGCTT-3′ |
| SREBP-2 forward | 5′-AGCTGGTCTGTGAAG-3′ |
| SREBP-2 reverse | 5′-CGCAATGGGGTCAGC-3′ |
| HNF-1α forward | 5′-TGGCGCAGCAGTTCACCCAT-3′ |
| HNF-1α reverse | 5′-TGAAACGGTTCCTCCGCCCC-3′ |
| LDLR forward | 5′-GTGTCACAGCGGCG-3′ |
| LDLR reverse | 5′-CGCACTCTTTGATG-3′ |
| PCSK9 forward | 5′-CCTGCGCGTGTCAACT-3′ |
| PCSK9 reverse | 5′-GCTGGCTTTTCCGAAACTC-3′ |
| SCD-1 forward | 5′-CTATACCACCACCACCACCA-3′ |
| SCD-1 reverse | 5′-GGGCATCGTCTCCAACTTAT-3′ |
| apoB forward | 5′-GCAGACTGAGGCTACCATGA-3′ |
| apoB reverse | 5′-AGGATTGTTCCGAGGTCAAC-3′ |
| Mouse | |
| PCSK9 forward | 5′-AACCTGGAGCGAATTATCCCA-3′ |
| PCSK9 reverse | 5′-TTGAAGTCGGTGATGGTGACC-3′ |
Western Blot Analysis
Total cytosolic protein extracts of HepG2 and HepG2SOCS3 were obtained by collecting cells in 150 μl of Mammalian Protein Extraction Reagents (Thermo Fisher Scientific) containing a mixture of protease and phosphatase inhibitors (Roche Diagnostics). 20 μg of proteins and a molecular mass marker (Novex® Sharp Protein Standard, InvitrogenTM; Life Technologies Europe BV) were separated on 4–12% sodium dodecylsulfate-polyacrylamide gel (SDS-PAGE; Novex® NuPAGE® 4–12% Bis-Tris Mini Gels, InvitrogenTM; Life Technologies) under denaturing and reducing conditions. Proteins were then transferred to a nitrocellulose membrane by using the iBlotTM Gel Transfer Device (InvitrogenTM; Life Technologies). The membranes were washed with Tris-buffered saline-Tween 20 (TBS-T), and nonspecific binding sites were blocked in TBS-T containing 5% (BSA; Sigma) for 90 min at room temperature. The blots were incubated overnight at 4 °C with a diluted solution (5% BSA or nonfat dried milk) of the following human primary antibodies: anti-PCSK9 (1:100), anti SREBP-2 (1:200), anti-pAKT (1:100), anti-AKT (1:1,000), anti-pSTAT3 (1:10,000), anti-pIRS-1 (1:5,000), anti-SCD-1 (1:500), anti-STAT3 (1:1,000), anti-SREBP-1a (1:500), anti-SOCS3 (1:100), anti-HMG-CoA reductase (1:500), anti HNF-1α (1:1,000), and anti-α-tubulin (1:2,000). Membranes were washed with TBS-T and then exposed for 90 min at room temperature to a diluted solution (5% nonfat dried milk) of the secondary antibodies. Immunoreactive bands were detected by exposing the membranes to ClarityTM Western ECL chemiluminescent substrates (Bio-Rad) for 5 min, and images were acquired with a ChemiDocTM XRS system (Bio-Rad). Densitometric readings were evaluated using the ImageLabTM software as previously described. The values of the phosphorylated proteins were normalized to those of the corresponding constitutive forms to express arbitrary units of relative expression.
Analysis of the Data
Statistical analysis was performed using the Prism statistical analysis package Version 6.0 (GraphPad Software, San Diego, CA). Data are given as the mean ± S.D. of three independent experiments. When possible, p values were determined by Student's t test. Otherwise, differences between treatment groups were evaluated by one-way ANOVA. A probability value of p < 0.05 was considered statistically significant.
Results
TNF-α Induced SOCS3 and PCSK9 in HepG2 Cells
Release of proinflammatory cytokines such as TNF-α and IL-6 from adipocytes of obese subjects with IR has been shown to activate the JAK/STAT pathway at the hepatic levels and induce, either directly or indirectly, the transcription of different target genes including SOCS proteins (6, 7). In agreement with these observations we found that the incubation of hepatic cell line HepG2 with TNF-α induced the expression of SOCS3 mRNA in a time- and concentration-dependent manner (Fig. 1A), reaching the maximal induction after 24 h of incubation at the concentration of 10 ng/ml. This latter resulted in 3-fold induction of SOCS3 protein, evaluated by WB analysis (Fig. 1A). Under the same experimental conditions, TNF-α induced both PCSK9 mRNA, although to lower extent (Fig. 1B), and PCSK9 protein (+41%), as determined by WB analysis (Fig. 1B). Transfection of HepG2 cells with specific siRNA significantly down-regulated protein expression of STAT3 and SOCS3 (Fig. 1C). siRNA STAT3 completely blocked the induction of SOCS3 by TNF-α (Fig. 1D). A similar effect was observed on the expression levels of PCSK9, where siRNA to either SOCS3 or STAT3 blocked the effect of TNF-α (Fig. 1E). These results suggest the possibility that TNF-α induces PCSK9 by inducing the SOCS3 expression.
FIGURE 1.

TNF-α induced SOCS3 and PCSK9 in HepG2 cells. A and B, HepG2 cells were seeded in MEM, 10% FCS and the day after incubated with MEM supplemented with 10% LPDS for 6 h and 24 h in the presence or absence of different concentrations of TNF-α (0.1, 1, and 10 ng/ml). At the end of the incubation the total RNA was extracted, and mRNA levels of SOCS3 and PCSK9 were determined by qPCR. Insets of panels A and B SOCS3 and PCSK9 protein expression were evaluated by WB analysis from total protein extracts of HepG2 cells incubated for 24 h with 10 ng/ml TNF-α. α-Tubulin was used as loading control. C, HepG2 cells were seeded in MEM, 10% FCS and the day after transfected with siRNA scramble, STAT3, and SOCS3. After 48 h the medium was replaced with MEM with 10% LPDS. After an additional 24 h the protein expression of STAT3 and SOCS3 and α-tubulin were evaluated by WB analysis. D and E, cells were incubated under the same experimental conditions described for panels A and B in the presence or absence of 10 ng/ml TNF-α during the last 24 h of incubation in MEM with 10% LPDS. At the end of the incubation the total RNA was extracted, and mRNA levels of SOCS3 and PCSK9 were determined by qPCR. Differences between treatments were assessed by Student's t test and one-way ANOVA (when necessary): *, p < 0.05; **, p < 0.01; ***, p < 0.001.
SOCS3 Overexpression Induced PCSK9 in HepG2
To further investigate the role of SOCS3 on PCSK9 expression, we generated a retrovirally transduced HepG2 cell line with a plasmid encoding human SOCS3 (HepG2SOCS3). After puromycin selection, the mRNA and protein overexpression of exogenous human SOCS3 were evaluated by qPCR and WB analyses, respectively. HepG2SOCS3 cells were compared with HepG2 transduced with empty retroviral vector encoding only the puromycin resistance gene. As shown in Fig. 2A, retroviral transduction determined ∼90-fold induction of mRNA of SOCS3 that translated into a 70% increase of protein SOCS3 (Fig. 2B). The overexpression of SOCS3 abrogated basal STAT3 phosphorylation state (Fig. 2C).
FIGURE 2.

SOCS3 overexpression induced PCSK9 in HepG2 cells. A, HepG2 cells were retrovirally transduced with empty retroviral vector or encoding for human SOCS3. After puromycin selection the expression of SOCS3 mRNA was evaluated by qPCR in HepG2 and HepG2SOCS3 cultured in MEM supplemented with 10% LPDS for 24 h. B, under the same experimental conditions SOCS3 expression was determined by WB analysis from total cell lysates using an anti-SOCS3 antibody. The membrane was stripped and re-probed with anti-α-tubulin antibody as loading control. C, WB analyses with anti-phospho-STAT3 and anti-STAT3 were performed from the same samples described for panel B. D–F, HepG2 and HepG2SOCS3 cells were seeded in MEM, 10% FCS and the day after incubated with MEM containing 10% LPDS for 24 h. D, PCSK9 mRNA was determined by qPCR. Intracellular (E) and secreted (F) PCSK9 levels were evaluated by WB analysis and ELISA assay, respectively. For the determination of PCSK9 levels with WB analysis, the cells were incubated for 24 h under serum-free conditions. G and H, PCSK9 and SOCS3 mRNA expression levels (qPCR) were determined from total hepatic RNA of male ob/ob (n = 5) and C57BL/6 control mice (n = 5). I, HepG2 cells were seeded in MEM, 10% FCS and the day after transfected with siRNA scramble, SOCS3, and STAT3. After 48 h the medium was replaced with MEM with 10% LPDS. After an additional 24 h, the total RNA was extracted, and mRNA levels of PCSK9 were determined by qPCR. L, HepG2 and HepG2SOCS3 cells were transfected with pGL3-PCSK9-D4 or pGL3-PCSK9-SREmut or pGL3-PCSK9-HNFmut. The day after the transfection the medium was replaced with MEM containing 10% LPDS, and after an additional 24 h luciferase activities were determined by Neolite reagent. Luciferase activities were normalized to the β-galactosidase activity of the cotransfected pCMV-β construct. Differences between groups were assessed by Student's t test. *p < 0.05; **p < 0.01; ***, p < 0.001.
HepG2SOCS3 cells show higher levels of PCSK9 mRNA (3.48 ± 0.35-fold; Fig. 2D) and increased amounts of cellular and secreted PCSK9 (1.53-fold and 2.18 ± 0.38-fold, respectively; Fig. 2, E and F). Because SOCS3 has been shown to be up-regulated in animal models of obesity (6), we then evaluated the mRNA levels of PCSK9 and SOCS3 in the liver of ob/ob and wild-type C57BL/6 control mice. The ob/ob mice expressed higher levels of SOCS3 (6.46 ± 4.8-fold), and this condition was associated with a significant induction of PCSK9 (2.03 ± 1.54-fold) (Fig. 2, G and H). The inhibition of SOCS3 and STAT3 by siRNA resulted in an opposite effect on PCSK9 mRNA levels, with a significant reduction after transfection with siRNA SOCS3 and an induction with siRNA STAT3 (Fig. 2I).
We then investigated the effect of SOCS3 on PCSK9 promoter activity in HepG2 and HepG2SOCS3 transfected with the luciferase reporter construct pGL3-PCSK9-D4 (33). This plasmid contains the 5′-flanking region of the PCSK9 gene, from nucleotide −440 to −94 (relative to the ATG start codon), in front of the luciferase coding sequence. The relative luciferase activity of the PCSK9 promoter was not affected by the expression of SOCS3 in HepG2 cells (Fig. 2L). A similar response was observed by using the D4 construct containing the mutation of sterol regulatory element (SRE), whereas the mutation of HNF-1 site determined a significant increase of the promoter activity in HepG2SOCS3 cells, although the overall transcriptional activity was almost abolished (Fig. 2L).
To further investigate the effect of SOCS3 on PCSK9 mRNA induction, we determined the involvement of the SREBP factors by incubating HepG2 with 25-OH cholesterol (inhibitor of both SREBP-1 and SREBP-2) (32) or fatostatin (a more selective inhibitor of SREBP-1) (35). As shown in Fig. 3A, 25-OH cholesterol completely down-regulated the PCSK9 mRNA levels in both HepG2 and HepG2SOCS3. On the contrary, fatostatin affected exclusively the induction of PCSK9 in HepG2SOCS3 (Fig. 3B). SOCS3 overexpression induced the processing from the precursor to the active form of SREBP-1 (Fig. 3C). The activation of SREBP-2 was inhibited, with the accumulation of its precursor and a reduction of the active form (Fig. 3C). In addition, HNF-1α protein (+54%) and mRNA levels (2.87 ± 0.98-fold) were significantly induced in SOCS3-overexpressing cells (Fig. 3, C and D). The incubation with the transcriptional activity inhibitor, actinomycin D, showed that in HepG2SOCS3 the stability of PCSK9 mRNA was not affected compared with HepG2 (Fig. 3E). Taken together, these results suggest that the PCSK9 induction in response to SOCS3 overexpression is mainly mediated by a transcriptional-regulated process.
FIGURE 3.

SOCS3-dependent up-regulation of PCSK9 mRNA was mainly driven by a transcriptional mechanism. A–D, HepG2 and HepG2SOCS3 were seeded in MEM, 10% FCS and the day after incubated with MEM containing 10% LPDS for 24 h in the presence or absence of 25-OH cholesterol (5 μm; A) or fatostatin (40 μm; B). The levels of PCSK9 mRNA were then determined by qPCR. C, the levels of SREBP-1, SREBP-2, and HNF-1α were determined by WB analysis. Arrows indicate the active and the precursor forms SREBPs. Two different exposure times were utilized for the precursor and the active form of SREBP-2, which have been shown in two different panels. HNF-1α mRNA levels were determined by qPCR (D), and HepG2 and HepG2SOCS3 were incubated at the indicated times with actinomycin D (5 μg/ml) and PCSK9 mRNA, determined by qPCR (E). Differences between treatments were assessed by Student's t test and one-way ANOVA (when necessary). *, p < 0.05; **, p < 0.01 HepG2 versus HepG2SOCS3; §, p < 0.01 25-OH cholesterol versus untreated; #, p < 0.01 fatostatin versus untreated.
Pharmacological Inhibition of JAK/STAT Pathway Induced PCSK9
To further investigate the effect of STAT3 inhibition on PCSK9 expression, HepG2 cells were incubated with non-toxic concentration of STAT3-inhibitor MD77 (Fig. 4) (36). Incubation of HepG2 cells for 48 h with 10−7 m MD77 determined very similar cellular responses from those observed with SOCS3 overexpression. In particular, incubation with MD77 induced fatty acid synthase (FAS; 2.93 ± 1.28-fold; Fig. 4A), PCSK9 (2.06 ± 0.7-fold; Fig. 4B) and, only marginally, HMG-CoA reductase (1.58 ± 0.2-fold; Fig. 4C) with a not statistically significant reduction of LDLR (−45.3 ± 24.7%; Fig. 4D). The JAK inhibitor, JAK1, significantly increased FAS (1.56 ± 0.05-fold; Fig. 4E), PCSK9 (3.30 ± 0.32-fold; Fig. 4F), and HMG-CoA reductase (1.49 ± 0.09-fold; Fig. 4G) and marginally reduced the LDLR (−43.2 ± 24.2%; Fig. 4H). Consistent with the results with HepG2SOCS3, no effect on PCSK9 promoter activity was observed after 24 h of incubation with JAK1 (Fig. 4I). Taken together, these results demonstrate that the inhibition of the JAK/STAT pathway induces PCSK9 in HepG2 cells.
FIGURE 4.

Pharmacological inhibition of JAK/STAT pathway induced PCSK9 in HepG2 cells. HepG2 cells were seeded in MEM, 10% FCS and the day after incubated with MEM containing 10% LPDS for 24 h in the presence or absence of the STAT3 inhibitor MD77 (10−7 m) (A–D) or JAK inhibitor JAK1 (10−5 m) (E–H). mRNA levels of FAS (A and E), PCSK9 (B and F), HMG-CoA reductase (C and G), and LDLR (D and H) were determined by qPCR. I, HepG2 cells were transfected with pGL3-PCSK9-D4 or pGL3-PCSK9-SREmut or pGL3-PCSK9-HNFmut. The day after the transfection the medium was replaced with MEM containing 10% LPDS with or without JAK1 (10−5 m), and after an additional 24 h luciferase activities were determined by Neolite reagent. Luciferase activities were normalized to the β-galactosidase activity of the cotransfected pRSV-galactosidase construct. Differences between groups were assessed by Student's t test. *, p < 0.05; **, p < 0.01.
SOCS3 Overexpression Induced de Novo Lipogenesis in HepG2 Cells
In vivo evidence demonstrated the pivotal role of SOCS3 and STAT3 on lipid metabolism and SREBP-1 transcriptional activity (6, 7, 37). To verify that a similar response also occurs in our experimental model, we determined the mRNA levels of SREBP-1 target genes, such as FAS and SCD-1 and the levels of apoB. HepG2SOCS3 cells showed higher mRNA levels of FAS (3.59 ± 0.40-fold; Fig. 5A) as well as that of SCD-1 gene (1.92 ± 0.12-fold; Fig. 5B) and protein (3.81 ± 0.75-fold; Fig. 5C). Together with these changes, we observed a significant increment of apoB mRNA (4.08 ± 0.41-fold; Fig. 5D) and protein in the conditioned media (3.47 ± 0.09-fold; Fig. 5E). Accumulation of intracellular TG levels (22.1 ± 7.1 μg/mg of protein versus 38.3 ± 9.1 μg/mg of protein; Fig. 5F) was seen in HepG2SOCS3, with no significant changes in total cholesterol content (Fig. 5G).
FIGURE 5.

SOCS3 overexpression induced de novo lipogenesis in HepG2 cells. A, B, and D, HepG2 and HepG2SOCS3 cells were seeded in MEM, 10% FCS and the day after incubated with MEM supplemented with 10% LPDS for 24 h. mRNA levels of FAS, SCD-1, and apoB were evaluated by qPCR analysis from total RNA. C, under the same experimental conditions, the SCD-1 expression was determined by WB analysis from total protein extracts. E, HepG2 and HepG2SOCS3 were cultured in serum-free medium for 24 h in the presence or absence of 10−7 m insulin, conditioned media was then collected, and apoB concentrations were determined by ELISA assay. F and G, under the same experimental conditions described for panel A, the intracellular TG and cholesterol (Chol.) levels were determined in HepG2 and HepG2SOCS3 by using an enzymatic assay. The values were normalized for total protein content. H–I, HepG2 cells were seeded in MEM, 10% FCS and the day after transfected with siRNA scramble (scr.) and STAT3. After 48 h the medium was replaced with MEM with 10% LPDS in the presence or absence of 10 ng/ml TNF-α. After an additional 24 h, the total RNA were extracted, and mRNA levels of SCD-1, apoB, and FAS were determined by qPCR. Differences between HepG2 and HepG2SOCS3 were assessed by Student's t test, and one-way ANOVA (when necessary). *, p < 0.05; **, p < 0.01; ***, p < 0.001.
In response to TNF-α, we observed a significant induction of SCD-1, apoB, and FAS mRNA levels (2.11 ± 0.43, 1.60 ± 0.33, and 1.39 ± 0.21-fold, respectively; Fig. 5, H–L). These responses were reversed in HepG2 cells transfected with siRNA STAT3 (Fig. 5, H–L). Taken together, the overexpression of SOCS3 induced the de novo lipogenesis and increased apoB production in HepG2 cells, effects dependent on STAT3.
SOCS3 Overexpression Did Not Affect the Cholesterol Biosynthesis in HepG2
A series of experiments was performed to determine the effect of SOCS3 on genes under the control of SREBP-2, such as HMG-CoA reductase and LDLR. HMG-CoA reductase mRNA was induced in HepG2SOCS3 cells (2.10 ± 0.66-fold; Fig. 6A); conversely, the LDLR mRNA levels were reduced in response to SOCS3 overexpression (−56% ± 21.6%; Fig. 6B). These changes were not associated with significant variation of HMG-CoA reductase protein level (Fig. 6C). The lack of significant changes of HMG-CoA reductase was also confirmed by the fact that the cholesterol biosynthesis was not altered in HepG2SOCS3 cells compared with HepG2 cells (Fig. 6D).
FIGURE 6.
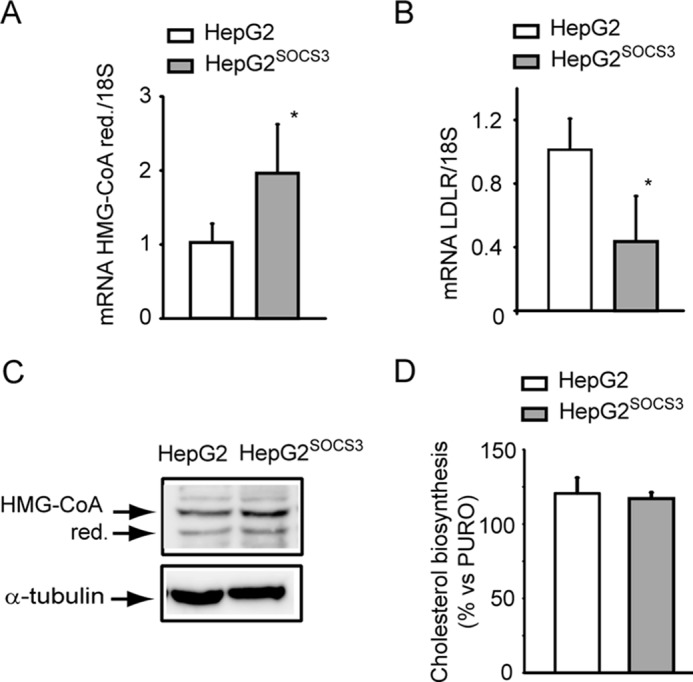
Cholesterol biosynthesis was not influenced by SOCS3 in HepG2 cells. A and B, HepG2 and HepG2SOCS3 cells were seeded in MEM, 10% FCS and the day after incubated with MEM containing 10% LPDS for 24 h and HMG-CoA reductase, and LDLR mRNA was determined by qPCR (A and B, respectively). C, under the same experimental conditions, HMG-CoA reductase (red.) expression was assessed by WB analysis from total protein extracts. D, HepG2 and HepG2SOCS3 were cultured in MEM containing 10% LPDS in the presence of [14C]acetate. After 48 h [14C]acetate incorporation into cellular cholesterol was evaluated. Each bar represents the mean ± S.D. of triplicate dishes. Differences between HepG2 and HepG2SOCS3 were assessed by Student's t test. *, p < 0.05.
Effect of SOCS3 Overexpression on Insulin-induced PCSK9 Expression
To corroborate the pathophysiological relevance of our observations, we then investigated the effect of SOCS3 overexpression on insulin signaling. As shown in Fig. 7A, in response to insulin (10−7 m), a significant induction of IRS-1 Tyr896 and Akt Ser473 phosphorylations was observed in HepG2. Overexpression of SOCS3 (HepG2SOCS3 cells) resulted in a reduced activation of both IRS-1 (Fig. 7A) and AKT (Fig. 7B) in response to insulin. In accordance with previous studies (38), ectopic expression of SOCS-3 appeared to elevate basal autophosphorylation, although this increase was not statistically significant.
FIGURE 7.

Effect of SOCS3 on insulin-induced IRS-1, Akt, and STAT3 phosphorylation. A–C, HepG2 and HepG2SOCS3 were seeded in MEM, 10% FCS and starved overnight with serum-free medium before stimulation with insulin (10−7 m) for 5 and 10 min. WB analysis was then performed from total protein extracts by using anti-pIRS-1, anti-pAkt, anti-pSTAT3, anti-STAT3, and anti-α-tubulin antibodies. Densitometric analysis was than evaluated using the ImageLabTM software. Differences between groups were assessed by one-way ANOVA.
Moreover, STAT3 phosphorylation was induced in response to insulin in control cells (HepG2), whereas SOCS3 overexpression (HepG2SOCS3) determined an abrogation of this response (Fig. 7C). As previously reported by Costet et al. (22), the incubation of HepG2 cells with insulin (10−7 m) significantly induced both PCSK9 secretion and mRNA (Fig. 8, A and B), and the presence of SOCS3 further up-regulated the response to insulin at the mRNA levels. However, this effect did not translate to a further induction of PCSK9 secretion in the cultured media, as determined by ELISA assay (Fig. 8A). Similarly, we observed an additive effect of insulin and SOCS3 on the FAS and SREBP-1 mRNA levels (Fig. 8, C and D) with no effect on SREBP-2 and HMG-CoA reductase levels (Fig. 8, E and F).
FIGURE 8.

Effect of insulin on PCSK9 expression in HepG2SOCS3. A–F, HepG2 and HepG2SOCS3 cells were seeded in MEM, 10% FCS and the day after incubated in serum-free medium for 24 h in the presence or absence of insulin (10−7 m). A, at the end of the incubation the PCSK9 levels in the conditioned media were evaluated by ELISA assay, and mRNA levels of PCSK9, FAS, SREBP-1, SREBP-2, and HMG-CoA reductase were determined by qPCR (B–F). Differences between groups were assessed by one-way ANOVA.
Discussion
In this paper, we tested the hypothesis that the inhibition of the JAK/STAT pathway by SOCS3 could influence the PCSK9 levels in hepatic cell line. The rationale of performing this study is based on at least four previously reported observations. 1) In clinical settings positive relationships of apoB-containing lipoproteins and PCSK9 have been observed (24–27). 2) SOCS3 overexpression in mice induces SREBP-1 transcriptional activation and de novo lipogenesis (6, 7). 3) PCSK9 has been shown to be transcriptionally regulated by SREBP-1 and SREBP-2 (22, 23). 4) The adipokine resistin and insulin induce SOCS3 and PCSK9 expression in cultured cell lines and animal models (5, 39–41).
The first novel aspect that we observed was the induction of PCSK9 in response to the proinflammatory cytokine TNF-α, the same factor that efficiently induces SOCS3 and has been implicated in chronic-inflammation associated with IR (42, 43). To study the possible link between SOCS3 and PCSK9, we first suppressed the expression of SOCS3 by siRNA in HepG2. By using this approach we demonstrated that SOCS3 is required for the TNF-α-driven induction of PCSK9. In addition, the silencing of STAT3 blocked the induction of SOCS3, PCSK9, apoB, and SCD-1 in response to TNF-α (Figs. 1 and 5). Although the effect of proinflammatory cytokines on genes regulating the de novo lipogenesis has been previously described (42, 44), our data proposes PCSK9 as a gene involved in lipid metabolism regulated by proinflammatory cytokine TNF-α in a SOCS3-dependent manner. We then established a hepatic cell line stably overexpressing SOCS3, the endogenous inhibitor of STAT proteins, and consistently found to be up-regulated in the liver of genetically and diet-induced obese animal (6, 7).
By WB analysis, we demonstrated that SOCS3 overexpression abrogated STAT3 phosphorylation and, thus, the JAK/STAT pathway. By using this cellular model, we observed a significant induction of both PCSK9 mRNA and protein. The involvement of both JAK and STAT proteins was then confirmed by the use of selective pharmacological inhibitors, JAK-I and MD77 (36). The suppression of STAT3 by siRNA induced PCSK9, whereas the opposite effect was seen after the down-regulation of SOCS3. In combination with the induction of PCSK9, we also observed increased SREBP-1 processing and a significant up-regulation of the key genes involved in the de novo lipogenesis, such as FAS and the SCD-1 together with the apoB mRNA, apoB, secretion, and intracellular TG. Interestingly, we noticed that PCSK9 was up-regulated in the liver of ob/ob mice together with SOCS3, possibly supporting the link between these two genes as observed in cultured system. However, as STAT3 is regulated by a large number of cytokines, like IL-6 and TNF-α (45), further in vivo studies are needed to elucidate the possible role of STAT3 in SOCS3-driven regulation of PCSK9. The consistent and very significant induction of apoB secretion confirmed the pivotal role of SOCS3 and the related inflammatory pathway on hypertriglyceridemia. In addition, our observation suggested a possible involvement of PCSK9 on apoB production by hepatic cells and/or by the liver of animal models previously described (46–48). For instance, the physical interaction between PCSK9 and apoB has been shown to increase apoB production, possibly through the inhibition of intracellular apoB degradation (48). Our evidence further delineates the potential link between PCSK9 and apoB by demonstrating that the inhibition of the JAK/STAT pathway by SOCS3 is a common determinant of their increased production and secretion. Notably, recent findings suggest that PCSK9 may directly induce apoB mRNA levels in enterocytes (49). It is, therefore, possible to speculate that SOCS3 could activate a positive feedback loop by increasing the expression levels of PCSK9, which in turn determines the induction of apoB secretion.
Previous studies have established the SREBP-dependent transcriptional activation of PCSK9. Indeed, similarly to the LDLR and other cholesterol-regulated genes, the proximal region of the PCSK9 promoter contains an SRE-1 motif (22, 50). In addition, two independent studies have demonstrated that insulin, by inducing SREBP-1c activity, induces PCSK9 both in vitro and in vivo (22, 41). We confirmed this evidence at both mRNA and protein levels, and the combination of SOCS3 and insulin determined a further induction of de novo lipogenesis genes, SREBP-1, and PCSK9, with no additive effect on PCSK9 secretion. These results are in agreement with previous studies showing that the inhibition of STAT proteins by SOCS3 suppresses the transcription of SREBP-1 (7). In our study the transcriptional activation of SREBP-1 was demonstrated by the induction of key genes involved in the lipid synthesis, such as FAS and SCD-1, whereas SREBP-2 appears to be unaffected by SOCS3 for at least three reasons. The cholesterol biosynthesis was not altered; an opposite regulation of two genes mainly regulated by SREBP-2 was observed (HMG-CoA reductase and LDLR), and the processing from the precursor to the active form of SREBP-2 was not induced in response to SOCS3 overexpression. The involvement of SREBPs was then demonstrated by the fact that the incubation with 25-OH cholesterol, which completely inhibits their activity, abolished PCSK9 expression. The contribution of SREBP-1, over the SREBP-2, in the regulation of PCSK9 was further corroborated by using fatostatin, a selective SREBP-1 inhibitor (35), which completely suppressed the PCSK9 mRNA levels in HepG2SOCS3. The involvement of HNF-1α on PCSK9 transcriptional regulation has been previously demonstrated (33, 51). In the present study we cannot exclude the involvement of HNF-1α in SOCS3-mediated PCSK9 induction as both protein and mRNA were increased. Moreover, the luciferase assay with the PCSK9 promoter region having either the HNF-1 or SRE site mutated was drastically suppressed. These data suggest a mutual requirement of both SREBP and HNF-1α on transcriptional regulation of PCSK9 (33).
The effect of SOCS3 on PCSK9 transcription, analyzed in HepG2 and HepG2SOCS3, transiently expressing the PCSK9 promoter-driven luciferase reporters PCSK9-D4 (33), found, unexpectedly, that this functional promoter was unresponsive to SOCS3 overexpression (Fig. 2L). These results suggest that the SOCS3 response sequences could possibly locate upstream of the promoter region considered. In this regard it is important to mention that the link between JAK/STAT pathway and PCSK9 has been previously investigated in the same cell line by the use of the cytokine oncostatin M (52). Similar to our study, oncostatin M did not affect the PCSK9 promoter activity (52). Because previous studies have shown that PCSK9 transcription is controlled through cis regulatory elements located in the proximal promoter region of the PCSK9 gene where the Sp1 sites and HNF1 and SRE-1 are located (23, 33, 51) we utilized also a PCSK9-D4 containing a mutation for the HNF-responsive element. Under this condition we detected a significant increase of the promoter activity in HepG2SOCS3 cells. These observation potentially related to the SREBP pathway, activated in response to STAT inhibition, although the overall activity was very low and potentially not responsible for the induction of PCSK9 mRNA levels (7). This effect was also not confirmed with the incubation of the JAK inhibitor, most likely because of the minor inhibition of the pathway in comparison with the complete block after SOCS3 overexpression.
We also exclude a SOCS3 effect on mRNA stability in the induction of PCSK9, as incubation with the transcriptional inhibitor actinomycin D did not affect mRNA stability compared with HepG2. Hence, additional analysis is required to better define the effect of SOCS3 on the transcriptional regulation of PCSK9. Several studies have described the effect of SOCS proteins on insulin signaling (1, 43, 53). Although the observations may differ by the cell type and by the time considered, the majority of the studies suggests that SOCS proteins control insulin action by reducing the expression of IRS proteins (1, 43, 53). Indeed, in our experimental conditions SOCS3 overexpression reduced both IRS-1 and Akt phosphorylation in response to insulin. Moreover, insulin stimulation of HepG2SOCS3 determined a further induction of genes related to de novo lipogenesis (FAS and SREBP-1) as well as PCSK9. Although this finding has been obtained in in vitro, it is conceivable to hypothesize a functional contribution of PCSK9 on the hypertriglyceridemic condition observed in type 2 diabetes mellitus and obesity. Indeed, PCSK9 directly affects the VLDR expression at the adipose tissue determining the accumulation of visceral adipose tissue in mice (54). For such an effect PCSK9-deficient mice show adipocyte hypertrophy, enhanced in vivo fatty acid uptake, and ex vivo triglyceride synthesis (54).
In conclusion, in the present study we provide evidence for the JAK/STAT-dependent expression of PCSK9 in the hepatic cell line, suggesting the potential molecular basis of the direct relationship between PCSK9 and TG levels observed in clinical trials (24–27).
Author Contributions
M. R. and N. F. conceived and coordinated the study, wrote the paper, and designed, performed, and analyzed all the experiments. C. R. performed the experiments shown in Figs. 1, 2, 3, 4, 5, and 7. C. M. performed the experiments shown in Figs. 1, 2, 3, and 6. R. C. performed the experiments shown in Figs. 2 and 3. A. C. and P. M. made critical revisions in the manuscript. J. L. made critical revisions in the manuscript and provided reagents for PCSK9 promoter activity. All authors reviewed the results and approved the final version of the manuscript.
This work was supported by Fondazione Cariplo Grant Rif. 2012-0549 (to A. C. and N. F.) and Piano di Sviluppo Università degli Studi di Milano 2014 linea B (to N. F. and M. R.). All the authors declare that they have no conflicts of interest with the contents of this article.
- SOCS3
- suppressor of cytokine signaling
- FA
- fatty acid
- FAS
- fatty acid synthase
- IR
- insulin resistance
- HMG-CoA
- 3-hydroxy-3-methylglutaryl coenzyme
- HNF
- hepatocyte nuclear factor
- LDL
- low density lipoprotein cholesterol
- PCSK9
- proprotein convertase subtilisin kexin type 9
- SREBP
- sterol regulatory element-binding protein
- SRE
- sterol regulatory element
- SCD
- stearoyl-CoA desaturase
- TG
- triglycerides
- WB
- Western blot
- qPCR
- quantitative-PCR
- LDLR
- LDL receptor
- LPDS
- lipoprotein plasma-deprived serum
- TEMED
- N,N,N',N'-tetramethylethylenediamine
- Bis-Tris
- 2-[bis(2-hydroxyethyl)amino]-2-(hydroxymethyl)propane-1,3-diol
- ANOVA
- analysis of variance
- MEM
- minimum Eagle's medium.
References
- 1. Galic S., Sachithanandan N., Kay T. W., and Steinberg G. R. (2014) Suppressor of cytokine signalling (SOCS) proteins as guardians of inflammatory responses critical for regulating insulin sensitivity. Biochem. J. 461, 177–188 [DOI] [PubMed] [Google Scholar]
- 2. Naka T., Narazaki M., Hirata M., Matsumoto T., Minamoto S., Aono A., Nishimoto N., Kajita T., Taga T., Yoshizaki K., Akira S., and Kishimoto T. (1997) Structure and function of a new STAT-induced STAT inhibitor. Nature 387, 924–929 [DOI] [PubMed] [Google Scholar]
- 3. Emanuelli B., Peraldi P., Filloux C., Sawka-Verhelle D., Hilton D., and Van Obberghen E. (2000) SOCS-3 is an insulin-induced negative regulator of insulin signaling. J. Biol. Chem. 275, 15985–15991 [DOI] [PubMed] [Google Scholar]
- 4. Bjørbaek C., El-Haschimi K., Frantz J. D., and Flier J. S. (1999) The role of SOCS-3 in leptin signaling and leptin resistance. J. Biol. Chem. 274, 30059–30065 [DOI] [PubMed] [Google Scholar]
- 5. Steppan C. M., Wang J., Whiteman E. L., Birnbaum M. J., and Lazar M. A. (2005) Activation of SOCS-3 by resistin. Mol. Cell. Biol. 25, 1569–1575 [DOI] [PMC free article] [PubMed] [Google Scholar]
- 6. Ueki K., Kondo T., and Kahn C. R. (2004) Suppressor of cytokine signaling 1 (SOCS-1) and SOCS-3 cause insulin resistance through inhibition of tyrosine phosphorylation of insulin receptor substrate proteins by discrete mechanisms. Mol. Cell. Biol. 24, 5434–5446 [DOI] [PMC free article] [PubMed] [Google Scholar]
- 7. Ueki K., Kondo T., Tseng Y. H., and Kahn C. R. (2004) Central role of suppressors of cytokine signaling proteins in hepatic steatosis, insulin resistance, and the metabolic syndrome in the mouse. Proc. Natl. Acad. Sci. U.S.A. 101, 10422–10427 [DOI] [PMC free article] [PubMed] [Google Scholar]
- 8. Elam M. B., Yellaturu C., Howell G. E., Deng X., Cowan G. S., Kumar P., Park E. A., Hiler M. L., Wilcox H. G., Hughes T. A., Cook G. A., and Raghow R. (2010) Dysregulation of sterol regulatory element binding protein-1c in livers of morbidly obese women is associated with altered suppressor of cytokine signaling-3 and signal transducer and activator of transcription-1 signaling. Metab. Clin. Exp. 59, 587–598 [DOI] [PMC free article] [PubMed] [Google Scholar]
- 9. Seidah N. G., and Prat A. (2012) The biology and therapeutic targeting of the proprotein convertases. Nat. Rev. Drug. Discov. 11, 367–383 [DOI] [PubMed] [Google Scholar]
- 10. Abifadel M., Varret M., Rabès J. P., Allard D., Ouguerram K., Devillers M., Cruaud C., Benjannet S., Wickham L., Erlich D., Derré A., Villéger L., Farnier M., Beucler I., Bruckert E., Chambaz J., Chanu B., Lecerf J. M., Luc G., Moulin P., Weissenbach J., Prat A., Krempf M., Junien C., Seidah N. G., and Boileau C. (2003) Mutations in PCSK9 cause autosomal dominant hypercholesterolemia. Nat. Genet. 34, 154–156 [DOI] [PubMed] [Google Scholar]
- 11. Ferri N., Corsini A., Macchi C., Magni P., and Ruscica M. (2015) Proprotein convertase subtilisin kexin type 9 and high-density lipoprotein metabolism: experimental animal models and clinical evidence. Transl. Res. 10.1016/j.trsl.2015.10.004 [DOI] [PubMed] [Google Scholar]
- 12. Ferri N., Tibolla G., Pirillo A., Cipollone F., Mezzetti A., Pacia S., Corsini A., and Catapano A. L. (2012) Proprotein convertase subtilisin kexin type 9 (PCSK9) secreted by cultured smooth muscle cells reduces macrophages LDLR levels. Atherosclerosis 220, 381–386 [DOI] [PubMed] [Google Scholar]
- 13. McNutt M. C., Lagace T. A., and Horton J. D. (2007) Catalytic activity is not required for secreted PCSK9 to reduce low density lipoprotein receptors in HepG2 cells. J. Biol. Chem. 282, 20799–20803 [DOI] [PubMed] [Google Scholar]
- 14. Maxwell K. N., Soccio R. E., Duncan E. M., Sehayek E., and Breslow J. L. (2003) Novel putative SREBP and LXR target genes identified by microarray analysis in liver of cholesterol-fed mice. J. Lipid Res. 44, 2109–2119 [DOI] [PubMed] [Google Scholar]
- 15. Guo Y. L., Liu J., Xu R. X., Zhu C. G., Wu N. Q., Jiang L. X., and Li J. J. (2013) Short-term impact of low-dose atorvastatin on serum proprotein convertase subtilisin/kexin type 9. Clin. Drug Investig. 33, 877–883 [DOI] [PubMed] [Google Scholar]
- 16. Careskey H. E., Davis R. A., Alborn W. E., Troutt J. S., Cao G., and Konrad R. J. (2008) Atorvastatin increases human serum levels of proprotein convertase subtilisin/kexin type 9. J. Lipid Res. 49, 394–398 [DOI] [PubMed] [Google Scholar]
- 17. Huijgen R., Boekholdt S. M., Arsenault B. J., Bao W., Davaine J. M., Tabet F., Petrides F., Rye K. A., DeMicco D. A., Barter P. J., Kastelein J. J., and Lambert G. (2012) Plasma PCSK9 levels and clinical outcomes in the TNT (treating to new targets) trial: a nested case-control study. J. Am. Coll. Cardiol. 59, 1778–1784 [DOI] [PubMed] [Google Scholar]
- 18. Goldstein J. L., DeBose-Boyd R. A., and Brown M. S. (2006) Protein sensors for membrane sterols. Cell 124, 35–46 [DOI] [PubMed] [Google Scholar]
- 19. Horton J. D., Goldstein J. L., and Brown M. S. (2002) SREBPs: activators of the complete program of cholesterol and fatty acid synthesis in the liver. J. Clin. Invest. 109, 1125–1131 [DOI] [PMC free article] [PubMed] [Google Scholar]
- 20. Horton J. D., Shah N. A., Warrington J. A., Anderson N. N., Park S. W., Brown M. S., and Goldstein J. L. (2003) Combined analysis of oligonucleotide microarray data from transgenic and knockout mice identifies direct SREBP target genes. Proc. Natl. Acad. Sci. U.S.A. 100, 12027–12032 [DOI] [PMC free article] [PubMed] [Google Scholar]
- 21. Dubuc G., Tremblay M., Paré G., Jacques H., Hamelin J., Benjannet S., Boulet L., Genest J., Bernier L., Seidah N. G., and Davignon J. (2010) A new method for measurement of total plasma PCSK9: clinical applications. J. Lipid Res. 51, 140–149 [DOI] [PMC free article] [PubMed] [Google Scholar]
- 22. Costet P., Cariou B., Lambert G., Lalanne F., Lardeux B., Jarnoux A. L., Grefhorst A., Staels B., and Krempf M. (2006) Hepatic PCSK9 expression is regulated by nutritional status via insulin and sterol regulatory element-binding protein 1c. J. Biol. Chem. 281, 6211–6218 [DOI] [PubMed] [Google Scholar]
- 23. Jeong H. J., Lee H. S., Kim K. S., Kim Y. K., Yoon D., and Park S. W. (2008) Sterol-dependent regulation of proprotein convertase subtilisin/kexin type 9 expression by sterol-regulatory element binding protein-2. J. Lipid Res. 49, 399–409 [DOI] [PubMed] [Google Scholar]
- 24. Cariou B., Langhi C., Le Bras M., Bortolotti M., Lê K. A., Theytaz F., Le May C., Guyomarc'h-Delasalle B., Zaïr Y., Kreis R., Boesch C., Krempf M., Tappy L., and Costet P. (2013) Plasma PCSK9 concentrations during an oral fat load and after short term high-fat, high-fat high-protein and high-fructose diets. Nutrition Metabolism 10, 4. [DOI] [PMC free article] [PubMed] [Google Scholar]
- 25. Lakoski S. G., Lagace T. A., Cohen J. C., Horton J. D., and Hobbs H. H. (2009) Genetic and metabolic determinants of plasma PCSK9 levels. J. Clin. Endocrinol. Metab. 94, 2537–2543 [DOI] [PMC free article] [PubMed] [Google Scholar]
- 26. Alborn W. E., Cao G., Careskey H. E., Qian Y. W., Subramaniam D. R., Davies J., Conner E. M., and Konrad R. J. (2007) Serum proprotein convertase subtilisin kexin type 9 is correlated directly with serum LDL cholesterol. Clin. Chem. 53, 1814–1819 [DOI] [PubMed] [Google Scholar]
- 27. Baass A., Dubuc G., Tremblay M., Delvin E. E., O'Loughlin J., Levy E., Davignon J., and Lambert M. (2009) Plasma PCSK9 is associated with age, sex, and multiple metabolic markers in a population-based sample of children and adolescents. Clin. Chem. 55, 1637–1645 [DOI] [PubMed] [Google Scholar]
- 28. Garton K. J., Ferri N., and Raines E. W. (2002) Efficient expression of exogenous genes in primary vascular cells using IRES-based retroviral vectors. Biotechniques 32, 830. [DOI] [PubMed] [Google Scholar]
- 29. Ferri N., Garton K. J., and Raines E. W. (2003) An NF-kappaB-dependent transcriptional program is required for collagen remodeling by human smooth muscle cells. J. Biol. Chem. 278, 19757–19764 [DOI] [PubMed] [Google Scholar]
- 30. Greco C. M., Camera M., Facchinetti L., Brambilla M., Pellegrino S., Gelmi M. L., Tremoli E., Corsini A., and Ferri N. (2012) Chemotactic effect of prorenin on human aortic smooth muscle cells: a novel function of the (pro)renin receptor. Cardiovasc. Res. 95, 366–374 [DOI] [PubMed] [Google Scholar]
- 31. Ferri N., Colombo G., Ferrandi C., Raines E. W., Levkau B., and Corsini A. (2007) Simvastatin reduces MMP1 expression in human smooth muscle cells cultured on polymerized collagen by inhibiting Rac1 activation. Arterioscler. Thromb. Vasc. Biol. 27, 1043–1049 [DOI] [PubMed] [Google Scholar]
- 32. Corsini A., Verri D., Raiteri M., Quarato P., Paoletti R., and Fumagalli R. (1995) Effects of 26-aminocholesterol, 27-hydroxycholesterol, and 25-hydroxycholesterol on proliferation and cholesterol homeostasis in arterial myocytes. Arterioscler. Thromb. Vasc. Biol. 15, 420–428 [DOI] [PubMed] [Google Scholar]
- 33. Li H., Dong B., Park S. W., Lee H. S., Chen W., and Liu J. (2009) Hepatocyte nuclear factor 1α plays a critical role in PCSK9 gene transcription and regulation by the natural hypocholesterolemic compound berberine. J. Biol. Chem. 284, 28885–28895 [DOI] [PMC free article] [PubMed] [Google Scholar]
- 34. Norata G. D., Banfi C., Pirillo A., Tremoli E., Hamsten A., Catapano A. L., and Eriksson P. (2004) Oxidised-HDL3 induces the expression of PAI-1 in human endothelial cells. Role of p38MAPK activation and mRNA stabilization. Br. J. Haematol 127, 97–104 [DOI] [PubMed] [Google Scholar]
- 35. Kamisuki S., Mao Q., Abu-Elheiga L., Gu Z., Kugimiya A., Kwon Y., Shinohara T., Kawazoe Y., Sato S., Asakura K., Choo H. Y., Sakai J., Wakil S. J., and Uesugi M. (2009) A small molecule that blocks fat synthesis by inhibiting the activation of SREBP. Chem. Biol. 16, 882–892 [DOI] [PubMed] [Google Scholar]
- 36. Masciocchi D., Villa S., Meneghetti F., Pedretti A., Barlocco D., Legnani L., Toma L., Kwon B. M., Nakano S., Asai A., and Gelain A. (2012) Biological and computational evaluation of an oxadiazole derivative (MD77) as a new lead for direct STAT3 inhibitors. MedChemComm 3, 592–599 [Google Scholar]
- 37. Giunzioni L., Tavori H., Covarrubias R., Major A. S., Ding L., Zhang Y., DeVay R. M., Hong L., Fan D., Predazzi I. M., Rashid S., Linton M. F., and Fazio S. (2015) Local Effects of Human PCSK9 on the Atherosclerotic Lesion. J. Pathol. 10.1002/path.4630 [DOI] [PMC free article] [PubMed] [Google Scholar]
- 38. Pellegrino S., Ferri N., Colombo N., Cremona E., Corsini A., Fanelli R., Gelmi M. L., and Cabrele C. (2009) Synthetic peptides containing a conserved sequence motif of the Id protein family modulate vascular smooth muscle cell phenotype. Bioorg. Med. Chem. Lett. 19, 6298–6302 [DOI] [PubMed] [Google Scholar]
- 39. Pirvulescu M., Manduteanu I., Gan A. M., Stan D., Simion V., Butoi E., Calin M., and Simionescu M. (2012) A novel pro-inflammatory mechanism of action of resistin in human endothelial cells: up-regulation of SOCS3 expression through STAT3 activation. Biochem. Biophys. Res. Commun. 422, 321–326 [DOI] [PubMed] [Google Scholar]
- 40. Melone M., Wilsie L., Palyha O., Strack A., and Rashid S. (2012) Discovery of a new role of human resistin in hepatocyte low-density lipoprotein receptor suppression mediated in part by proprotein convertase subtilisin/kexin type 9. J. Am. Coll. Cardiol. 59, 1697–1705 [DOI] [PubMed] [Google Scholar]
- 41. Chorba J. S., and Shokat K. M. (2014) The proprotein convertase subtilisin/kexin type 9 (PCSK9) active site and cleavage sequence differentially regulate protein secretion from proteolysis. J. Biol. Chem. 289, 29030–29043 [DOI] [PMC free article] [PubMed] [Google Scholar]
- 42. Hotamisligil G. S., Shargill N. S., and Spiegelman B. M. (1993) Adipose expression of tumor necrosis factor-α: direct role in obesity-linked insulin resistance. Science 259, 87–91 [DOI] [PubMed] [Google Scholar]
- 43. Torisu T., Sato N., Yoshiga D., Kobayashi T., Yoshioka T., Mori H., Iida M., and Yoshimura A. (2007) The dual function of hepatic SOCS3 in insulin resistance in vivo. Genes Cells 12, 143–154 [DOI] [PubMed] [Google Scholar]
- 44. Adorni M. P., Favari E., Ronda N., Granata A., Bellosta S., Arnaboldi L., Corsini A., Gatti R., and Bernini F. (2011) Free cholesterol alters macrophage morphology and mobility by an ABCA1-dependent mechanism. Atherosclerosis 215, 70–76 [DOI] [PubMed] [Google Scholar]
- 45. Cui Y., Huang L., Elefteriou F., Yang G., Shelton J. M., Giles J. E., Oz O. K., Pourbahrami T., Lu C. Y., Richardson J. A., Karsenty G., and Li C. (2004) Essential role of STAT3 in body weight and glucose homeostasis. Mol. Cell. Biol. 24, 258–269 [DOI] [PMC free article] [PubMed] [Google Scholar]
- 46. Benjannet S., Rhainds D., Hamelin J., Nassoury N., and Seidah N. G. (2006) The proprotein convertase (PC) PCSK9 is inactivated by furin and/or PC5/6A: functional consequences of natural mutations and post-translational modifications. J. Biol. Chem. 281, 30561–30572 [DOI] [PubMed] [Google Scholar]
- 47. Ouguerram K., Chetiveaux M., Zair Y., Costet P., Abifadel M., Varret M., Boileau C., Magot T., and Krempf M. (2004) Apolipoprotein B100 metabolism in autosomal-dominant hypercholesterolemia related to mutations in PCSK9. Arterioscler. Thromb. Vasc. Biol. 24, 1448–1453 [DOI] [PubMed] [Google Scholar]
- 48. Sun H., Samarghandi A., Zhang N., Yao Z., Xiong M., and Teng B. B. (2012) Proprotein convertase subtilisin/kexin type 9 interacts with apolipoprotein b and prevents its intracellular degradation, irrespective of the low-density lipoprotein receptor. Arterioscler. Thromb. Vasc. Biol. 32, 1585–1595 [DOI] [PubMed] [Google Scholar]
- 49. Rashid S., Tavori H., Brown P. E., Linton M. F., He J., Giunzioni I., and Fazio S. (2014) Proprotein convertase subtilisin kexin type 9 promotes intestinal overproduction of triglyceride-rich apolipoprotein B lipoproteins through both low-density lipoprotein receptor-dependent and -independent mechanisms. Circulation 130, 431–441 [DOI] [PMC free article] [PubMed] [Google Scholar]
- 50. Dubuc G., Chamberland A., Wassef H., Davignon J., Seidah N. G., Bernier L., and Prat A. (2004) Statins upregulate PCSK9, the gene encoding the proprotein convertase neural apoptosis-regulated convertase-1 implicated in familial hypercholesterolemia. Arterioscler. Thromb. Vasc. Biol. 24, 1454–1459 [DOI] [PubMed] [Google Scholar]
- 51. Shende V. R., Wu M., Singh A. B., Dong B., Kan C. F., and Liu J. (2015) Reduction of circulating PCSK9 and LDL-C levels by liver-specific knockdown of HNF1α in normolipidemic mice. J. Lipid Res. 56, 801–809 [DOI] [PMC free article] [PubMed] [Google Scholar]
- 52. Cao A., Wu M., Li H., and Liu J. (2011) Janus kinase activation by cytokine oncostatin M decreases PCSK9 expression in liver cells. J. Lipid Res. 52, 518–530 [DOI] [PMC free article] [PubMed] [Google Scholar]
- 53. Emanuelli B., Peraldi P., Filloux C., Chavey C., Freidinger K., Hilton D. J., Hotamisligil G. S., and Van Obberghen E. (2001) SOCS-3 inhibits insulin signaling and is up-regulated in response to tumor necrosis factor-α in the adipose tissue of obese mice. J. Biol. Chem. 276, 47944–47949 [DOI] [PubMed] [Google Scholar]
- 54. Roubtsova A., Munkonda M. N., Awan Z., Marcinkiewicz J., Chamberland A., Lazure C., Cianflone K., Seidah N. G., and Prat A. (2011) Circulating proprotein convertase subtilisin/kexin 9 (PCSK9) regulates VLDLR protein and triglyceride accumulation in visceral adipose tissue. Arterioscler. Thromb. Vasc. Biol. 31, 785–791 [DOI] [PubMed] [Google Scholar]