

A novel posttranscriptional mechanism for regulating the neuronal protein GAP-43 is reported. The mRNA-binding protein hnRNP-Q1 represses Gap-43 mRNA translation by a mechanism involving a 5′ untranslated region G-quadruplex structure, which affects GAP-43 function, as demonstrated by a GAP-43–dependent increase in neurite length and number with hnRNP-Q1 knockdown.
Abstract
Posttranscriptional regulation of gene expression by mRNA-binding proteins is critical for neuronal development and function. hnRNP-Q1 is an mRNA-binding protein that regulates mRNA processing events, including translational repression. hnRNP-Q1 is highly expressed in brain tissue, suggesting a function in regulating genes critical for neuronal development. In this study, we have identified Growth-associated protein 43 (Gap-43) mRNA as a novel target of hnRNP-Q1 and have demonstrated that hnRNP-Q1 represses Gap-43 mRNA translation and consequently GAP-43 function. GAP-43 is a neuronal protein that regulates actin dynamics in growth cones and facilitates axonal growth. Previous studies have identified factors that regulate Gap-43 mRNA stability and localization, but it remains unclear whether Gap-43 mRNA translation is also regulated. Our results reveal that hnRNP-Q1 knockdown increased nascent axon length, total neurite length, and neurite number in mouse embryonic cortical neurons and enhanced Neuro2a cell process extension; these phenotypes were rescued by GAP-43 knockdown. Additionally, we have identified a G-quadruplex structure in the 5′ untranslated region of Gap-43 mRNA that directly interacts with hnRNP-Q1 as a means to inhibit Gap-43 mRNA translation. Therefore hnRNP-Q1–mediated repression of Gap-43 mRNA translation provides an additional mechanism for regulating GAP-43 expression and function and may be critical for neuronal development.
INTRODUCTION
Heterogeneous ribonucleoprotein Q, isoform 1 (hnRNP-Q1 [ Mourelatos et al., 2001], Nsap1/Syncrip/hnRNP-Q2 [ Harris et al., 1999; Mizutani et al., 2000; Svitkin et al., 2013]) is a ubiquitous mRNA-binding protein that demonstrates high expression in the brain (Mizutani et al., 2000; Rossoll et al., 2002; Xing et al., 2012). It contains two different RNA-binding domains, three RNA recognition motifs, and a single arginine- and glycine-rich region (RGG box) (Mourelatos et al., 2001). hnRNP-Q1 participates in several mRNA processing events, including splicing, editing, transport, translation, and decay (Wigington et al., 2014). Unlike other hnRNP-Q isoforms, hnRNP-Q1 is mainly localized to the cytoplasm, suggesting that functions in mRNA translation, localization, and/or decay regulation are of higher importance (Mourelatos et al., 2001). Supporting this, hnRNP-Q1 has recently been demonstrated to repress RhoA mRNA translation and regulate Cdc42 mRNA localization (Chen et al., 2012; Xing et al., 2012). Given the high expression of hnRNP-Q1 in brain, we predict that hnRNP-Q1 posttranscriptionally regulates the expression of many mRNA targets, which are potentially involved in neuronal development and function.
GAP-43 is a neuronal-specific protein that regulates multiple aspects of neuronal development, plasticity, and regeneration (Denny, 2006). GAP-43 is enriched in axonal growth cones after polarity is established and also accumulates along nascent axons in cultured hippocampal neurons, suggesting an important early role for GAP-43 in axon outgrowth (Goslin et al., 1990). GAP-43 regulates actin dynamics by at least two distinct mechanisms: actin polymerization/depolymerization and sequestering the lipid modulator phosphatidylinositol 4,5-bisphosphate (He et al., 1997; Laux et al., 2000). GAP-43 overexpression is generally associated with increased growth in neurons (Aigner et al., 1995; Donnelly et al., 2011, 2013; Leu et al., 2010), and the importance of GAP-43 is demonstrated by impaired neuronal development and axon guidance in GAP-43–deficient mice (Donovan et al., 2002; Shen et al., 2002; McIlvain et al., 2003; Strittmatter et al., 1995). GAP-43 also plays an important role in neuronal regeneration, with increased GAP-43 expression observed during regeneration (Erzurumlu et al., 1989; Van der Zee et al., 1989) and increased GAP-43 protein levels promoting axon sprouting and regeneration after injury and vice versa (Campbell et al., 1991; Schreyer and Skene, 1991; Andersen and Schreyer, 1999; Grasselli et al., 2011; Allegra Mascaro et al., 2013). Additionally, GAP-43 is required for proper learning and memory formation (Rekart et al., 2005; Holahan and Routtenberg, 2008), and altered expression of GAP-43 is linked to brain disease (de la Monte et al., 1995; Bogdanovic et al., 2000; Tian et al., 2007; Zaccaria et al., 2010). These critical functions of GAP-43 motivate a better understanding of how the expression of this protein is regulated.
Precise spatial and temporal control of GAP-43 protein levels is achieved through multiple mechanisms and is critical for GAP-43 function. The Gap-43 gene is transcribed exclusively in neuronal cells due to a repressive element in its promoter region (Weber and Skene, 1997) and specific transcription factors (Chiaramello et al., 1996; Diolaiti et al., 2007; Tedeschi et al., 2009). Gap-43 mRNA stability is increased by HuD, a neuronal ELAV family mRNA-binding protein, binding the 3′-UTR (Chung et al., 1997; Anderson et al., 2000) and decreased by KSRP, a KH-type splicing regulatory protein, competing with HuD for binding (Bird et al., 2013). Also, Gap-43 mRNA localization to dorsal root ganglia axons is regulated by the mRNA-binding protein IMP1/ZBP1 (Donnelly et al., 2011). Gap-43 mRNA translation is also likely regulated as an additional mechanism to control GAP-43 expression, but the factors involved have not been identified. In this paper, we show that hnRNP-Q1 inhibits primary cortical neuron nascent axon length, total neurite length and neurite number, and Neuro2a (N2a) cell process extension by repressing GAP-43 expression. hnRNP-Q1 specifically represses Gap-43 mRNA translation, and a G-quadruplex (GQ) structure in the 5′-UTR of the mRNA is involved in the mechanism. Therefore our findings reveal a novel posttranscriptional mechanism for regulating GAP-43 expression that may contribute to the precise control of GAP-43 expression during neuronal development.
RESULTS
Two model systems were used for our experiments, the mouse neuroblastoma cell line N2a and primary mouse cortical neurons, as a means to assess multiple aspects of hnRNP-Q1–mediated repression of Gap-43 mRNA translation. N2a cells are an ideal neuronal model system, because they are highly amenable to biochemical experiments and can be differentiated into neuron-like cells (Klebe and Ruddle, 1969; Munoz et al., 2000). Primary cortical neurons were used due to high expression of hnRNP-Q1 in the forebrain (Mizutani et al., 2000; Rossoll et al., 2002; Xing et al., 2012). Cultured primary cortical neurons differentiate axons and dendrites and undergo neuronal differentiation (Kosik and Finch, 1987), and we have used them previously to examine early stages of axon outgrowth (Welshhans and Bassell, 2011).
Elevated GAP-43 expression in hnRNP-Q1–deficient N2a cells and cortical neurons
We first sought to determine whether GAP-43 protein levels were affected by hnRNP-Q1 knockdown, because GAP-43 is an important neuronal protein and hnRNP-Q1 is highly expressed in the brain. N2a cells were transfected with hnRNP-Q1 small interfering RNAs (siRNAs) targeting sequences in the 3′ untranslated region (3′-UTR) that are not present in other hnRNP-Q isoforms. Scrambled (Scr) siRNA was used as a control. Immunoblot analysis of cell lysates 72 h after transfection revealed that hnRNP-Q1 can be efficiently depleted (siRNA 1 = 0.31-fold, siRNA 2 = 0.44-fold, and siRNA 3 = 0.67-fold; Figure 1A). Interestingly, GAP-43 protein levels were increased according to the degree of hnRNP-Q1 depletion (siRNA 1 = 2.99-fold, siRNA 2 = 2.30-fold, and siRNA 3 = 1.72-fold; Figure 1A). The levels of the highly homologous proteins hnRNP-R and hnRNP-Q3 and γ-actin protein were not significantly affected (Figure 1A). hnRNP-Q1 siRNA 1 was used for the remainder of the experiments, because it demonstrated the greatest knockdown. Quantitative real time-PCR (qRT-PCR) was performed to determine whether hnRNP-Q1 knockdown affects Gap-43 mRNA levels. We found that neither Gap-43 nor γ-actin mRNA levels were significantly altered upon hnRNP-Q1 knockdown (1.02-fold and 1.05-fold, respectively; Figure 1B) suggesting that hnRNP-Q1 may regulate GAP-43 expression through a translational mechanism.
FIGURE 1:

Increased GAP-43 protein expression upon hnRNP-Q1 knockdown. (A) GAP-43 and γ-actin protein levels were assessed by immunoblot in N2a cell lysates 72 h after hnRNP-Q1 #1, hnRNP-Q1 #2, hnRNP-Q1 #3, or Scr siRNA transfection. n = 6, one-way analysis of variance (ANOVA), Dunnett’s posthoc, hnRNP-R p values: Scr vs. Q1 #1, p = 0.3897; Scr vs. Q1 #2, p = 0.2057; Scr vs. Q1 #3, p = 0.1801; hnRNP-Q3 p values: Scr vs. Q1 #1, p = 0.8869; Scr vs. Q1 #2, p = 0.4025; Scr vs. Q1 #3, p = 0.8486; hnRNP-Q1 p values: Scr vs. Q1 #1, p < 0.0001; Scr vs. Q1 #2, p < 0.0001; Scr vs. Q1 #3, p = 0.0002; GAP-43 p values: Scr vs. Q1 #1, p < 0.0001; Scr vs. Q1 #2, p < 0.0001; Scr vs. Q1 #3, p = 0.0163; γ-actin p values: Scr vs. Q1 #1, p = 0.8493; Scr vs. Q1 #2, p = 0.3335; Scr vs. Q1 #3, p = 0.9995. (B) Gap-43 and γ-actin mRNA levels were assessed by qRT-PCR in N2a cell lysates 72 h after hnRNP-Q1 #1 or Scr siRNA transfection. n = 6, one-sample t test, p values: Gap-43, p = 0.6415; γ-actin, p = 0.8956. (C–G) Primary cortical neurons were transfected with hnRNP-Q1 #1 or Scr siRNA + Lifeact-GFP by nucleofection and cultured for 28.5 h. GAP-43 and hnRNP-Q1 were detected by immunofluorescence, and GFP-positive cells were imaged. (C) Representative images with inset heat maps and (D) enlarged views of the nascent axon with a GAP-43 heat map (white boxes in C). Scale bars: 10 μm. Quantification of GAP-43 and hnRNP-Q1 signal intensity in (E) cell bodies and (F) the nascent axon. n = 6, Scr: 198 neurons and Q1: 178 neurons from six independent experiments, one-sample t test, cell body p values: hnRNP-Q1, p < 0.0001; GAP-43, p = 0.0002; nascent axon p values: hnRNP-Q1, p = 0.2044; GAP-43, p < 0.0001. (G) Ratio of nascent axon/cell body GAP-43 protein levels. n = 6, Scr: 198 neurons and Q1: 178 neurons from six independent experiments, one-sample t test, p value = 0.0002.
Primary cortical neurons were also assessed to determine whether hnRNP-Q1 depletion increases GAP-43 protein expression at the subcellular level. Neurons were electroporated with hnRNP-Q1 #1 or Scr siRNA and Lifeact–green fluorescent protein (GFP) immediately following the dissection and were fixed after 28.5 h in culture. siRNA was used instead of short hairpin RNA (shRNA) due to higher transfection efficiencies and quicker knockdown times, which are required to assess incipient neuron phenotypes. The neurons were then processed for immunofluorescence with GAP-43 and hnRNP-Q1 antibodies, and transfected cells were selected by GFP signal (Figure 1, C and D). The specificity of the hnRNP-Q1 antibody was verified by immunoblotting N2a cell lysates after overexpressing EGFP-tagged hnRNP-Q1 for ∼16 h (Supplemental Figure 1A). Because GAP-43 is enriched in axonal growth cones after polarity is established, we quantified GAP-43 protein levels in both the cell bodies and nascent axons of these incipient neurons. hnRNP-Q1 knockdown increased GAP-43 protein levels on average by 1.36-fold in cells bodies and by 1.56-fold in nascent axons (Figure 1, E and F). Plotting hnRNP-Q1 protein levels against GAP-43 protein levels for each cell supports an inverse correlation between hnRNP-Q1 and GAP-43 protein levels (Supplemental Figure 1B). hnRNP-Q1 knockdown also did not reduce the ratio of GAP-43 levels in nascent axon/cell body, suggesting that hnRNP-Q1 is not required for GAP-43 protein enrichment in the nascent axon and growth cone (Figure 1G). In fact, the nascent axon/cell body ratio was actually significantly increased upon hnRNP-Q1 knockdown (0.73–0.83, 1.14-fold) suggesting that hnRNP-Q1 negatively regulates GAP-43 levels within the axon (Figure 1G).
An inverse correlation between hnRNP-Q1 and GAP-43 protein levels would support our model that hnRNP-Q1 negatively regulates GAP-43 protein expression. Thus we investigated the expression profiles of hnRNP-Q1 and GAP-43 in cultured neurons. High-density primary cortical neurons were cultured for 0–21 d, and cell lysates were collected every third day and immunoblotted for hnRNP-Q1 and GAP-43. The expression profiles from the time course suggest that hnRNP-Q1 and GAP-43 are both developmentally regulated in primary cortical neurons and that these proteins have opposite patterns. hnRNP-Q1 protein levels decreased over time, while GAP-43 protein levels increased, suggesting that the decreasing levels of hnRNP-Q1 may contribute to the increasing levels of GAP-43 in primary cortical neurons (Supplemental Figure 1C). Additionally, GAP-43 and the mRNA-binding protein HuD, a positive regulator of GAP-43 expression, have previously been demonstrated to be enriched in Ammon’s horn as compared with the dentate gyrus of the hippocampus in vivo (Clayton et al., 1998; Namgung and Routtenberg, 2000). Therefore we assessed whether hnRNP-Q1, a proposed negative regulator of GAP-43 expression, demonstrated the opposite pattern of expression. The two regions of the hippocampus were dissected from P30 wild-type mice (Hagihara et al., 2009), and the levels of HuD, Gap-43, and hnRNP-Q1 mRNAs were quantified by qRT-PCR due to an inadequate amount of tissue for immunoblotting. As expected, HuD and Gap-43 mRNAs were enriched in Ammon’s horn (2.54-fold and 1.65-fold, respectively; Supplemental Figure 1D). However, hnRNP-Q1 mRNA was not enriched in the Ammon’s horn and is potentially more enriched in the dentate gyrus, suggesting that hnRNP-Q1 expression may contribute to GAP-43 protein expression in vivo in the hippocampus (0.72-fold; Supplemental Figure 1D).
Elevated GAP-43 expression in hnRNP-Q1–deficient cortical neurons increased neurite length and number
The role of GAP-43 in promoting axon growth has been extensively studied (Aigner et al., 1995; Donnelly et al., 2011, 2013; Leu et al., 2010). Therefore we next determined whether elevated GAP-43 protein levels due to hnRNP-Q1 knockdown affect neurite length and number. To investigate whether hnRNP-Q1 knockdown phenotypes were due to increased GAP-43 protein levels, we performed rescue experiments by knocking down GAP-43. GAP-43 knockdown efficiency was tested by transfecting N2a cells with GAP-43 or Scr siRNA and performing an immunoblot analysis of cell lysates after 72 h. GAP-43 protein levels were efficiently knocked down (91% reduction; Supplemental Figure 2A). Therefore, neurons were electroporated with hnRNP-Q1 #1 or Scr siRNA and Lifeact-GFP but also with GAP-43 or Scr siRNA to specifically link any phenotypes to increased GAP-43 protein levels. The neurons were fixed after 28.5 h in culture and processed for immunofluorescence with GAP-43 and hnRNP-Q1 antibodies, and transfected cells were selected by GFP signal (Figure 2A).
FIGURE 2:

Double knockdown of hnRNP-Q1 and GAP-43. Primary cortical neurons were transfected with hnRNP-Q1 #1 or Scr siRNA, GAP-43 or Scr siRNA and Lifeact-GFP by nucleofection and processed for immunofluorescence with GAP-43 and hnRNP-Q1 antibodies after 28.5 h. (A) Representative images with inset heat maps. Scale bar: 10 μm. (B) Plot of cell body hnRNP-Q1 protein levels against cell body GAP-43 protein levels for each cell. The threshold between low and high levels of each protein was set at 12,500 A.U. as depicted by the black lines. Red outline indicates the cell population with low levels of hnRNP-Q1 and high levels of GAP-43 that was assessed for increased neurite length and number in Figure 3 (Q1 siRNA + Scr siRNA cells only). (C) Table showing the correlation between hnRNP-Q1 and GAP-43 protein levels. The percentage of total cells in each category is listed, and the highlighted populations (corresponding to the bar graphs in Figure 3) were analyzed for neurite length and number.
We performed a single-cell analysis, which consisted of quantifying cell body hnRNP-Q1 and GAP-43 protein levels and measuring nascent axon length, total neurite length, and neurite number. Plotting hnRNP-Q1 protein levels against GAP-43 protein levels for each cell revealed three major expression patterns (Figure 2B): 1) high hnRNP-Q1 and low GAP-43 protein levels, the pattern most prevalent in control and GAP-43 knocked-down cells; 2) low hnRNP-Q1 and high GAP-43 protein levels, the pattern most prevalent in hnRNP-Q1 knocked-down cells; and 3) low hnRNP-Q1 and low GAP-43 protein levels, a common expression profile in all experimental conditions. The threshold between low and high protein levels for both hnRNP-Q1 and GAP-43 was set at 12,500 A.U. (arbitrary units) based the expression plot (Figure 2B). Analysis of the percent of cells showing each of the three expression patterns illustrates an inverse relationship between hnRNP-Q1 and GAP-43 expression (Figure 2C). In control cells, the majority (51.4%) of neurons had low hnRNP-Q1 and low GAP-43 protein levels, presumably due to multiple factors regulating each protein (Figure 2C). For example, GAP-43 protein turnover may be dynamically regulated, which is supported by the finding that GAP-43 protein is degraded by the ubiquitin–proteasome system (De Moliner et al., 2005). Therefore steady-state GAP-43 protein levels may not increase in some cells upon hnRNP-Q1 knockdown due to high levels of GAP-43 protein turnover, despite the increased Gap-43 mRNA translation rate. Additionally, cells may be lacking sufficient levels of other factors that are required to result in increased GAP-43 protein levels (e.g., HuD to stabilize Gap-43 mRNA). Nonetheless, a substantial percentage of cells (35.8%) showed high hnRNP-Q1 and low GAP-43 protein levels under control conditions, consistent with the proposed role of hnRNP-Q1 as a negative regulator of GAP-43 expression (Figure 2C). Depletion of hnRNP-Q1 revealed a marked decrease in cells showing high hnRNP-Q1 and low GAP-43 protein levels (from 35.8 to 4.1%), suggesting removal of GAP-43 repression by hnRNP-Q1 knockdown (Figure 2C). Conversely, knockdown of hnRNP-Q1 resulted in a marked increase in cells with low hnRNP-Q1 and high GAP-43 protein levels (from 4.6 to 27.6%), further suggesting that the elevation in GAP-43 protein levels was directly attributed to loss of hnRNP-Q1 (Figure 2C). The phenotype of high GAP-43 protein levels in hnRNP-Q1–depleted cells (27.6%) was abolished by simultaneous knockdown of GAP-43 (1.6%), demonstrating that GAP-43 can be efficiently depleted (Figure 2C). Additionally, knockdown of GAP-43 by itself did not change the negative correlation between hnRNP-Q1 and GAP-43 protein levels, wherein a substantial percentage of cells (32.6%) still showed high hnRNP-Q1 and low GAP-43 protein levels (Figure 2C). Furthermore, a very small percentage of cells had high hnRNP-Q1 and high GAP-43 protein levels (control: 8.1%; GAP-43: 0.6%; hnRNP-Q1: 7.6%; and hnRNP-Q1 & GAP-43: 3.3%).
To determine whether elevated GAP-43 protein levels due to hnRNP-Q1 knockdown affect neurite length and number, we specifically analyzed the cells within the population that exhibited the characteristic expression pattern for each condition (highlighted in Figure 2C; the average hnRNP-Q1 and GAP-43 protein levels of selected cells are displayed in Supplemental Figure 2B). Shortly after being plated (∼6 h), cultured neurons develop lamellipodia that transform into distinct processes after ∼12 h (Dotti et al., 1988). One of these minor processes is specified to become the axon and begins to grow at an accelerated rate as compared with the remaining processes after ∼1–2 d in culture (Dotti et al., 1988). Therefore the longest neurite after 28.5 h in culture will likely develop into the axon and was called the “nascent axon” in our studies. The total length and number of all neurites was also quantified. Cells with low levels of GAP-43 protein and high levels of hnRNP-Q1 protein were selected in the control conditions (Scr siRNA + Scr siRNA: 35.8% of cells; Scr siRNA + GAP-43 siRNA: 32.6% of cells); cells with low levels of hnRNP-Q1 protein and high levels of GAP-43 protein were selected in the Q1 siRNA + Scr siRNA condition (27.6% of cells; red outline in Figure 2B); and cells with low levels of both proteins were selected in the Q1 siRNA + GAP-43 siRNA condition (78.8% of cells). Neurons with elevated GAP-43 protein levels following hnRNP-Q1 knockdown correlated with an increased length of the nascent axon by 1.44-fold (31.00 to 44.76 μm; Figure 3, A and D), total length of all the neurites by 1.66-fold (86.11 to 143.12 μm; Figure 3, B and E), and number of neurites per cell by 1.44-fold (4.84 to 6.96 neurites, Figure 3, C and F). Additionally, simultaneously knocking down GAP-43 rescued all three phenotypes back to control levels, which demonstrates that increased GAP-43 protein levels are responsible for the neuritic and axonal phenotypes in hnRNP-Q1–deficient neurons (Figure 3, A–F). The nascent axon length, total neurite length, and neurite number of Q1 siRNA + Scr siRNA cells with low levels of hnRNP-Q1 protein and low levels of GAP-43 protein (60.6% of cells) were also quantified to confirm that GAP-43 is driving the increased neurite growth. The average nascent axon length (1.03-fold, p value = 0.9745), total neurite length (0.91-fold, p value = 0.8029), and neurite number (0.83-fold, p value = 0.3102) were not significantly altered as compared with control Scr siRNA + Scr siRNA cells (unpublished data). These results support our model that increased axon growth in hnRNP-Q1–depleted cells is attributed to elevated GAP-43 expression.
FIGURE 3:

Increased cortical neuron nascent axon length, total neurite length, and neurite number due to increased GAP-43 protein expression upon hnRNP-Q1 knockdown. (A) Average nascent axon length, (B) total neurite length, and (C) neurite number of selected neurons from Figure 2 were quantified. n = 7, Scr + Scr: 62 out of 173 cells; Scr + GAP-43: 59 out of 181 cells; Q1 + Scr: 47 out of 170 cells; and Q1 + GAP-43: 145 out of 184 cells from seven independent experiments. One-way ANOVA, Tukey’s posthoc, nascent axon length p values: Scr + Scr vs. Scr + GAP-43, p = 0.8423; Scr + Scr vs. Q1 + Scr, p = 0.0004; Scr + Scr vs. Q1 + GAP-43, p = 0.5784; Scr + GAP-43 vs. Q1 + Scr, p < 0.0001; Scr + GAP-43 vs. Q1 + GAP-43, p = 0.9921; Q1 + Scr vs. Q1 + GAP-43, p < 0.0001; total neurite length p values: Scr + Scr vs. Scr + GAP-43, p = 0.9884; Scr + Scr vs. Q1 + Scr, p < 0.0001; Scr + Scr vs. Q1 + GAP-43, p = 0.2956; Scr + GAP-43 vs. Q1 + Scr, p < 0.0001; Scr + GAP-43 vs. Q1 + GAP-43, p = 0.5334; Q1 + Scr vs. Q1 + GAP-43, p < 0.0001; neurite number p values: Scr + Scr vs. Scr + GAP-43, p = 0.9707; Scr + Scr vs. Q1 + Scr, p = 0.0021; Scr + Scr vs. Q1 + GAP-43, p = 0.4028; Scr + GAP-43 vs. Q1 + Scr, p = 0.0098; Scr + GAP-43 vs. Q1 + GAP-43, p = 0.1699; Q1 + Scr vs. Q1 + GAP-43, p < 0.0001. (D–F) Cumulative distribution plots for each measurement of selected neurons from Figure 2.
Elevated GAP-43 expression in hnRNP-Q1–deficient N2a cells increased process extension
We next determined whether hnRNP-Q1 knockdown also affects the morphology of N2a cells. N2a cells were transfected with hnRNP-Q1 #1 or Scr siRNA, GAP-43 or Scr siRNA and Lifeact-GFP and fixed after 72 h. The cells were then processed for immunofluorescence with GAP-43 and hnRNP-Q1 antibodies, and transfected cells were selected by GFP signal (Figure 4A). Cells were categorized based on their degree of process extension (Supplemental Figure 3A). hnRNP-Q1 knockdown significantly increased the proportion of cells with processes as compared with control cells (cat. 2 = 21.7%, cat. 3 = 12.3%, cat. 4 = 4.5%, and cat. 2 = 12.7%, cat. 3 = 2.6%, cat. 4 = 0.3%, respectively; Figure 4B). Additionally, simultaneously knocking down GAP-43 partially rescued this phenotype (cat. 2 = 21.1%, cat. 3 = 6.9%; and cat. 4 = 0.8%; Figure 4B), suggesting that repression of GAP-43 expression contributes to hnRNP-Q1–mediated inhibition of N2a cell process extension and, potentially, differentiation. Interestingly, the cell media needed to be changed frequently to rescue this phenotype, and N2a cells transfected with just hnRNP-Q1 #1 shRNA demonstrated enhanced process extension as compared with control cells (cat. 2 = 27.71%, cat. 3 = 35.67%, and cat. 4 = 18.79%, and Cat 2. = 28.2%, Cat 3. = 15.7%, and cat. 4 = 3.2%, respectively; Supplemental Figure 3B), suggesting that hnRNP-Q1 depletion leads to increased secretion of growth factors.
FIGURE 4:
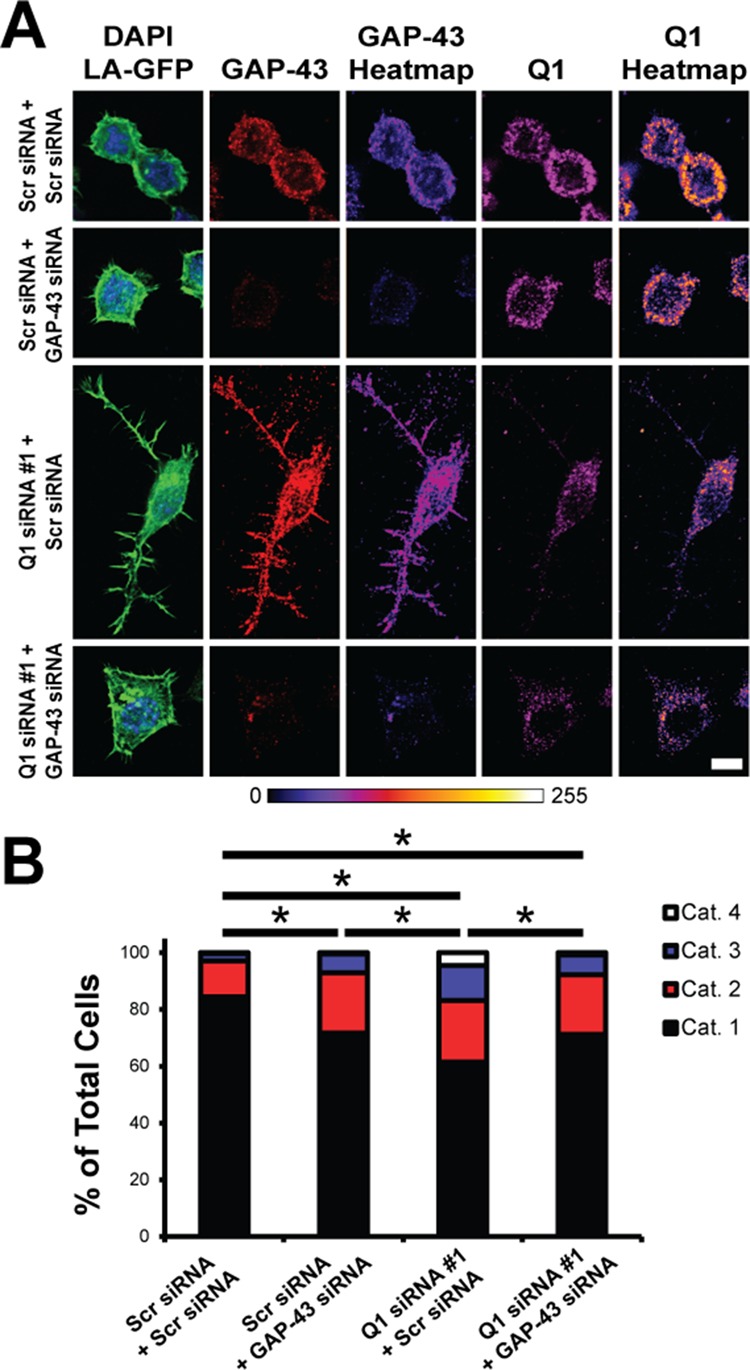
Increased N2a cell process extension due to increased GAP-43 protein expression upon hnRNP-Q1 knockdown. N2a cells were transfected with hnRNP-Q1 #1 or Scr siRNA, GAP-43 or Scr siRNA and Lifeact-GFP and processed for immunofluorescence with GAP-43 and hnRNP-Q1 antibodies after 72 h. Cells were then imaged and categorized based on their degree of process extension (see Supplemental Figure 3A). (A) Representative images with heat maps. Scale bar: 10 μm. (B) Quantification of the results. Percent of cells in each category: Scr + Scr: cat. 1 = 84.4%; cat. 2 = 12.7%; cat. 3 = 2.6%; cat. 4 = 0.3%; Scr + GAP-43: cat. 1 = 71.6%; cat. 2 = 21.3%; cat. 3 = 6.7%; cat. 4 = 0.4%; Q1 + Scr: cat. 1 = 61.5%; cat. 2 = 21.7%; cat. 3 = 12.3%; cat. 4 = 4.5%; Q1 + GAP-43: cat. 1 = 71.2%; cat. 2 = 21.1%; cat. 3 = 6.9%; cat. 4 = 0.8%. n = 4, Scr + Scr: 379 cells; Scr + GAP-43: 239 cells; Q1 + Scr: 286 cells; and Q1 + GAP-43: 261 cells from four independent experiments. Kruskal-Wallis test, Dunn’s posthoc, p values: Scr + Scr vs. Scr + GAP-43, p = 0.0029; Scr + Scr vs. Q1 + Scr, p < 0.0001; Scr + Scr vs. Q1 + GAP-43, p = 0.0013; Scr + GAP-43 vs. Q1 + Scr, p = 0.0137; Scr + GAP-43 vs. Q1 + GAP-43, p > 0.9999; Q1 + Scr vs. Q1 + GAP-43, p = 0.0156.
hnRNP-Q1 directly binds a GQ sequence in the 5′-UTR of the Gap-43 mRNA through the RGG box
To investigate a possible translational mechanism for how hnRNP-Q1 represses GAP-43 expression, we first determined whether hnRNP-Q1 interacts with endogenous Gap-43 mRNA. We overexpressed 3×Flag-mCherry-hnRNP-Q1 in N2a cells, and hnRNP-Q1 was immunoprecipitated with anti-Flag agarose beads. Copurifying mRNAs were assessed by qRT-PCR and normalized to levels of the non hnRNP-Q1 target γ-actin mRNA. Gap-43 mRNA was significantly enriched (2.89-fold) in hnRNP-Q1 pellets as compared with γ-actin mRNA but not Gapdh mRNA (1.07-fold), suggesting that hnRNP-Q1 forms a complex with Gap-43 mRNA (Figure 5A). Biotin pull-down experiments were performed to test whether hnRNP-Q1 directly interacts with Gap-43 mRNA and to identify the Gap-43 mRNA sequences that are required for hnRNP-Q1 binding. Biotinylated probes corresponding to the Gap-43 5′-UTR, coding region and 3′-UTR were in vitro transcribed along with the γ-actin 3′-UTR as a negative control (Figure 5B). Equimolar concentrations of the RNA probes were incubated with recombinant glutathione S-transferase (GST) or GST-hnRNP-Q1 protein, and the probes were precipitated with NeutrAvidin agarose beads. Copurifying protein was assessed by GST immunoblot. GST-hnRNP-Q1 but not GST was precipitated with probes corresponding to all three regions of the Gap-43 mRNA but not with the γ-actin 3′-UTR probe (Figure 5C), demonstrating that hnRNP-Q1 directly interacts with Gap-43 mRNA. Interestingly, we observed that the 5′-UTR precipitated the most GST-hnRNP-Q1, followed by the coding region, and then the 3′-UTR (Figure 5C). Thus we focused our analysis on a predicted GQ sequence in the 5′-UTR region of Gap-43 mRNA, because these structures have previously been demonstrated to repress translation (Bugaut and Balasubramanian, 2012). The predicted GQ sequence that we assessed had the highest G-Score of all predicted GQs in mouse Gap-43 mRNA (G-Score = 42, QGRS Mapper [ Kikin et al., 2006]; Supplemental Figure 4A). Human Gap-43 mRNA also has a predicted GQ with a high G-Score in the 5′-UTR, suggesting a conserved mechanism (G-Score = 36, QGRS Mapper [ Kikin et al., 2006]; Supplemental Figure 4B). We observed that deleting the Gap-43 5′-UTR GQ sequence (5′GQ, 5′-GGGAGGGAGGGAGGGA-3′) almost completely abolished GST-hnRNP-Q1 binding to the 5′-UTR (reduced by 88%; Figure 5C). Because hnRNP-Q1 appears to bind to multiple regions of the Gap-43 mRNA, we next determined whether deleting the 5′GQ affects hnRNP-Q1 binding to full-length (FL) Gap-43 mRNA. Biotinylated probes corresponding to FL Gap-43 mRNA with and without the 5′GQ were in vitro transcribed (Figure 5B) and used for biotin pull-down experiments. Deleting the 5′GQ reduced GST-hnRNP-Q1 binding to FL Gap-43 mRNA by 41%, suggesting that this sequence is a major hnRNP-Q1–binding site (Figure 5D). Additionally, GST-hnRNP-Q1 binds to the 5′GQ better than to either a 12-nucleotide or 30-nucleotide poly(A) probe (Supplemental Figure 4C). These results suggest that the 5′GQ is a major hnRNP-Q1–binding site and that the 5′GQ and not the poly(A) tail are involved in hnRNP-Q1–mediated GAP-43 regulation as predicted by the results from Svitkin et al. (2013).
FIGURE 5:
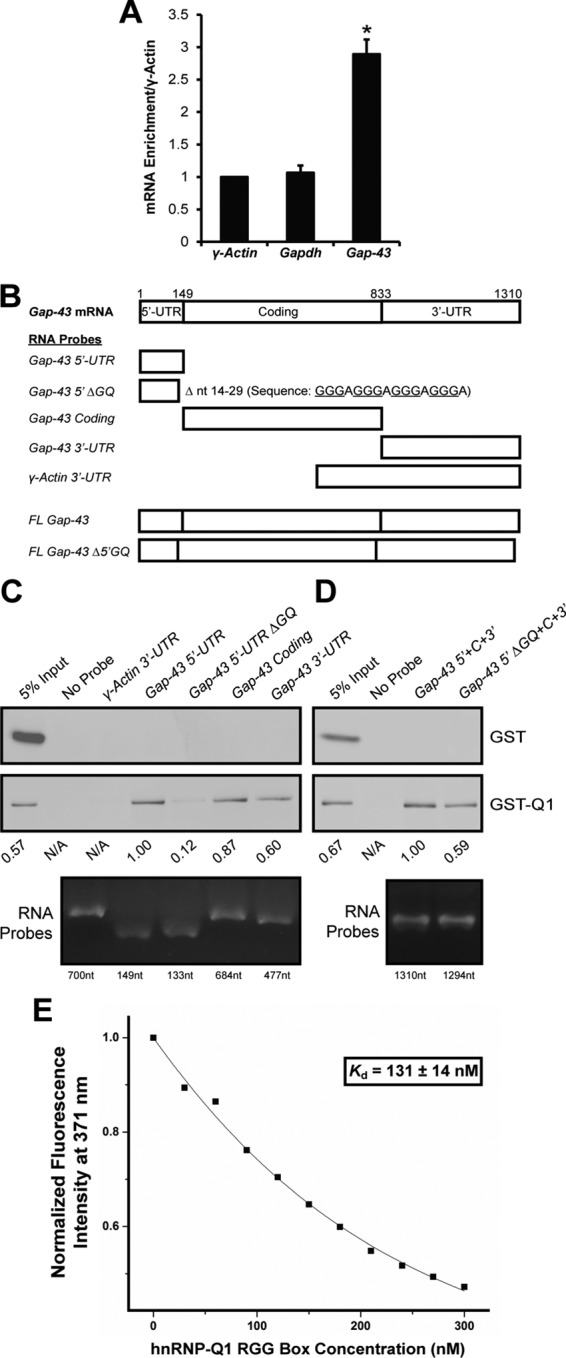
hnRNP-Q1 directly binds a Gap-43 5′-UTR GQ sequence through the RGG box. (A) Flag-tagged hnRNP-Q1 was immunoprecipitated from N2a cell lysates, and copurified endogenous mRNAs were assessed by qRT-PCR. n = 3, one-way ANOVA, Dunnett’s posthoc, p values: Gapdh, p = 0.9276; Gap-43, p = 0.0002. (B) Biotinylated RNA probes corresponding to FL Gap-43 mRNA, specific Gap-43 mRNA sequences, and/or deletions, or the γ-actin 3′-UTR were in vitro transcribed (see C and D for RNA probe purity). The (C) subregion or (D) FL RNA probes were incubated with recombinant GST or GST-hnRNP-Q1 protein and precipitated with NeutrAvidin beads. Copurified protein was assessed by GST immunoblot. Relative band intensity is listed below the immunoblots, and RNA probe integrity is shown by formaldehyde gel electrophoresis. (E) Representative fluorescence spectroscopy binding curve of the hnRNP-Q1 RGG box peptide and 2AP-labeled Gap-43 5′GQ RNA probe complex in 150 mM KCl and in the presence of a fivefold excess of the hepatitis C virus core peptide. The Kd value determined from triplicate experiments was 131 ± 14 nM.
Given that RGG box domains have been demonstrated to specifically bind GQ-forming mRNA sequences (Schaeffer et al., 2001; Menon and Mihailescu, 2007; Menon et al., 2008; Stefanovic et al., 2015b), we next determined whether hnRNP-Q1 interacts with the 5′GQ through the RGG box domain. We overexpressed 3×-Flag-mCherry, 3×Flag-mCherry/hnRNP-Q1, 3×Flag-mCherry/hnRNP-Q1 ΔRGG box and 3×Flag-mCherry/hnRNP-Q1 RGG box in N2a cells for ∼16 h. Biotin pull-down experiments were then performed with the 5′GQ probe and the N2a cell lysates. Copurifying protein was assessed by Flag immunoblot. FL hnRNP-Q1 (3×Flag-mCherry/hnRNP-Q1) and the RGG box domain (3x×Flag-mCherry/hnRNP-Q1 RGG Box) both bound the 5′GQ probe, while hnRNP-Q1 lacking the RGG box domain (3×Flag-mCherry/hnRNP-Q1 deltaRGG box) did not (Supplemental Figure 4D). These results demonstrate that the hnRNP-Q1 RGG box is necessary and sufficient to bind the Gap-43 5′GQ. We also used fluorescence spectroscopy to determine the binding affinity. We designed a fluorescently labeled Gap-43 5′GQ RNA probe in which the adenine at position four was replaced with 2-aminopurine (2AP), which is a highly fluorescent analogue of adenine whose steady-state fluorescence is sensitive to changes in the microenvironment (Serrano-Andres et al., 2006; Bharill et al., 2008). A sample of 150 nM 2AP-labeled Gap-43 5′GQ RNA probe was prepared in 10 mM cacodylic acid buffer (pH 6.5) and 50 nM increments of the hnRNP-Q1 RGG box peptide were titrated while the changes in the steady-state 2AP fluorescence were monitored (Figure 5E). The resulting binding curves were fitted with Eq. 1 (Materials and Methods) to reveal a dissociation constant (Kd) of 131 ± 14 nM for the complex formed between the Gap-43 5′GQ RNA probe and the hnRNP-Q1 RGG box (Figure 5E). These experiments were performed in triplicate, and the reported error represents the SD of the Kd from the three independent measurements.
The Gap-43 5′-UTR GQ sequence folds into a GQ structure
We next determined whether the Gap-43 5′GQ folds into a GQ structure, as predicted by the GQ prediction software QGRS Mapper (Kikin et al., 2006). The Gap-43 5′GQ probe (with a linker, 5′-GGGAGGGAGGGAGGGA+GAGC-3′) was in vitro transcribed, purified by electrophoresis, and run on a denaturing polyacrylamide gel to verify probe purity (Supplemental Figure 5A). We first analyzed 5′GQ probe folding by 20% nondenaturing polyacrylamide gel with varied KCl concentrations (0–150 mM). A single band was observed at all KCl concentrations investigated, indicating that a single GQ conformation was adopted (Supplemental Figure 5B). However, there was a small shift in the band position after KCl was added, which supports potassium-driven stability of the GQ structure (Supplemental Figure 5B).
We then used one-dimensional (1D) 1H NMR spectroscopy to analyze imino proton resonances. Imino proton resonances in the 10–12 ppm region have been assigned to guanine imino protons engaged in Hoogsteen base pairs within individual G-quartets and are considered signatures of GQ structure formation (Furtig et al., 2003; Menon et al., 2008; Nambiar et al., 2011). While DNA GQs require the presence of potassium ions for folding, RNA GQs of identical sequence can fold in the absence of these ions but have lower stability (Joachimi et al., 2009). Resonances are present in the 10–12 ppm region even in the absence of KCl, indicating GQ formation within the 5′GQ probe (Figure 6A). The intensity of these resonances increased upon the addition of KCl, demonstrating that the structure is stabilized by K+ ions (Figure 6A). A mutant Gap-43 5′GQ probe (with a linker, 5′-GCGAGCGAGCGAGCGA+GAGC-3′) was also synthesized, in which guanine nucleotides predicted to be engaged in GQ formation were replaced with cytosine nucleotides, and the secondary structure was analyzed by 1D 1H NMR spectroscopy. As expected, the GQ imino proton resonances are no longer present in the 10–12 ppm region in the absence and presence of 150 mM KCl (Supplemental Figure 5C). However, resonances are present in the 12.6–13.4 ppm region that correspond to imino protons involved in G-C Watson-Crick base pairs, consistent with the predicted hairpin structure of the Gap-43 5′GQ mutant RNA probe (Supplemental Figure 5, C and D). This result confirms that mutation of the guanine nucleotides abolishes GQ structure formation, suggesting that Gap-43 5′GQ structure formation is required for hnRNP-Q1 binding.
FIGURE 6:

The Gap-43 5′-UTR GQ sequence folds into a stable, parallel, intramolecular GQ Structure. (A) 1D 1H NMR spectroscopy with the Gap-43 5′GQ RNA probe revealed that imino proton resonances are present in the 10–12 ppm region even in the absence of KCl. (B) CD spectra of the Gap-43 5′GQ RNA probe in the presence of increasing KCl concentrations were acquired, and the results fitted the signature parallel GQ curve (negative peak at ∼240 nm and a positive peak at ∼265 nm). (C) UV spectroscopy thermal denaturation of the Gap-43 5′GQ RNA probe. Inset: fit of the main hypochromic transition present in the UV thermal denaturation profile of the Gap-43 5′GQ RNA probe with Eq. 4 (Materials and Methods) from which the following thermodynamic parameters were determined: ΔHo = −64.3 ± 0.1 kcal/mol, ΔSo = −183.2 ± 0.1 cal/mol K and ΔGo = −9.6 ± 0.1 kcal/mol. (D) Gap-43 5′GQ RNA probe melting temperature at 5 mM KCl as a function of the RNA concentration. (E) Arrangement of the predicted GQ structure within the Gap-43 5′GQ RNA probe. QGRS Mapper software was used for prediction (Kikin et al., 2006).
GQ folding within the 5′GQ RNA probe was also analyzed by acquiring CD spectra in the presence of increasing KCl concentrations (5–150 mM). Parallel GQ structures exhibit a positive band at ∼265 nm and a negative band at ∼240 nm, whereas antiparallel GQ structures exhibit a negative band at ∼260 nm and a positive band at ∼295 nm (Miyoshi et al., 2003; Paramasivan et al., 2007; Kypr et al., 2009; Vorlickova et al., 2012; Randazzo et al., 2013). The 5′GQ RNA probe exhibits the signature of a parallel GQ structure, even in the absence of K+ ions (Figure 6B). As KCl levels increased, the intensities of the bands increased, indicating that K+ ions drive GQ stability, consistent with the 1H NMR spectroscopy results (Figure 6B). However, minimal changes were observed in the spectra upon the increase in salt concentration from 5 to 150 mM, implying that the 5′GQ RNA probe requires low ionic strength to achieve a fully stable GQ structure (Figure 6B).
To obtain information about the stability of the 5′GQ structure, we performed UV spectroscopy thermal denaturation experiments. A main hypochromic transition with a melting temperature (Tm) of 78°C is present in the UV thermal denaturation profile of the 5′GQ RNA probe at 295 nm, corresponding to the GQ dissociation (Figure 6C). The beginning of a second transition is visible above 90°C at high RNA concentrations, likely due to the formation of an alternate intermolecular conformation promoted by high RNA concentrations. To determine whether the 5′GQ RNA probe adopts an intramolecular or intermolecular structure, we performed thermal denaturation experiments at a fixed KCl concentration and variable RNA probe concentration. The melting temperature does not depend on the RNA concentration (Figure 6D), indicating that the 5′GQ RNA probe adopts an intramolecular structure (Eq. 3, Materials and Methods). On establishing that the GQ conformation giving rise to the main hypochromic transition in the UV thermal denaturation curve of the 5′GQ RNA probe is intramolecular, we fitted it with Eq. 4 (Materials and Methods), which assumes a two-state model, to determine the thermodynamic parameters of GQ formation in the presence of 5 mM KCl (Figure 6C inset graph). The enthalpy of formation of a single G-quartet plane has been reported to range between −18 and −25 kcal/mol (Hardin et al., 2000). Thus the value obtained for the enthalpy of GQ formation in the 5′GQ RNA probe for the main transition (ΔH0 = −64.3 ± 0.1 kcal/mol) is consistent with the presence of three G-quartet planes. Taken together, these results suggest that the 5′GQ folds into a stable, parallel, intramolecular GQ structure containing three G-quartet planes (Figure 6E).
hnRNP-Q1 represses endogenous Gap-43 mRNA translation
For determining whether hnRNP-Q1 specifically represses endogenous Gap-43 mRNA translation, l-azidohomoalanine (AHA) pulse-labeling experiments were performed (tom Dieck et al., 2012). N2a cells were transfected with hnRNP-Q1 #1 or Scr siRNA; 72 h later, the cells were starved of methionine for 1 h and then pulsed with the methionine analogue AHA for 2 h. AHA combined with the protein synthesis inhibitor anisomycin was used as a control. Excess AHA was washed away, cell lysates were collected, and the Click-iT chemistry reaction was performed to covalently link biotin to AHA that was incorporated into newly synthesized proteins. Endogenous GAP-43 protein was then immunoprecipitated (efficiency shown in Supplemental Figure 6A), and newly synthesized GAP-43 protein was visualized by immunoblot with streptavidin and anti GAP-43 (Figure 7A). hnRNP-Q1 depletion increased AHA GAP-43 protein levels by 2.80-fold, and anisomycin treatment reduced AHA GAP-43 protein levels (Scr: 0.22-fold, Q1: 0.13-fold; Figure 7B). Total AHA-labeled protein levels also increased upon hnRNP-Q1 knockdown (1.62-fold, quantified from 1% input; Figure 7C), suggesting that hnRNP-Q1 regulates a large subset of mRNA transcripts. hnRNP-Q1 knockdown was quantified in Supplemental Figure 6B.
FIGURE 7:

hnRNP-Q1 represses endogenous Gap-43 mRNA translation. (A) N2a cells were transfected with hnRNP-Q1 #1 or Scr siRNA for 72 h, starved of methionine for 1 h, and labeled with the methionine analogue AHA or AHA + anisomycin (Anis) for 2 h. AHA incorporated into newly synthesized proteins was labeled with biotin, endogenous GAP-43 protein was immunoprecipitated, and newly synthesized GAP-43 protein was visualized by immunoblot with streptavidin and anti GAP-43. Top, the streptavidin signal; middle, total GAP-43 and AHA GAP-43/total GAP-43 merged signals; and bottom, α-tubulin signal from 5% input. *, Nonspecific bands. Quantification of (B) AHA GAP-43 protein levels normalized to total α-tubulin protein levels from 1 or 5% input and (C) total AHA protein levels from 1% input normalized to total α-tubulin protein levels from 1 or 5% input. n = 3, two-way ANOVA, Tukey’s posthoc, GAP-43 p values: Scr + AHA vs. Scr + Anis, p < 0.0001; Scr + AHA vs. Q1 + AHA, p < 0.0001; Scr + AHA vs. Q1 + Anis, p < 0.0001; Scr + Anis vs. Q1 + AHA, p < 0.0001; Scr + Anis vs. Q1 + Anis, p = 0.6392; Q1 + AHA vs. Q1 + Anis, p < 0.0001; total p values: Scr + AHA vs. Scr + Anis, p = 0.0048; Scr + AHA vs. Q1 + AHA, p = 0.0188; Scr + AHA vs. Q1 + Anis, p = 0.0111; Scr + Anis vs. Q1 + AHA, p < 0.0001; Scr + Anis vs. Q1 + Anis, p = 0.9069; Q1 + AHA vs. Q1 + Anis, p = 0.0002. (D) N2a cells were transfected with hnRNP-Q1 #1 or Scr siRNA for 72 h and incubated with or without puromycin (Puro) for 5 min. The cells were fixed, and actively translating GAP-43 and α-tubulin were detected by proximity ligation. Representative images are shown. Scale bar: 10 μm. Quantification of (E) proximity ligation puncta volume/total cell volume and (F) proximity ligation puncta signal intensity/total cell volume. n = 3, GAP-43: Scr + Puro, 126 cells; Q1 + Puro, 105 cells; Scr – Puro, 107 cells; Q1 − Puro, 109 cells; α-tubulin: Scr + Puro, 107 cells; Q1 + Puro, 109 cells; Scr − Puro, 113 cells; Q1 − Puro, 118 cells from three independent experiments, two-way ANOVA, Tukey’s posthoc, GAP-43 volume p values: Scr + Puro vs. Scr – Puro, p = 0.0419; Scr + Puro vs. Q1 + Puro, p < 0.0001; Scr + Puro vs. Q1 − Puro, p = 0.2397; Scr − Puro vs. Q1 + Puro, p < 0.0001; Scr − Puro vs. Q1 − Puro, p = 0.8760; Q1 + Puro vs. Q1 − Puro, p < 0.0001; α-tubulin volume p values: Scr + Puro vs. Scr − Puro, p < 0.0001; Scr + Puro vs. Q1 + Puro, p = 0.9408; Scr + Puro vs. Q1 − Puro, p < 0.0001; Scr − Puro vs. Q1 + Puro, p < 0.0001; Scr − Puro vs. Q1 − Puro, p = 0.9826; Q1 + Puro vs. Q1 − Puro, p < 0.0001; GAP-43 intensity p values: Scr + Puro vs. Scr − Puro, p = 0.0318; Scr + Puro vs. Q1 + Puro, p < 0.0001; Scr + Puro vs. Q1 − Puro, p = 0.2403; Scr − Puro vs. Q1 + Puro, p < 0.0001; Scr − Puro vs. Q1 − Puro, p = 0.8303; Q1 + Puro vs. Q1 − Puro, p < 0.0001; α-tubulin intensity p values: Scr + Puro vs. Scr − Puro, p < 0.0001; Scr + Puro vs. Q1 + Puro, p = 0.8904; Scr + Puro vs. Q1 − Puro, p < 0.0001; Scr − Puro vs. Q1 + Puro, p < 0.0001; Scr − Puro vs. Q1 − Puro, p = 0.9753; Q1 + Puro vs. Q1 − Puro, p < 0.0001.
Proximity ligation assays were also performed to confirm that hnRNP-Q1 represses endogenous Gap-43 mRNA translation (David et al., 2012; tom Dieck et al., 2012). N2a cells were transfected with hnRNP-Q1 #1 or Scr siRNA and Lifeact-GFP; 72 h later, the cells were pulsed with puromycin for 5 min. Media without puromycin was used as a control. Excess puromycin was extracted, the cells were fixed, and proximity ligation reactions were performed with GAP-43 and puromycin antibodies. α-Tubulin and puromycin antibodies were used as a control. The GAP-43 or α-tubulin and puromycin antibodies were bound by secondary antibodies conjugated to oligonucleotides. If a GAP-43 or α-tubulin antibody was within 30–40 nM of the puromycin antibody, which occurred when puromycin was incorporated into a GAP-43 or α-tubulin peptide chain undergoing translation, the oligonucleotides from each secondary antibody were ligated together to form a closed loop. The oligonucleotide loop was then amplified by rolling circle amplification, and fluorescently labeled oligonucleotides were hybridized to the product. Transfected cells were selected by GFP signal (Figure 7D). hnRNP-Q1 knockdown significantly increased both the volume and intensity of GAP-43 proximity ligation puncta (5.30- and 5.13-fold, respectively; Figure 7, E and F), and the no-puromycin controls demonstrated reduced signal (volume: Scr: 0.18-fold, Q1: 0.42-fold; intensity: Scr: 0.19-fold, Q1: 0.45-fold; Figure 7, E and F). However, hnRNP-Q1 knockdown did not affect the volume or intensity of α-tubulin proximity ligation puncta (0.95- and 0.93-fold, respectively; Figure 7, E and F), and the no-puromycin controls demonstrated reduced signal (volume: Scr: 0.19-fold, Q1: 0.22-fold; intensity: Scr: 0.19-fold, Q1: 0.23-fold; Figure 7, E and F). These results further suggest that hnRNP-Q1 represses Gap-43 mRNA translation but not global translation.
hnRNP-Q1 represses Gap-43 mRNA translation through the 5′-UTR GQ
AHA pulse-labeling experiments were also performed to determine whether the 5′GQ was involved in hnRNP-Q1–mediated repression of Gap-43 mRNA translation. To perform these experiments, we first created a construct with the following cassette: Gap-43 5′-UTR (with or without 5′GQ)-3×Flag-mCherry-Gap-43 coding region-Gap-43 3′-UTR (FL or Δ5′GQ reporter). N2a cells were transfected with the FL or Δ5′GQ reporter constructs ∼56 h after hnRNP-Q1 #1 or Scr siRNA transfection. After ∼16 h, the cells were starved of methionine for 1 h and labeled with the methionine analogue AHA for 2 h. AHA incorporated into newly synthesized proteins was labeled with biotin, 3×Flag-mCherry-tagged GAP-43 was immunoprecipitated with anti-Flag agarose beads, and newly synthesized 3×Flag-mCherry-tagged GAP-43 was visualized by immunoblot with streptavidin and anti-Flag (Figure 8A). The results revealed that hnRNP-Q1 depletion increased the translation of the FL reporter by 1.50-fold (Figure 8B). Additionally, the Δ5′GQ reporter was less sensitive to hnRNP-Q1 repression, but hnRNP-Q1 knockdown did significantly increase Δ5′GQ reporter translation (Scr: 2.64-fold, Q1: 3.39-fold; Figure 8B). These findings suggest that hnRNP-Q1 represses Gap-43 mRNA translation in a 5′GQ-dependent manner but indicate that additional Gap-43 mRNA sequences, potentially additional GQs, may also contribute to this process. hnRNP-Q1 knockdown was quantified in Supplemental Figure 7A, and a representative example of construct overexpression is shown in Supplemental Figure 7B. In further support of our interpretation of the AHA pulse-labeling experiments, the Δ5′GQ reporter was expressed at a higher basal rate in N2a cells than the FL reporter (1.28-fold; Figure 8C).
FIGURE 8:
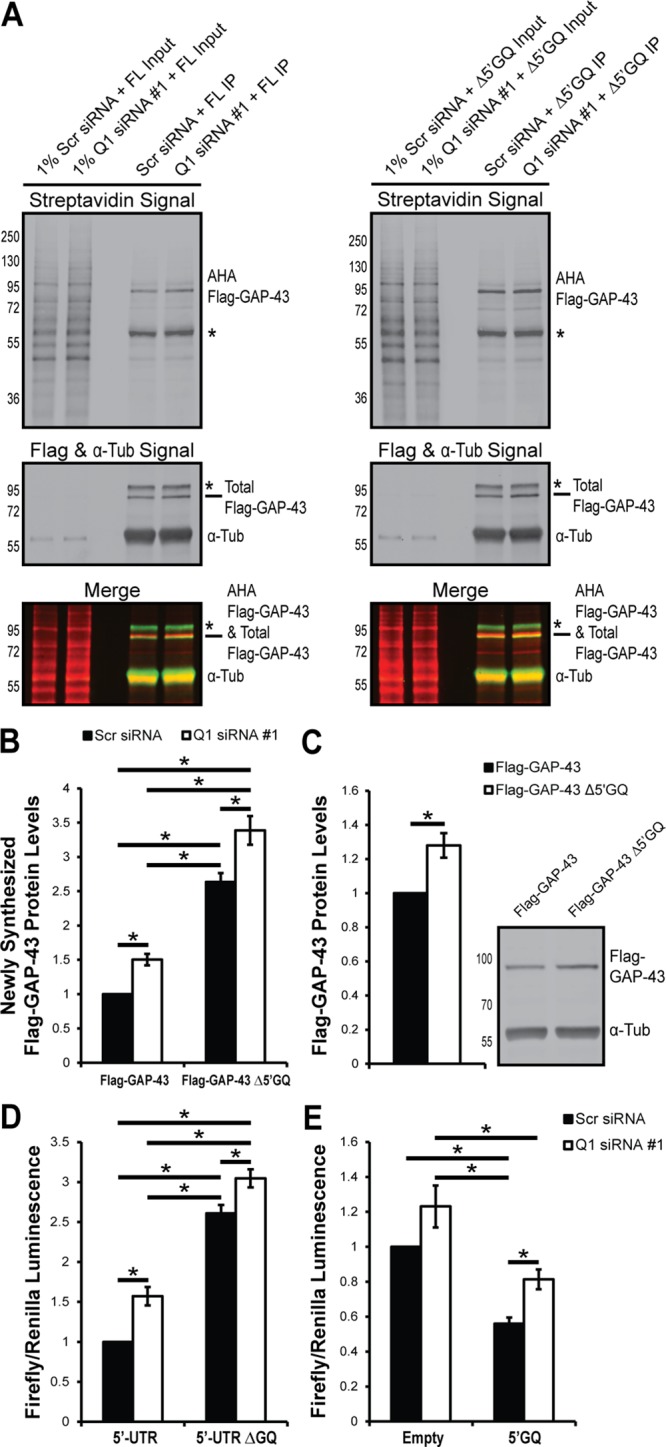
hnRNP-Q1 represses Gap-43 mRNA translation through the Gap-43 5′-UTR GQ sequence. (A) N2a cells were transfected with 3×Flag-mCherry-tagged GAP-43 reporters with (FL) and without (Δ5′GQ) the 5′GQ ∼56 h after hnRNP-Q1 #1 or Scr siRNA transfection. After ∼16 h, the cells were starved of methionine for 1 h and labeled with the methionine analogue AHA for 2 h. AHA incorporated into newly synthesized proteins was labeled with biotin; 3×Flag-mCherry-tagged GAP-43 was immunoprecipitated; and newly synthesized 3×Flag-mCherry-tagged GAP-43 (predicted to be ∼75 kDa) was visualized by immunoblot with streptavidin and anti-Flag. Top, the streptavidin signal; bottom, total Flag, α-tubulin signal and AHA Flag-GAP-43/Total Flag-GAP-43 merged signals. *, Nonspecific bands. (B) Quantification of AHA Flag-GAP-43 protein levels normalized to total α-tubulin protein levels from 1 or 5% input. n = 6, two-way ANOVA, Holm Sidak’s posthoc, p values: Scr + FL vs. Scr + ΔGQ, p < 0.0001; Scr + FL vs. Q1 + FL, p = 0.0127; Scr + FL vs. Q1 + ΔGQ, p < 0.0001; Scr + ΔGQ vs. Q1 + FL, p < 0.0001; Scr + ΔGQ vs. Q1 + ΔGQ, p = 0.0011; Q1 + FL vs. Q1 + ΔGQ, p < 0.0001. (C) The 3×Flag-mCherry–tagged GAP-43 reporter constructs were overexpressed in N2a cells for ∼16 h, and reporter expression was visualized by Flag immunoblot. n = 5, one-sample t test, p value = 0.0177. (D) N2a cells were transfected with hnRNP-Q1 #1 or Scr siRNA, the 5′ or 5′ΔGQ firefly luciferase construct, and a Renilla luciferase construct for normalization. After 72 h, the cells were trypsinized and processed for luciferase activity. n = 5, two-way ANOVA, Tukey’s posthoc, p values: Scr + 5′ vs. Scr + ΔGQ, p < 0.0001; Scr + 5′ vs. Q1 + 5′, p = 0.0035; Scr + 5′ vs. Q1 + ΔGQ, p < 0.0001; Scr + ΔGQ vs. Q1 + 5′, p < 0.0001; Scr + ΔGQ vs. Q1 + ΔGQ, p = 0.0248; Q1 + 5′ vs. Q1 + ΔGQ, p < 0.0001. (E) N2a cells were transfected with hnRNP-Q1 #1 or Scr siRNA, the 5′GQ or empty vector firefly luciferase construct, and a Renilla luciferase construct for normalization. After 72 h, the cells were trypsinized and processed for luciferase activity. n = 6, two-way ANOVA, Holm Sidak’s posthoc, p values: Scr + E vs. Scr + 5′GQ, p = 0.0010; Scr + E vs. Q1 + E, p = 0.0543; Scr + E vs. Q1 + 5′GQ, p = 0.0694; Scr + 5′GQ vs. Q1 + E, p < 0.0001; Scr + 5′GQ vs. Q1 + 5′GQ, p = 0.0492; Q1 + E vs. Q1 + 5′GQ, p = 0.0014.
Luciferase assays were also performed to support the AHA pulse-labeling findings. The Gap-43 5′-UTR with or without the 5′GQ sequence was inserted upstream of the firefly luciferase coding region (5′ or 5′ΔGQ constructs). N2a cells were transfected with hnRNP-Q1 #1 or Scr siRNA, the 5′ or 5′ΔGQ firefly luciferase reporter constructs, and a Renilla luciferase construct. Luciferase assays were performed after 72 h. The results revealed that hnRNP-Q1 depletion increased the expression of the 5′ reporter as demonstrated by a 1.57-fold increase in luminescence (Figure 8D). Additionally, the 5′ΔGQ reporter was less sensitive to hnRNP-Q1 repression, but hnRNP-Q1 knockdown did significantly increase 5′ΔGQ reporter expression (Scr: 2.61-fold, Q1: 3.05-fold; Figure 8D). These findings support the results from the AHA pulse-labeling experiments, which suggest that the 5′GQ and likely additional Gap-43 mRNA sequences contribute to translation inhibition by hnRNP-Q1. Additionally, luciferase assays were performed with a construct that had just the 5′GQ inserted upstream of the firefly luciferase coding region. N2a cells were transfected with hnRNP-Q1 #1 or Scr siRNA, the 5′GQ or empty vector firefly luciferase reporter constructs and a Renilla luciferase construct, and luciferase assays were performed after 72 h. The results demonstrate that inserting only the 5′GQ was sufficient to repress luciferase expression as compared with the empty vector (0.56-fold) and that knocking down hnRNP-Q1 relieves this repression (0.81-fold, Figure 8E). Additionally, expression of the empty vector showed a nonsignificant trend toward being slightly increased upon hnRNP-Q1 knockdown (1.23-fold; Figure 8E) suggesting that the poly(A) tail may contribute to this mechanism (Svitkin et al., 2013), but the effect of the endogenous Gap-43 poly(A) tail should be assessed before any conclusions can be made. Nonetheless, these findings demonstrate that the 5′GQ is involved in hnRNP-Q1–mediated inhibition of Gap-43 mRNA translation.
DISCUSSION
In this study, we have identified Gap-43 mRNA as a novel target that is translationally repressed by the mRNA-binding protein hnRNP-Q1. These findings contribute to the growing literature about the role of hnRNP-Q1 in regulating translation. hnRNP-Q1 has previously been demonstrated to repress cap-dependent translation of RhoA and YB-1 mRNAs (Xing et al., 2012; Lyabin et al., 2013). However, the specific mechanism of hnRNP-Q1 binding and translation regulation has yet to be uncovered. Here we further identified a predicted GQ sequence in the 5′-UTR of Gap-43 mRNA and determined that it folds into a stable, parallel, intramolecular GQ structure. Additionally, this sequence is involved in hnRNP-Q1–mediated translation repression of Gap-43 mRNA as demonstrated by AHA pulse labeling and luciferase assays. Furthermore, hnRNP-Q1 appears to bind the 5′GQ with higher affinity than poly(A) sequences, and luciferase assays reveal that the poly(A) tail represses expression to a lesser extent than the 5′GQ, suggesting a novel mechanism. In support of this, we have previously demonstrated that hnRNP-Q1 represses RhoA mRNA translation by binding non-poly(A) sequences (Xing et al., 2012). We have also demonstrated that, as in other GQ mRNA-binding proteins, the hnRNP-Q1 RGG box domain is sufficient for the recognition of the Gap-43 5′GQ. Taken together, these results suggest that hnRNP-Q1 is a novel GQ-binding protein and point to a potential mechanism for hnRNP-Q1–mediated translational regulation. GQs proximal to the 5′ cap have previously been shown to inhibit translation by blocking ribosome assembly or scanning (Bugaut and Balasubramanian, 2012). Therefore hnRNP-Q1 may bind to the 5′GQ of Gap-43 mRNA and prevent ribosome assembly or scanning. hnRNP-Q1 may repress the translation of YB-1 by a similar mechanism. YB-1 mRNA is predicted to contain a GQ with a moderately high G-Score in its 5′-UTR region (G-Score = 20, QGRS Mapper [ Kikin et al., 2006]). In contrast, RhoA mRNA translation appears to be regulated in a slightly different manner, because the 3′-UTR is sufficient for hnRNP-Q1–mediated translation repression. However, the 3′-UTR of RhoA mRNA also contains a predicted GQ with a high G-Score (G-Score = 41, QGRS Mapper [ Kikin et al., 2006]), and 3′-UTR GQs have also been demonstrated to regulate translation (Arora and Suess, 2011; Stefanovic et al., 2015a). These findings suggest that GQ structures may be the primary interacting motifs for hnRNP-Q1–mediated translational inhibition. Future studies may address this mechanism in more detail, including identifying the steps needed to repress translation. hnRNP-Q1 may modulate translation through a mechanism similar to FMRP, which interacts with mRNA target GQs when it is phosphorylated at a serine residue near the RGG box domain and is dephosphorylated in order to facilitate translation (Ceman et al., 2003; Muddashetty et al., 2011).
Our results further reveal a novel function for hnRNP-Q1 to control nascent axon and neurite growth in incipient neurons by repressing Gap-43 translation. At 28.5 h, in vitro neurons are beginning to polarize but do not demonstrate the stereotypical axonal Tau enrichment and dendritic MAP2 enrichment. These results suggest that hnRNP-Q1 plays an important role in regulating nascent axon outgrowth by modulating GAP-43 expression. Similar phenotypes have been reported upon hnRNP-Q knockdown in primary cortical neurons that have undergone Tau and MAP2 expression polarization (3 and 7 d in vitro) suggesting that hnRNP-Q1 functions to regulate neuron morphology at later stages of neuronal development as well (Chen et al., 2012). Additionally, we demonstrated that hnRNP-Q1–mediated repression of GAP-43 expression inhibits N2a cell process extension. Chen et al. (2012) also reported similar N2a phenotypes upon hnRNP-Q1 knockdown but demonstrated that their N2a and neuron phenotypes were due to reduced Cdc42 and associated-factor mRNA localization. However, GAP-43 has been demonstrated to work upstream of both Cdc42 and RhoA to regulate cell morphology, suggesting that hnRNP-Q1 may affect actin cytoskeleton dynamics through the coordinated posttranscriptional regulation of GAP-43, Cdc42, and RhoA expression (Aarts et al., 1998; Gauthier-Campbell et al., 2004). These findings suggest that hnRNP-Q1 likely regulates neuron morphology and function by modulating multiple mRNA targets. In support of this, Chen et al. (2012) performed a microarray analysis for hnRNP-Q1–interacting mRNAs and determined that hnRNP-Q1 interacts with ∼10% of the mRNAs that were interrogated (2250 mRNAs). Additionally, gene ontology analysis reveals that several of the mRNA targets encode proteins involved in neuron and synapse function, protein synthesis, and cytoskeletal regulation (Chen et al., 2012). These results suggest that hnRNP-Q1 interacts with and potentially regulates the mRNA localization and/or translation of a specific subset of mRNA targets involved in neuronal development and function. Additionally, Chen et al. (2012) identified two six-nucleotide hnRNP-Q1 consensus sequences, which expands the list of hnRNP-Q1 cis-regulatory elements. hnRNP-Q1 has previously been demonstrated to bind poly(A) RNA (Mizutani et al., 2000; Svitkin et al., 2013), and our findings demonstrate that it can bind GQ structures. More research is needed to determine whether these different cis-regulatory elements work cooperatively or allow hnRNP-Q1 to perform different functions. For example, mouse Gap-43 mRNA also contains multiple consensus sequences and two poly(A) stretches that may potentially bind hnRNP-Q1. Also, whether hnRNP-Q1 regulates different mRNA targets during specific stages of neuronal development has yet to be determined.
hnRNP-Q1 has also been identified as a component of transport mRNP granules and is localized to both the axons and growth cones of primary cortical neurons (Bannai et al., 2004; Kanai et al., 2004; Chen et al., 2012). Additionally, Gap-43 mRNA has been detected in the axons and growth cones of differentiated PC12 cells (Smith et al., 2004). These findings suggest that Gap-43 mRNA may be locally translated within axonal growth cones to synthesize new GAP-43 protein in response to axon guidance signals. In support of this, GAP-43 knockdown reduces axon length in dorsal root ganglia neurons, and this phenotype can only be rescued by GAP-43 that is locally translated in axons (Donnelly et al., 2013). Additionally, the AU-rich HuD-binding element is also necessary and sufficient to localize Gap-43 mRNA to axons, suggesting that HuD and IMP1/ZBP1 work cooperatively to stabilize and localize Gap-43 mRNA (Yoo et al., 2013). Our results identify a new factor that regulates GAP-43 expression and suggest that HuD, IMP1/ZBP1, and hnRNP-Q1 may form a complex with Gap-43 mRNA, enabling the precise control of GAP-43 expression. GAP-43 is also required for netrin-1–induced outgrowth and guidance of neocortical callosal axons (Shen and Meiri, 2013), suggesting that netrin-1 modulates GAP-43 function and may increase GAP-43 expression. Interestingly, netrin-1 induces local translation of β-actin mRNA in an IMP1/ZBP1-dependent manner (Welshhans and Bassell, 2011), implying that netrin-1 may also play a role in regulating the Gap-43 mRNA, HuD, IMP1/ZBP1, and hnRNP-Q1 complex. Future studies may address the interplay between HuD, IMP1/ZBP1, and hnRNP-Q1; determine whether these factors regulate GAP-43 expression locally in axonal growth cones; and investigate the role of netrin-1 on this complex. Our results reveal a novel mechanism for regulating GAP-43 expression and further support the idea that a complex of proteins functions to spatially and temporally regulate GAP-43 expression, enabling the growth cone to respond to specific cues during development.
MATERIALS AND METHODS
Plasmids and siRNA
Three siRNAs targeting the 3′-UTR of mouse hnRNP-Q1 mRNA, one targeting the 3′-UTR of mouse Gap-43 mRNA, and two Scr sequences were purchased from Eurofins (Huntsville, AL) and annealed according to the manufacturer’s directions. Sequences for each siRNA are as follows (including 3′ UU overhangs), hnRNP-Q1 #1 (sense: 5′-GCAGUUUCAGGUGUAAUCAUU-3′, antisense: 5′- UGAUUACACCUGAAACUGCUU-3′), hnRNP-Q1 #2 (sense: 5′- AGCUGGUUAGUCAGGCAUUUU-3′, antisense: 5′-AAUGCCUGACUAACCAGCUUU-3′), hnRNP-Q1 #3 (sense: 5′-GUGUAAGUUUGAGGGCUACUU-3′, antisense: 5′-GUAGCCCUCAAACUUACACUU-3′), hnRNP-Q1 Scr (sense: 5′-GGCUUGUAGAGCGUAGAGUUU-3′, antisense: 5′- ACUCUACGCUCUACAAGCCUU-3′), Gap-43 (sense: 5′-GCAGUCAUCUUGGGAAAUUUU-3′, antisense: 5′-AAUUUCCCAAGAUGACUGCUU-3′), and Gap-43 Scr (sense: 5′-GUUAGUCCGAAUUAGUCGAUU-3′, antisense: 5′-UCGACUAAUUCGGACUAACUU-3′). shRNA constructs were also generated by inserting the hnRNP-Q1 #1 or Scr siRNA sequences into the pLentilox3.7 vector under the synapsin promoter and yielded a similar degree of knockdown. The 3×Flag-mCherry-hu hnRNP-Q1 construct was described previously (Xing et al., 2012).
Cell culture and transfection
N2a cells (American Type Culture Collection, Manassas, VA) were grown in DMEM (Sigma-Aldrich, St. Louis, MO) with 10% fetal bovine serum (FBS; Sigma-Aldrich, St. Louis, MO), 10 mM HEPES (Fisher Scientific, Pittsburgh, PA), 100 U/ml penicillin, and 100 mg/ml streptomycin (Fisher Scientific) at 5% CO2 and 37°C. N2a cells for immunofluorescence experiments were plated on coverslips coated with 1 mg/ml poly-l-lysine (Sigma Aldrich) in borate buffer (40 mM boric acid, 10 mM sodium tetraborate, pH 8.5) for 2 h; this was followed by vigorous washing with sterile H2O. N2a cells were transfected with Lipofectamine 2000 (Life Technologies, Carlsbad, CA) according to the manufacturer’s protocol. A sample of 100 pmol of siRNA was transfected into cells plated in a 6-well dish and lysed 72 h later for immunoblotting. A sample of 40 pmol of each siRNA and 500 ng Lifeact-GFP or 800 ng shRNA were transfected into cells plated on coverslips in a 12-well dish and fixed 72 h later for immunofluorescence. The medium was changed twice per day for rescue experiments to remove any secreted growth factors.
Timed pregnant C57BL/6J mice were delivered from Charles River, and primary cortical neurons were cultured from the embryos at E16.5. Cortices were dissected from the embryos, trypsinized (0.25%, EDTA-free; Life Technologies) at 37°C, rinsed with warm Hank’s balanced salt solution (HBSS) containing 10 mM HEPES (HBSS/HEPES; Fisher Scientific), and dissociated in MEM (Cellgro/Corning, Manassas, VA) containing FBS (MEM/FBS; Sigma-Aldrich). Primary cortical neurons were transfected with the Amaxa nucleofector II device (Lonza, Allendale, NJ) and the mouse neuron nucleofector kit (Lonza) according to the manufacturer’s protocol. The neurons were washed with warm HBSS/HEPES immediately following the dissection. A sample of 150 pmol of each siRNA and 2.5 μg Lifeact-GFP were transfected into 5 million cells; this was followed by recovery in RPMI (Life Technologies) containing 10% horse serum (Life Technologies) at 37°C. Cells were plated in MEM/FBS on coverslips previously coated with 1 mg/ml poly-l-lysine (Sigma-Aldrich) in borate buffer for 72 h; this was followed by three 1-h washes with sterile H2O. Two hours after plating, the neurons were cocultured with glia in Neurobasal medium (Life Technologies) with 1× Glutamax (Life Technologies) and 1× B-27 (Life Technologies) at 5% CO2 and 37°C and fixed 28.5 h later for immunofluorescence.
Antibodies, immunoblotting, and immunofluorescence
The following antibodies were used for immunoblotting: hnRNP-Q/R (1:1000; Sigma-Aldrich), GAP-43 (1:5000; Abcam, Cambridge, MA), γ-actin (1:10,000; Santa Cruz, Dallas, TX), α-tubulin (1:50,000; Sigma-Aldrich), IRDye 680LT donkey anti-mouse (1:20,000; Li-Cor, Lincoln, NE), IRDye 800CW donkey anti-mouse (1:20,000; Li-Cor), and IRDye 800CW donkey anti-rabbit (1:20,000, Li-Cor). Immunoblotting was performed following a standard protocol. Lysates were collected in RIPA buffer (150 mM NaCl, 50 mM Tris-HCl, pH 8.0, 1% NP-40, 0.5% deoxycholate and 0.1% SDS) supplemented with 1× protease inhibitor (Roche, Indianapolis, IN) and 1× RNase inhibitor (Ambion/Life Technologies) unless otherwise noted, Bradford assays were performed, and equal amounts of protein were run on SDS–PAGE gels. Nitrocellulose membranes were blocked with 5% fraction V bovine serum albumin (BSA; Roche) in 1× phosphate-buffered saline (PBS), and primary and secondary antibody incubations were performed in 5% BSA in 1× PBS with 0.1% Tween 20 at room temperature for 2 and 1 h, respectively. An Odyssey infrared imager and software was used to scan the membranes, and band intensity was quantified using ImageJ. Protein levels were normalized to the loading control α-tubulin.
The following antibodies were used for immunofluorescence: GAP-43 (1:5000; EMD Millipore, Billerica, MA), rhodamine phalloidin (1:1000; Life Technologies), goat anti-mouse Cy3 (1:500; Jackson Immuno Research Laboratories, West Grove, PA), and donkey anti-rabbit Cy5 (1:500, Jackson Immuno Research Laboratories). Additionally, an hnRNP-Q1–specific antibody was produced by immunizing rabbits with a KLH-conjugated peptide corresponding to the C-terminal region of hnRNP-Q1 (KGVEAGPDLLQ, through Anaspec, Freemont, CA). The antibody was affinity purified by the company and delivered at a concentration of 0.076 mg/ml. The hnRNP-Q1 antibody was tested by immunoblotting at 1:300, similar to Xing et al. (2012) and used for immunofluorescence at 1:100. Immunofluorescence was performed following a standard protocol. Cells were fixed with 4% paraformaldehyde (Sigma-Aldrich) in 1× PBS for 10 min, washed with 1× PBS, permeabilized with 0.2% Triton X-100 in 1× PBS, and washed with Tris-glycine buffer (200 mM Tris-HCl, pH 7.5, 100 mM glycine). Cells were blocked for 1 h, incubated with primary antibody for 1 h, and incubated with secondary antibody for 30 min in 5% BSA in 1× PBS with 0.1% Tween 20 at room temperature. Coverslips were mounted with ProLong Gold Antifade reagent with 4′,6-diamidino-2-phenylindole (Life Technologies).
Fluorescence microscopy
Cells were visualized with a 60× Plan-Neofluar objective (Nikon, Melville, NY) on a Nikon Eclipse inverted microscope. Images were acquired with a cooled CCD camera (Photometrics, Tucson, AZ) and Nikon Elements software. Exposure times were kept constant and below saturation for quantitative analysis. Images were deconvolved using AutoQuant X (Media Cybernetics, Bethesda, MD). GAP-43 and hnRNP-Q1 signal intensities in the cell body and longest neurite of cortical neurons were quantified by thresholding the volume of either cell area with the GFP signal and calculating the mean gray area with ImageJ. The mean gray areas of three in-focus stacks were averaged. Neurites were traced, and neurite number and length were quantified using the NeuronJ plug-in for ImageJ. Neurites were defined as any protrusion longer than 6.4 μm, and the longest neurite was called the nascent axon. Immunofluorescence images were prepared by creating easy three-dimensional images with constant lookup table values across all conditions in Imaris (Bitplane, Concord, MA). Heat maps were prepared in ImageJ by setting the lookup table of 8-bit images to fire.
qRT-PCR experiments
RNA was extracted from hnRNP-Q1 #1– or Scr siRNA–transfected lysates with TRIzol (Ambion/Life Technologies), and total mRNAs were reverse transcribed into cDNA with superscriptIII reverse transcriptase (Life Technologies) and oligo(dT) primers (Life Technologies) according to the manufacturer’s instructions. Real-time PCR was performed with a LightCycler real-time PCR system and LightCycler SYBR Green I reagent (Roche). Primer sequences were as follows: Gap-43, 5′-ACAAGATGGTGTCAAGCC-3′ and 5′-CATCGGTAGTAGCAGAGC-3′; and γ-actin, 5′-CTGGTGGATCTCTGTGAGCAC-3′ and 5′-AAACGTTCCCAACTCAAGGC-3′.
The dentate gyrus and the remaining region (Ammon’s horn) of the hippocampus were dissected from P30 C57BL/6J mice following a standard protocol (Hagihara et al., 2009). Total RNA from each region was extracted with Trizol (Ambion/Life Technologies) and reverse transcribed using random primers (Promega, Madison, WI) and the Quantitect Reverse Transcription Kit with DNase treatment (Qiagen, Valencia, CA). Real-time PCR was performed using Quanta SYBR Green FastMix for iQ kit (Quanta Biosciences, Gaithersburg, MD) in an iQ5 Multicolor Real-Time PCR detection System (Bio-Rad, Hercules, CA). Primer sequences were as follows: HuD, 5′-GCAGAGAAAGCCATCAACACTTTA-3′ and 5′-GCTTCTTCTGCCTCAATCCTCT-3′; Gap-43, 5′-AGATGGCTCTGCTACTACCGA-3′ and 5′-CCTTGGAGGACGGGGAGTT-3′; hnRNP-Q1, 5′-GTAGAGCCGGTTATTCACAGAG-3′ and 5′-TCATTGTAACAGGTCAGGACCG-3′; and β-actin, 5′-TGTTACCAACTGGGACGACA-3′ and 5′-GGGGTGTTGAAGGTCTCAAA-3′. Relative quantification of each mRNA was determined based on the standard curve generated with the corresponding primers, and all relative concentrations were normalized to β-actin mRNA levels as an internal control.
The 3×Flag-mCherry or 3×Flag-mCherry-hu hnRNP-Q1 (Xing et al., 2012) constructs were overexpressed in N2a cells for ∼16 h, and Flag-tagged proteins were immunoprecipitated with anti-Flag agarose beads (Sigma-Aldrich). After extensive washing, the pellets were split: one-third for immunoblotting and two-thirds for qRT-PCR. Immunoblots were performed with anti-Flag antibody (1:5000; Sigma-Aldrich) to verify overexpression and immunoprecipitation. Copurifying mRNAs were assessed by qRT-PCR, which was performed as above but also included Gapdh primers (5′-GAGTCTACTGGTGTCTTCAC-3′ and 5′-CCACAATGCCAAAGTTGTCAT-3′). mRNA levels with 3×Flag-mCherry immunoprecipitation were inadequate to quantify. mRNA levels with 3×Flag-mCherry-hu hnRNP-Q1 immunoprecipitation were first normalized to the input and then to γ-actin mRNA levels.
Biotin pull-down assays
Gap-43 and γ-actin sequences were amplified from mouse brain cDNA; and the Gap-43 5′-UTR, coding region, and 3′-UTR were pieced together by overlap extension PCR. The Gap43 5′-UTR GQ (5′GQ) sequence was deleted by ordering a forward primer lacking the sequence. All sequences of interest were subcloned into pGEM T-easy (Promega). The constructs were linearized and used as a template for in vitro transcription with T7 or Sp6 Maxiscript kits (Ambion/Life Technologies). Biotin-11-cytidine-5′-triphosphate (Roche) was used in a ratio of 1:4 with unlabeled CTP to produce biotinylated sense RNA probes. Unincorporated nucleotides were removed with G-25 spin columns (GE Healthcare Bio-Sciences, Piscataway, NJ), and the RNA probes were concentrated by ethanol precipitation and resuspended in 10 mM cacodylic acid (pH 6.5). RNA probe concentration was analyzed by A260 absorption, and probe quality was assessed by formaldehyde gel electrophoresis. In vitro–transcribed probes or commercially synthesized RNA oligos with a 5′-end biotin label were annealed by being boiled for 5 min and incubated at room temperature for 15 min and then used for biotin pull-down assays. Recombinant GST or GST-hnRNP-Q1 (∼10 ng, as described in Xing et al., 2012) was incubated with equimolar concentrations of RNA probes in the presence of 100 ng/μl yeast tRNA for 20 min at room temperature. NeutrAvidin agarose (Thermo Fisher Scientific, Waltham, MA) preblocked with 20 μg DNase-, RNase-free BSA (Roche) was used to precipitate the biotinylated RNA probes, and copurifying protein was assessed by immunoblotting for GST (1:1000; Covance, Princeton, NJ).
The 3×Flag-mCherry/hu hnRNP-Q1 ΔRGG box and 3×Flag-mCherry/hu hnRNP-Q1 RGG box constructs were generated by amplifying regions of hnRNP-Q1 from 3×Flag-mCherry/hu hnRNP-Q1 construct and inserting them into the 3×Flag-mCherry vector. Sequences for the amplification primers are as follows: ΔRGG box, 5′-CCGGCTCGAGCTATGGCTACA GAACATGTTAATGG-3′ and 5′-CCGGGGTACCTGGAGGGGGCATATGAGG-3′; and RGG box, 5′-CCGGCTCGAGCTACAAGAGGTCGAGGGCG-3′ and 5′-CCGGGGTAC CTCATTGTAACAGGTCAGGACCG-3′. N2a cells were transfected with 2 μg of each 3×Flag-mCherry construct, and the cell lysates were used for biotin pull-down assays as described above after ∼16 h. Copurifying protein was assessed by immunoblotting for Flag (1:5000; Sigma-Aldrich).
Fluorescence spectroscopy experiments
Steady-state fluorescence spectroscopy experiments with the 2AP Gap-43 5′GQ RNA probe (5′-GGG2APGGGAGGGAGGGA+GAGC-3′) were performed on a Horiba Scientific Fluoromax-4 and accompanying software fitted with a 150-W ozone-free xenon arc lamp. Experiments were performed in a 150 μl sample volume, 3-mm path-length quartz cuvette (Starna Cells, Atascadero, CA). The excitation wavelength was set to 310 nm, the emission spectrum was recorded in the range of 330–450 nm, and the band-pass filters for excitation and emission monochromators were both set to 5 nm. Recombinant hnRNP-Q1 RGG box peptide was synthesized by inserting residues 406–561 into pGEX-2T (GE Healthcare Biosciences), inducing protein synthesis in Rosetta2(DE3)pLysS bacteria (Novagen, Madison, WI), purifying the protein by glutathione affinity, and cleaving off the GST tag with PreScission Protease (GE Healthcare Biosciences). hnRNP-Q1 RGG box peptide was titrated (50 nM) into a fixed concentration of 2AP Gap-43 5′GQ RNA (150 nM), and quenching of the fluorescence signal was recorded as a result of the RGG peptide interacting with the RNA probe (each point was corrected for fluorescence contributions originating from the peptide). A concentration of 1 μM of a synthetic peptide derived from the hepatitis C virus core protein was added to the RNA sample before hnRNP-Q1 RGG box peptide titration to prevent nonspecific binding. The binding dissociation constant (Kd) was determined by fitting the binding curves to the equation
 (1) (1)
|
where IB/IF represents the ratio of the steady-state fluorescence intensity of the bound and free mRNA, [RNA]t is the total concentration of mRNA, and [P]t is the total peptide concentration.
GQ folding assays
The Gap-43 5′GQ RNA probe (5′-GGGAGGGAGGGAGGGA+GAGC-3′) and the mutated Gap-43 5′GQ RNA probe (5′-GCGAGCGAGCGAGCGA+GAGC-3′) were in vitro transcribed by T7 RNA polymerase–driven transcription of synthetic DNA templates (TriLink BioTechnologies, San Diego, CA). The RNA probes were purified by 20% polyacrylamide, 8 M urea gel electrophoresis and electroelution. Subsequently, the probes were dialyzed against 10 mM cacodylic acid (pH 6.5). The Gap-43 5′GQ RNA probe and its mutated version were run on a denaturing polyacrylamide gel with a previously purified Psd-95 RNA probe (15 nucleotides) to evaluate the purity.
KCl was added to 15 μM of the Gap-43 5′GQ RNA probe in the range 0–150 mM. The samples were annealed by being boiled for 5 min; this was followed by incubation at room temperature for 10 min. Twenty percent native gels in 0.5× Tris/borate/EDTA buffer were ran at 100 V for 3 h at 4°C. Probe conformations were visualized by UV shadowing at 254 nm using an AlphaImager (Alpha Innotech, San Leandro, CA).
GQ formation in the Gap-43 5′GQ RNA probe was monitored by 1D 1H NMR spectroscopy at 25°C on a 500-MHz Bruker AVANCE spectrometer. The 350 μM RNA samples were prepared in 10 mM cacodylic acid buffer (pH 6.5) in a 90% H2O/10% D2O ratio, and KCl was titrated in the range 0–150 mM. The water suppression was accomplished using the Watergate pulse sequence (Piotto et al., 1992). Similar experiments were performed for the mutated Gap-43 5′GQ RNA probe in the presence and absence of 150 mM KCl to demonstrate that the structure no longer formed when guanine nucleotides predicted to be engaged in GQ formation were mutated.
CD spectra were acquired on a Jasco J-810 spectropolarimeter at 25°C, using a 1-mm path-length quartz cuvette (Starna Cells). A sample of 10 μM Gap-43 5′GQ RNA probe in 10 mM cacodylic acid buffer (pH 6.5) was prepared in a volume of 200 μl. GQ formation was monitored between 200 and 350 nm by titrating KCl in the range 5–150 mM and averaging a series of seven scans with a 1-s response time and a 2-nm bandwidth. The spectra were corrected by subtracting the contributions of the cacodylic acid buffer.
UV spectroscopy thermal denaturation experiments were performed on a Cary 3E UV-VIS Spectrophotometer (Varian, Palo Alto, CA) equipped with a peltier cell. Samples of 200 μl containing variable Gap-43 5′GQ RNA probe concentrations in 10 mM cacodylic acid buffer (pH 6.5) and in the presence of 5 mM KCl were annealed as described above and thermally denatured by varying the temperature in the range 20–95°C, at a rate of 0.2°C/min and monitoring the absorbance changes at 295 nm, wavelength sensitive to GQ denaturation (Mergny et al., 1998). A layer of mineral oil was added to the cuvettes to prevent sample evaporation.
To study whether an intermolecular or intramolecular GQ is formed within Gap-43 5′GQ RNA probe, we performed UV spectroscopy thermal denaturation experiments at variable RNA concentrations ranging from 5 to 50 μM and a fixed KCl concentration of 5 mM in 10 mM cacodylic acid buffer (pH 6.5). In case of GQ structure formation between n number of RNA strands, the melting temperature (Tm) depends on the total RNA concentration (Eq. 2), whereas the melting temperature of an intramolecular GQ structure (n = 1) is independent of the RNA concentration (Eq. 3; Hardin et al., 2000):
 (2) (2)
|
 (3) (3)
|
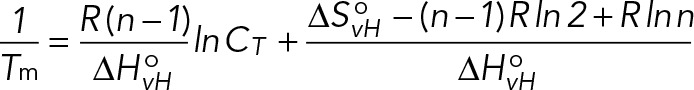
where R is the gas constant and ΔHovH and ΔSovH are the Van’t Hoff thermodynamic parameters. The thermodynamic parameters of the GQ structure were obtained by fitting the UV thermal denaturation curve to Eq. 4, which assumes a two-state model:
 (4) (4)
|
where AU and AF represent the absorbance of the unfolded and native GQ RNA structure, respectively, and R is the universal gas constant.
AHA pulse labeling
Cells were transfected with 40 pmol hnRNP-Q1 #1 or Scr siRNA 72 h before being labeled. The cells were washed with room temperature 1× PBS and incubated with DMEM without methionine (DMEM-Met; Life Technologies) for 1 h at 37°C; this was followed by incubation with 100 μg AHA (Life Technologies) or 100 μg AHA + 40 μM anisomycin (Sigma-Aldrich) in DMEM-Met for 2 h at 37°C. The cells were then washed with cold 1× PBS and lysed in 200 μl of Click-iT lysis buffer (50 mM Tris-HCl, pH 8.0, 0.1% SDS) with 1× protease inhibitor on ice. The lysates were sonicated, and 30 μg protein from each condition was used in the Click-iT reaction. The Click-iT protein reaction buffer kit (Life Technologies) and 40 μM biotin alkyne (Life Technologies) were used according to the manufacturer’s instructions for the Click-iT reaction. After the Click-iT reaction, 180 μl of each condition was diluted with 820 μl RIPA buffer with 1× protease inhibitor (IP buffer) to stop the Click-iT reaction. GAP-43 antibody (1:50; Abcam) was added to each sample, and the tubes were rotated at 4°C for 2 h. Protein G agarose beads (Roche) were resuspended in IP buffer and added to each tube, and tubes were rotated at 4°C for 1 h. After washing, the pellet, a 1% input sample, and a 5% input sample were prepared for immunoblotting for each condition. Newly translated proteins and total GAP-43 protein were detected with IRDye 680LT streptavidin (1:1000; Li-Cor), anti-GAP-43 (1:5000; Abcam), and IRDye 800CW donkey anti-mouse (1:20,000; Li-Cor). α-Tubulin (1:5000; Sigma-Aldrich) was also detected as a loading control.
FL mouse Gap-43 cDNA with and without the 5′GQ sequence was subcloned into 3×Flag-mCherry in the following order: Gap-43 5′-UTR–3×Flag-mCherry–Gap-43 coding region–Gap-43 3′-UTR. AHA-labeling experiments were performed as above except for the following. Samples of 2 μg of the 3×Flag-mCherry-GAP-43 constructs were transfected ∼56 h after siRNA transfection and ∼16 h before AHA labeling, and 100 μg protein from each condition was used in the Click-iT reaction. Anti-Flag agarose beads (Sigma-Aldrich) were resuspended in IP buffer and added to each condition, and the tubes were rotated at 4°C for 2 h. Newly translated proteins and total 3×Flag-mCherry-GAP-43 protein were detected with IRDye 680LT streptavidin (1:1000; Li-Cor), anti-Flag (1:5000; Sigma-Aldrich), and IRDye 800CW donkey anti-mouse (1:20,000; Li-Cor). α-Tubulin (1:5000; Sigma-Aldrich) was also detected as a loading control. N2a cells were transfected with 500 ng of the 3×Flag-mCherry-GAP-43 constructs for ∼16 h to determine whether deleting the 5′GQ sequence causes GAP-43 to have increased expression as detected by immunoblot with anti-Flag (1:5000; Sigma-Aldrich).
Proximity ligation
Cells were transfected with 40 pmol hnRNP-Q1 #1 or Scr siRNA 72 h before labeling. The cells were washed with warm DMEM and incubated with DMEM with or without 91 μM puromycin (Sigma-Aldrich) for 5 min at 37°C. Excess puromycin was removed by incubating with cold extraction buffer (50 mM Tris-HCl, pH 7.5, 5 mM MgCl2, 25 mM KCl, 0.015% digitonin) for 2 min followed by wash buffer (50 mM Tris-HCl, pH 7.5, 5 mM MgCl2, 25 mM KCl) for 2 min. Cells were fixed with 4% paraformaldehyde (Sigma-Aldrich) in 1× PBS for 10 min, washed with 1× PBS, permeabilized with 0.2% Triton X-100 in 1× PBS, and washed with Tris-glycine buffer. Cells were blocked in 5% BSA for 1 h at room temperature and incubated with primary antibodies in 5% BSA for 1 h at room temperature (1:1000 GAP-43 [Abcam] + 1:200 puromycin [Developmental Studies Hybridoma Bank, Iowa City, IA] or 1:6000 α-tubulin [Abcam] + 1:300 puromycin [Developmental Studies Hybridoma Bank]). Cells were then washed with 1× PBS, and Duolink proximity ligations were performed according to the manufacturer’s protocol (Sigma-Aldrich). Images were analyzed with Imaris (Bitplane). Cell volume was measured by creating a contour surface, and puncta were selected, and their volume and intensity were measured by setting a threshold.
Luciferase assays
The mouse Gap-43 5′-UTR with and without the 5′GQ sequence or the just 5′GQ sequence (by annealing primers, forward: 5′-AGCTTTCAATCTTGGGAGGGAGGGAGGGATCAATCTTC-3′ and reverse: 5′-CATGGAAGATTGATCCCTCCCTCCCTCCCAAGATTGAA-3′) were subcloned into pGL3 (Promega) upstream of the firefly luciferase coding region with the HindIII and NcoI sites. Cells were transfected with 40 pmol hnRNP-Q1 #1 or Scr siRNA, 500 ng firefly luciferase construct, and 25 ng Renilla luciferase construct (pRL-CMV; Promega). After 72 h, cells were trypsinized and resuspended in fresh DMEM. A measure of 50 μl of cell lysate in triplicate was processed for luciferase activity with the Dual-Glo luciferase assay system (Promega) according to the manufacturer’s protocol and a Veritas microplate luminometer (Turner BioSystems/Promega). Renilla luminescence was used as an internal control.
Normalization and statistics
hnRNP-Q1 and GAP-43 knockdown immunoblot data were normalized to the internal control α-tubulin and graphed relative to the control condition. hnRNP-Q1 knockdown qRT-PCR data were run in duplicate, and average values were graphed relative to the control condition. Hippocampal qRT-PCR data were normalized to the internal control β-actin and graphed relative to the control conditions. hnRNP-Q1 knockdown immunofluorescence and neurite length and number data were normalized to the average control value. The 3×Flag-mCherry-hu hnRNP-Q1 immunoprecipitation qRT-PCR data were first normalized to the input and graphed relative to γ-actin mRNA levels. AHA pulse-labeling data were normalized to the internal control α-tubulin and graphed relative to the control condition. Proximity ligation data were normalized to the average control value. Firefly luminescence values were normalized to the internal control Renilla luminescence and graphed relative to the control condition. Bar graphs represent the mean ± the SEM. Statistical test and p values for each experiment are given in the figure legends.
Supplementary Material
Acknowledgments
We thank Wilfried Rossoll for sharing the 3×Flag-mCherry construct, Roland Wedlich-Soldner for sharing the Lifeact-GFP construct, and Morgan Sheng for sharing the pLentilox3.7/synapsin promoter construct. We also thank Paul Donlin-Asp, Christina Gross, and Sharon Swanger for advice and helpful scientific discussions and Tawana Randall for administrative support. This project was supported by a Muscular Dystrophy Association Grant (G.J.B.) and National Institutes of Health training grants (T32GM008367-21, 5T32GM008367-22) and an Individual Predoctoral Ruth L. Kirschstein National Research Service Award 1F31MH095266-01A1 (K.R.W.).
Glossary
Abbreviations used:
- 1D
one-dimensional
- 2AP
2-aminopurine
- 5′GQ
GAP-43 5′-UTR G-quadruplex sequence
- AHA
l-azidohomoalanine
- ANOVA
analysis of variance
- BSA
bovine serum albumin
- FBS
fetal bovine serum
- FL
full-length
- GAP-43
growth-associated protein 43
- GFP
green fluorescent protein
- GQ
G-quadruplex
- HBSS
Hank’s balanced salt solution
- hnRNP-Q1
heterogeneous ribonucleoprotein Q, isoform 1
- N2a
Neuro2a
- PBS
phosphate-buffered saline
- qRT-PCR
quantitative real time-PCR
- RGG box
arginine- and glycine-rich region
- Scr
Scrambled
- shRNA
short hairpin RNA
- siRNA
small interfering RNA
- UTR
untranslated region.
Footnotes
This article was published online ahead of print in MBoC in Press (http://www.molbiolcell.org/cgi/doi/10.1091/mbc.E15-07-0504) December 10, 2015.
REFERENCES
- Aarts LH, Schrama LH, Hage WJ, Bos JL, Gispen WH, Schotman P. B-50/GAP-43-induced formation of filopodia depends on Rho-GTPase. Mol Biol Cell. 1998;9:1279–1292. doi: 10.1091/mbc.9.6.1279. [DOI] [PMC free article] [PubMed] [Google Scholar]
- Aigner L, Arber S, Kapfhammer JP, Laux T, Schneider C, Botteri F, Brenner HR, Caroni P. Overexpression of the neural growth-associated protein GAP-43 induces nerve sprouting in the adult nervous system of transgenic mice. Cell. 1995;83:269–278. doi: 10.1016/0092-8674(95)90168-x. [DOI] [PubMed] [Google Scholar]
- Allegra Mascaro AL, Cesare P, Sacconi L, Grasselli G, Mandolesi G, Maco B, Knott GW, Huang L, De Paola V, Strata P, et al. In vivo single branch axotomy induces GAP-43-dependent sprouting and synaptic remodeling in cerebellar cortex. Proc Natl Acad Sci USA. 2013;110:10824–10829. doi: 10.1073/pnas.1219256110. [DOI] [PMC free article] [PubMed] [Google Scholar]
- Andersen LB, Schreyer DJ. Constitutive expression of GAP-43 correlates with rapid, but not slow regrowth of injured dorsal root axons in the adult rat. Exp Neurol. 1999;155:157–164. doi: 10.1006/exnr.1998.6903. [DOI] [PubMed] [Google Scholar]
- Anderson KD, Morin MA, Beckel-Mitchener A, Mobarak CD, Neve RL, Furneaux HM, Burry R, Perrone-Bizzozero NI. Overexpression of HuD, but not of its truncated form HuD I+II, promotes GAP-43 gene expression and neurite outgrowth in PC12 cells in the absence of nerve growth factor. J Neurochem. 2000;75:1103–1114. doi: 10.1046/j.1471-4159.2000.0751103.x. [DOI] [PubMed] [Google Scholar]
- Arora A, Suess B. An RNA G-quadruplex in the 3′ UTR of the proto-oncogene PIM1 represses translation. RNA Biol. 2011;8:802–805. doi: 10.4161/rna.8.5.16038. [DOI] [PubMed] [Google Scholar]
- Bannai H, Fukatsu K, Mizutani A, Natsume T, Iemura S, Ikegami T, Inoue T, Mikoshiba K. An RNA-interacting protein, SYNCRIP (heterogeneous nuclear ribonuclear protein Q1/NSAP1) is a component of mRNA granule transported with inositol 1,4,5-trisphosphate receptor type 1 mRNA in neuronal dendrites. J Biol Chem. 2004;279:53427–53434. doi: 10.1074/jbc.M409732200. [DOI] [PubMed] [Google Scholar]
- Bharill S, Sarkar P, Ballin JD, Gryczynski I, Wilson GM, Gryczynski Z. Fluorescence intensity decays of 2-aminopurine solutions: lifetime distribution approach. Anal Biochem. 2008;377:141–149. doi: 10.1016/j.ab.2008.03.034. [DOI] [PMC free article] [PubMed] [Google Scholar]
- Bird CW, Gardiner AS, Bolognani F, Tanner DC, Chen CY, Lin WJ, Yoo S, Twiss JL, Perrone-Bizzozero N. KSRP modulation of GAP-43 mRNA stability restricts axonal outgrowth in embryonic hippocampal neurons. PLoS One. 2013;8:e79255. doi: 10.1371/journal.pone.0079255. [DOI] [PMC free article] [PubMed] [Google Scholar]
- Bogdanovic N, Davidsson P, Volkmann I, Winblad B, Blennow K. Growth-associated protein GAP-43 in the frontal cortex and in the hippocampus in Alzheimer’s disease: an immunohistochemical and quantitative study. J Neural Transm (Vienna) 2000;107:463–478. doi: 10.1007/s007020070088. [DOI] [PubMed] [Google Scholar]
- Bugaut A, Balasubramanian S. 5′-UTR RNA G-quadruplexes: translation regulation and targeting. Nucleic Acids Res. 2012;40:4727–4741. doi: 10.1093/nar/gks068. [DOI] [PMC free article] [PubMed] [Google Scholar]
- Campbell G, Anderson PN, Turmaine M, Lieberman AR. GAP-43 in the axons of mammalian CNS neurons regenerating into peripheral nerve grafts. Exp Brain Res. 1991;87:67–74. doi: 10.1007/BF00228507. [DOI] [PubMed] [Google Scholar]
- Ceman S, O’Donnell WT, Reed M, Patton S, Pohl J, Warren ST. Phosphorylation influences the translation state of FMRP-associated polyribosomes. Hum Mol Genet. 2003;12:3295–3305. doi: 10.1093/hmg/ddg350. [DOI] [PubMed] [Google Scholar]
- Chen HH, Yu HI, Chiang WC, Lin YD, Shia BC, Tarn WY. hnRNP Q regulates Cdc42-mediated neuronal morphogenesis. Mol Cell Biol. 2012;32:2224–2238. doi: 10.1128/MCB.06550-11. [DOI] [PMC free article] [PubMed] [Google Scholar]
- Chiaramello A, Neuman T, Peavy DR, Zuber MX. The GAP-43 gene is a direct downstream target of the basic helix-loop-helix transcription factors. J Biol Chem. 1996;271:22035–22043. doi: 10.1074/jbc.271.36.22035. [DOI] [PubMed] [Google Scholar]
- Chung S, Eckrich M, Perrone-Bizzozero N, Kohn DT, Furneaux H. The Elav-like proteins bind to a conserved regulatory element in the 3′-untranslated region of GAP-43 mRNA. J Biol Chem. 1997;272:6593–6598. doi: 10.1074/jbc.272.10.6593. [DOI] [PubMed] [Google Scholar]
- Clayton GH, Perez GM, Smith RL, Owens GC. Expression of mRNA for the elav-like neural-specific RNA binding protein, HuD, during nervous system development. Brain Res Dev Brain Res. 1998;109:271–280. doi: 10.1016/s0165-3806(98)00074-1. [DOI] [PubMed] [Google Scholar]
- David A, Dolan BP, Hickman HD, Knowlton JJ, Clavarino G, Pierre P, Bennink JR, Yewdell JW. Nuclear translation visualized by ribosome-bound nascent chain puromycylation. J Cell Biol. 2012;197:45–57. doi: 10.1083/jcb.201112145. [DOI] [PMC free article] [PubMed] [Google Scholar]
- de la Monte SM, Ng SC, Hsu DW. Aberrant GAP-43 gene expression in Alzheimer’s disease. Am J Pathol. 1995;147:934–946. [PMC free article] [PubMed] [Google Scholar]
- De Moliner KL, Wolfson ML, Perrone Bizzozero N, Adamo AM. Growth-associated protein-43 is degraded via the ubiquitin-proteasome system. J Neurosci Res. 2005;79:652–660. doi: 10.1002/jnr.20388. [DOI] [PubMed] [Google Scholar]
- Denny JB. Molecular mechanisms, biological actions, and neuropharmacology of the growth-associated protein GAP-43. Curr Neuropharmacol. 2006;4:293–304. doi: 10.2174/157015906778520782. [DOI] [PMC free article] [PubMed] [Google Scholar]
- Diolaiti D, Bernardoni R, Trazzi S, Papa A, Porro A, Bono F, Herbert JM, Perini G, Della Valle G. Functional cooperation between TrkA and p75(NTR) accelerates neuronal differentiation by increased transcription of GAP-43 and p21(CIP/WAF) genes via ERK1/2 and AP-1 activities. Exp Cell Res. 2007;313:2980–2992. doi: 10.1016/j.yexcr.2007.06.002. [DOI] [PubMed] [Google Scholar]
- Donnelly CJ, Park M, Spillane M, Yoo S, Pacheco A, Gomes C, Vuppalanchi D, McDonald M, Kim HH, Merianda TT, et al. Axonally synthesized beta-actin and GAP-43 proteins support distinct modes of axonal growth. J Neurosci. 2013;33:3311–3322. doi: 10.1523/JNEUROSCI.1722-12.2013. [DOI] [PMC free article] [PubMed] [Google Scholar]
- Donnelly CJ, Willis DE, Xu M, Tep C, Jiang C, Yoo S, Schanen NC, Kirn-Safran CB, van Minnen J, English A, et al. Limited availability of ZBP1 restricts axonal mRNA localization and nerve regeneration capacity. EMBO J. 2011;30:4665–4677. doi: 10.1038/emboj.2011.347. [DOI] [PMC free article] [PubMed] [Google Scholar]
- Donovan SL, Mamounas LA, Andrews AM, Blue ME, McCasland JS. GAP-43 is critical for normal development of the serotonergic innervation in forebrain. J Neurosci. 2002;22:3543–3552. doi: 10.1523/JNEUROSCI.22-09-03543.2002. [DOI] [PMC free article] [PubMed] [Google Scholar]
- Dotti CG, Sullivan CA, Banker GA. The establishment of polarity by hippocampal neurons in culture. J Neurosci. 1988;8:1454–1468. doi: 10.1523/JNEUROSCI.08-04-01454.1988. [DOI] [PMC free article] [PubMed] [Google Scholar]
- Erzurumlu RS, Jhaveri S, Moya KL, Benowitz LI. Peripheral nerve regeneration induces elevated expression of GAP-43 in the brainstem trigeminal complex of adult hamsters. Brain Res. 1989;498:135–139. doi: 10.1016/0006-8993(89)90408-3. [DOI] [PubMed] [Google Scholar]
- Furtig B, Richter C, Wohnert J, Schwalbe H. NMR spectroscopy of RNA. Chembiochem. 2003;4:936–962. doi: 10.1002/cbic.200300700. [DOI] [PubMed] [Google Scholar]
- Gauthier-Campbell C, Bredt DS, Murphy TH, El-Husseini Ael D. Regulation of dendritic branching and filopodia formation in hippocampal neurons by specific acylated protein motifs. Mol Biol Cell. 2004;15:2205–2217. doi: 10.1091/mbc.E03-07-0493. [DOI] [PMC free article] [PubMed] [Google Scholar]
- Goslin K, Schreyer DJ, Skene JH, Banker G. Changes in the distribution of GAP-43 during the development of neuronal polarity. J Neurosci. 1990;10:588–602. doi: 10.1523/JNEUROSCI.10-02-00588.1990. [DOI] [PMC free article] [PubMed] [Google Scholar]
- Grasselli G, Mandolesi G, Strata P, Cesare P. Impaired sprouting and axonal atrophy in cerebellar climbing fibres following in vivo silencing of the growth-associated protein GAP-43. PLoS One. 2011;6:e20791. doi: 10.1371/journal.pone.0020791. [DOI] [PMC free article] [PubMed] [Google Scholar]
- Hagihara H, Toyama K, Yamasaki N, Miyakawa T. Dissection of hippocampal dentate gyrus from adult mouse. J Vis Exp. 2009;2009:1543. doi: 10.3791/1543. [DOI] [PMC free article] [PubMed] [Google Scholar]
- Hardin CC, Perry AG, White K. Thermodynamic and kinetic characterization of the dissociation and assembly of quadruplex nucleic acids. Biopolymers. 2000;56:147–194. doi: 10.1002/1097-0282(2000/2001)56:3<147::AID-BIP10011>3.0.CO;2-N. [DOI] [PubMed] [Google Scholar]
- Harris CE, Boden RA, Astell CR. A novel heterogeneous nuclear ribonucleoprotein-like protein interacts with NS1 of the minute virus of mice. J Virol. 1999;73:72–80. doi: 10.1128/jvi.73.1.72-80.1999. [DOI] [PMC free article] [PubMed] [Google Scholar]
- He Q, Dent EW, Meiri KF. Modulation of actin filament behavior by GAP-43 (neuromodulin) is dependent on the phosphorylation status of serine 41, the protein kinase C site. J Neurosci. 1997;17:3515–3524. doi: 10.1523/JNEUROSCI.17-10-03515.1997. [DOI] [PMC free article] [PubMed] [Google Scholar]
- Holahan M, Routtenberg A. The protein kinase C phosphorylation site on GAP-43 differentially regulates information storage. Hippocampus. 2008;18:1099–1102. doi: 10.1002/hipo.20486. [DOI] [PMC free article] [PubMed] [Google Scholar]
- Joachimi A, Benz A, Hartig JS. A comparison of DNA and RNA quadruplex structures and stabilities. Bioorganic Med Chem. 2009;17:6811–6815. doi: 10.1016/j.bmc.2009.08.043. [DOI] [PubMed] [Google Scholar]
- Kanai Y, Dohmae N, Hirokawa N. Kinesin transports RNA: isolation and characterization of an RNA-transporting granule. Neuron. 2004;43:513–525. doi: 10.1016/j.neuron.2004.07.022. [DOI] [PubMed] [Google Scholar]
- Kikin O, D’Antonio L, Bagga PS. QGRS Mapper: a Web-based server for predicting G-quadruplexes in nucleotide sequences. Nucleic Acids Res. 2006;34:W676–W682. doi: 10.1093/nar/gkl253. [DOI] [PMC free article] [PubMed] [Google Scholar]
- Klebe RJ, Ruddle FH. Neuroblastoma: cell culture analysis of a differentiating stem cell system. J Cell Biol. 1969;43:69a. [Google Scholar]
- Kosik KS, Finch EA. MAP2 and tau segregate into dendritic and axonal domains after the elaboration of morphologically distinct neurites: an immunocytochemical study of cultured rat cerebrum. J Neurosci. 1987;7:3142–3153. doi: 10.1523/JNEUROSCI.07-10-03142.1987. [DOI] [PMC free article] [PubMed] [Google Scholar]
- Kypr J, Kejnovska I, Renciuk D, Vorlickova M. Circular dichroism and conformational polymorphism of DNA. Nucleic Acids Res. 2009;37:1713–1725. doi: 10.1093/nar/gkp026. [DOI] [PMC free article] [PubMed] [Google Scholar]
- Laux T, Fukami K, Thelen M, Golub T, Frey D, Caroni P. GAP43, MARCKS, and CAP23 modulate PI(4,5)P (2) at plasmalemmal rafts, and regulate cell cortex actin dynamics through a common mechanism. J Cell Biol. 2000;149:1455–1472. doi: 10.1083/jcb.149.7.1455. [DOI] [PMC free article] [PubMed] [Google Scholar]
- Leu B, Koch E, Schmidt JT. GAP43 phosphorylation is critical for growth and branching of retinotectal arbors in zebrafish. Dev Neurobiol. 2010;70:897–911. doi: 10.1002/dneu.20829. [DOI] [PubMed] [Google Scholar]
- Lyabin DN, Nigmatullina LF, Doronin AN, Eliseeva IA, Ovchinnikov LP. Identification of proteins specifically interacting with YB-1 mRNA 3′ UTR and the effect of hnRNP Q on YB-1 mRNA translation. Biochemistry (Moscow) 2013;78:651–659. doi: 10.1134/S0006297913060102. [DOI] [PubMed] [Google Scholar]
- McIlvain VA, Robertson DR, Maimone MM, McCasland JS. Abnormal thalamocortical pathfinding and terminal arbors lead to enlarged barrels in neonatal GAP-43 heterozygous mice. J Comp Neurol. 2003;462:252–264. doi: 10.1002/cne.10725. [DOI] [PubMed] [Google Scholar]
- Menon L, Mader SA, Mihailescu MR. Fragile X mental retardation protein interactions with the microtubule associated protein 1B RNA. RNA. 2008;14:1644–1655. doi: 10.1261/rna.1100708. [DOI] [PMC free article] [PubMed] [Google Scholar]
- Menon L, Mihailescu MR. Interactions of the G quartet forming semaphorin 3F RNA with the RGG box domain of the fragile X protein family. Nucleic Acids Res. 2007;35:5379–5392. doi: 10.1093/nar/gkm581. [DOI] [PMC free article] [PubMed] [Google Scholar]
- Mergny JL, Phan AT, Lacroix L. Following G-quartet formation by UV-spectroscopy. FEBS Lett. 1998;435:74–78. doi: 10.1016/s0014-5793(98)01043-6. [DOI] [PubMed] [Google Scholar]
- Miyoshi D, Nakao A, Sugimoto N. Structural transition from antiparallel to parallel G-quadruplex of d(G4T4G4) induced by Ca2+ Nucleic Acids Res. 2003;31:1156–1163. doi: 10.1093/nar/gkg211. [DOI] [PMC free article] [PubMed] [Google Scholar]
- Mizutani A, Fukuda M, Ibata K, Shiraishi Y, Mikoshiba K. SYNCRIP, a cytoplasmic counterpart of heterogeneous nuclear ribonucleoprotein R, interacts with ubiquitous synaptotagmin isoforms. J Biol Chem. 2000;275:9823–9831. doi: 10.1074/jbc.275.13.9823. [DOI] [PubMed] [Google Scholar]
- Mourelatos Z, Abel L, Yong J, Kataoka N, Dreyfuss G. SMN interacts with a novel family of hnRNP and spliceosomal proteins. EMBO J. 2001;20:5443–5452. doi: 10.1093/emboj/20.19.5443. [DOI] [PMC free article] [PubMed] [Google Scholar]
- Muddashetty RS, Nalavadi VC, Gross C, Yao X, Xing L, Laur O, Warren ST, Bassell GJ. Reversible inhibition of PSD-95 mRNA translation by miR-125a, FMRP phosphorylation, and mGluR signaling. Mol Cell. 2011;42:673–688. doi: 10.1016/j.molcel.2011.05.006. [DOI] [PMC free article] [PubMed] [Google Scholar]
- Munoz JP, Alvarez A, Maccioni RB. Increase in the expression of the neuronal cyclin-dependent protein kinase cdk-5 during differentiation of N2A neuroblastoma cells. Neuroreport. 2000;11:2733–2738. doi: 10.1097/00001756-200008210-00025. [DOI] [PubMed] [Google Scholar]
- Nambiar M, Goldsmith G, Moorthy BT, Lieber MR, Joshi MV, Choudhary B, Hosur RV, Raghavan SC. Formation of a G-quadruplex at the BCL2 major breakpoint region of the t(14;18) translocation in follicular lymphoma. Nucleic Acids Res. 2011;39:936–948. doi: 10.1093/nar/gkq824. [DOI] [PMC free article] [PubMed] [Google Scholar]
- Namgung U, Routtenberg A. Transcriptional and post-transcriptional regulation of a brain growth protein: regional differentiation and regeneration induction of GAP-43. Eur J Neurosci. 2000;12:3124–3136. doi: 10.1046/j.1460-9568.2000.00196.x. [DOI] [PubMed] [Google Scholar]
- Paramasivan S, Rujan I, Bolton PH. Circular dichroism of quadruplex DNAs: applications to structure, cation effects and ligand binding. Methods. 2007;43:324–331. doi: 10.1016/j.ymeth.2007.02.009. [DOI] [PubMed] [Google Scholar]
- Piotto M, Saudek V, Sklenar V. Gradient-tailored excitation for single-quantum NMR spectroscopy of aqueous solutions. J Biomol NMR. 1992;2:661–665. doi: 10.1007/BF02192855. [DOI] [PubMed] [Google Scholar]
- Randazzo A, Spada GP, da Silva MW. Circular dichroism of quadruplex structures. Top Curr Chem. 2013;330:67–86. doi: 10.1007/128_2012_331. [DOI] [PubMed] [Google Scholar]
- Rekart JL, Meiri K, Routtenberg A. Hippocampal-dependent memory is impaired in heterozygous GAP-43 knockout mice. Hippocampus. 2005;15:1–7. doi: 10.1002/hipo.20045. [DOI] [PubMed] [Google Scholar]
- Rossoll W, Kroning AK, Ohndorf UM, Steegborn C, Jablonka S, Sendtner M. Specific interaction of Smn, the spinal muscular atrophy determining gene product, with hnRNP-R and gry-rbp/hnRNP-Q: a role for Smn in RNA processing in motor axons. Hum Mol Genet. 2002;11:93–105. doi: 10.1093/hmg/11.1.93. [DOI] [PubMed] [Google Scholar]
- Schaeffer C, Bardoni B, Mandel JL, Ehresmann B, Ehresmann C, Moine H. The fragile X mental retardation protein binds specifically to its mRNA via a purine quartet motif. EMBO J. 2001;20:4803–4813. doi: 10.1093/emboj/20.17.4803. [DOI] [PMC free article] [PubMed] [Google Scholar]
- Schreyer DJ, Skene JH. Fate of GAP-43 in ascending spinal axons of DRG neurons after peripheral nerve injury: delayed accumulation and correlation with regenerative potential. J Neurosci. 1991;11:3738–3751. doi: 10.1523/JNEUROSCI.11-12-03738.1991. [DOI] [PMC free article] [PubMed] [Google Scholar]
- Serrano-Andres L, Merchan M, Borin AC. Adenine and 2-aminopurine: paradigms of modern theoretical photochemistry. Proc Natl Acad Sci USA. 2006;103:8691–8696. doi: 10.1073/pnas.0602991103. [DOI] [PMC free article] [PubMed] [Google Scholar]
- Shen Y, Mani S, Donovan SL, Schwob JE, Meiri KF. Growth-associated protein-43 is required for commissural axon guidance in the developing vertebrate nervous system. J Neurosci. 2002;22:239–247. doi: 10.1523/JNEUROSCI.22-01-00239.2002. [DOI] [PMC free article] [PubMed] [Google Scholar]
- Shen Y, Meiri K. GAP-43 dependency defines distinct effects of netrin-1 on cortical and spinal neurite outgrowth and directional guidance. Int J Dev Neurosci. 2013;31:11–20. doi: 10.1016/j.ijdevneu.2012.10.006. [DOI] [PubMed] [Google Scholar]
- Smith CL, Afroz R, Bassell GJ, Furneaux HM, Perrone-Bizzozero NI, Burry RW. GAP-43 mRNA in growth cones is associated with HuD and ribosomes. J Neurobiol. 2004;61:222–235. doi: 10.1002/neu.20038. [DOI] [PubMed] [Google Scholar]
- Stefanovic S, Bassell GJ, Mihailescu MR. G quadruplex RNA structures in PSD-95 mRNA: potential regulators of miR-125a seed binding site accessibility. RNA. 2015a;21:48–60. doi: 10.1261/rna.046722.114. [DOI] [PMC free article] [PubMed] [Google Scholar]
- Stefanovic S, DeMarco BA, Underwood A, Williams KR, Bassell GJ, Mihailescu MR. Fragile X mental retardation protein interactions with a G quadruplex structure in the 3′-untranslated region of NR2B mRNA. Mol Biosyst. 2015b;11:3222–3230. doi: 10.1039/c5mb00423c. [DOI] [PMC free article] [PubMed] [Google Scholar]
- Strittmatter SM, Fankhauser C, Huang PL, Mashimo H, Fishman MC. Neuronal pathfinding is abnormal in mice lacking the neuronal growth cone protein GAP-43. Cell. 1995;80:445–452. doi: 10.1016/0092-8674(95)90495-6. [DOI] [PubMed] [Google Scholar]
- Svitkin YV, Yanagiya A, Karetnikov AE, Alain T, Fabian MR, Khoutorsky A, Perreault S, Topisirovic I, Sonenberg N. Control of translation and miRNA-dependent repression by a novel poly(A) binding protein, hnRNP-Q. PLoS Biol. 2013;11:e1001564. doi: 10.1371/journal.pbio.1001564. [DOI] [PMC free article] [PubMed] [Google Scholar]
- Tedeschi A, Nguyen T, Puttagunta R, Gaub P, Di Giovanni S. A p53-CBP/p300 transcription module is required for GAP-43 expression, axon outgrowth, and regeneration. Cell Death Differ. 2009;16:543–554. doi: 10.1038/cdd.2008.175. [DOI] [PubMed] [Google Scholar]
- Tian SY, Wang JF, Bezchlibnyk YB, Young LT. Immunoreactivity of 43 kDa growth-associated protein is decreased in post mortem hippocampus of bipolar disorder and schizophrenia. Neurosci Lett. 2007;411:123–127. doi: 10.1016/j.neulet.2006.10.031. [DOI] [PubMed] [Google Scholar]
- tom Dieck S, Muller A, Nehring A, Hinz FI, Bartnik I, Schuman EM, Dieterich DC. Metabolic labeling with noncanonical amino acids and visualization by chemoselective fluorescent tagging. Current Protoc Cell Biol. 2012;Chap. 7:unit 7.11. doi: 10.1002/0471143030.cb0711s56. [DOI] [PMC free article] [PubMed] [Google Scholar]
- Van der Zee CE, Nielander HB, Vos JP, Lopes da Silva S, Verhaagen J, Oestreicher AB, Schrama LH, Schotman P, Gispen WH. Expression of growth-associated protein B-50 (GAP43) in dorsal root ganglia and sciatic nerve during regenerative sprouting. J Neurosci. 1989;9:3505–3512. doi: 10.1523/JNEUROSCI.09-10-03505.1989. [DOI] [PMC free article] [PubMed] [Google Scholar]
- Vorlickova M, Tomasko M, Sagi AJ, Bednarova K, Sagi J. 8-Oxoguanine in a quadruplex of the human telomere DNA sequence. FEBS J. 2012;279:29–39. doi: 10.1111/j.1742-4658.2011.08396.x. [DOI] [PubMed] [Google Scholar]
- Weber JR, Skene JH. Identification of a novel repressive element that contributes to neuron-specific gene expression. J Neurosci. 1997;17:7583–7593. doi: 10.1523/JNEUROSCI.17-20-07583.1997. [DOI] [PMC free article] [PubMed] [Google Scholar]
- Welshhans K, Bassell GJ. Netrin-1-induced local beta-actin synthesis and growth cone guidance requires zipcode binding protein 1. J Neurosci. 2011;31:9800–9813. doi: 10.1523/JNEUROSCI.0166-11.2011. [DOI] [PMC free article] [PubMed] [Google Scholar]
- Wigington CP, Williams KR, Meers MP, Bassell GJ, Corbett AH. Poly(A) RNA-binding proteins and polyadenosine RNA: new members and novel functions. Wiley Interdiscip Rev RNA. 2014;5:601–622. doi: 10.1002/wrna.1233. [DOI] [PMC free article] [PubMed] [Google Scholar]
- Xing L, Yao X, Williams KR, Bassell GJ. Negative regulation of RhoA translation and signaling by hnRNP-Q1 affects cellular morphogenesis. Mol Biol Cell. 2012;23:1500–1509. doi: 10.1091/mbc.E11-10-0867. [DOI] [PMC free article] [PubMed] [Google Scholar]
- Yoo S, Kim HH, Kim P, Donnelly CJ, Kalinski AL, Vuppalanchi D, Park M, Lee SJ, Merianda TT, Perrone-Bizzozero NI, et al. A HuD-ZBP1 ribonucleoprotein complex localizes GAP-43 mRNA into axons through its 3′ untranslated region AU-rich regulatory element. J Neurochem. 2013;126:792–804. doi: 10.1111/jnc.12266. [DOI] [PMC free article] [PubMed] [Google Scholar]
- Zaccaria KJ, Lagace DC, Eisch AJ, McCasland JS. Resistance to change and vulnerability to stress: autistic-like features of GAP43-deficient mice. Genes Brain Behav. 2010;9:985–996. doi: 10.1111/j.1601-183X.2010.00638.x. [DOI] [PMC free article] [PubMed] [Google Scholar]
Associated Data
This section collects any data citations, data availability statements, or supplementary materials included in this article.