

Abstract
Objective:
To establish a baseline for the incidence of sepsis by severity and presence on admission in acute care hospital settings before implementation of a broad sepsis screening and response initiative.
Methods:
A retrospective cohort study using hospital discharge abstracts of 5672 patients, aged 18 years and above, with sepsis-associated stays between February 2012 and January 2013 at an academic medical center and 5 community hospitals in Texas.
Results:
Sepsis was present on admission in almost 85% of cases and acquired in-hospital in the remainder. The overall inpatient death rate was 17.2%, but was higher in hospital-acquired sepsis (38.6%, medical; 29.2%, surgical) and Stages 2 (17.6%) and 3 (36.4%) compared with Stage 1 (5.9%). Patients treated at the academic medical center had a higher death rate (22.5% vs. 15.1%, P<0.001) and were more costly ($68,050±184,541 vs. $19,498±31,506, P<0.001) versus community hospitals.
Conclusions:
Greater emphasis is needed on public awareness of sepsis and the detection of sepsis in the prehospitalization and early hospitalization period. Hospital characteristics and case mix should be accounted for in cross-hospital comparisons of sepsis outcomes and costs.
Key Words: sepsis, severe sepsis, septic shock, hospital utilization, hospital cost, outcomes of care, inpatient death rates, multiple stay rate, CMS Innovation Awards
Septicemia is the most expensive condition treated in US hospitals, accounting for over 5% of the aggregate cost of all US hospitalizations.1 More is being learned about the clinical epidemiology of sepsis in the United States as a result of analyses of hospital discharge databases such as the Nationwide Inpatient Sample,2–5 the National Hospital Discharge Survey,6 the University Health Consortium,7–10 and those of large health plans.11 In this paper, using data from the multicenter Sepsis Early Recognition and Response Initiative (SERRI) a program funded by the Centers for Medicare and Medicaid Innovation (CMMI)11,12 we report findings on sepsis-associated stays and hospital utilization patterns to add further detail to existing knowledge about the timing of diagnosis, most severe stage of sepsis attained, differences between patients treated at an academic medical center versus community hospitals, and hospital multiple stay rates.
METHODS
The Office of Research Protections of the Houston Methodist Research Institute ruled that the Sepsis Early Recognition and Response Initiative (SERRI) project is not research and therefore does not require review or approval by the Institutional Review Board.
The data reported in this retrospective cohort study come from the 6 acute care hospitals (1 tertiary academic medical center and 5 community hospitals) participating in the Texas Gulf Coast Sepsis Network and the SERRI. The findings reported herein are derived from the baseline period before the implementation of SERRI began.
SERRI and the precedent program on which its design was based have been reported elsewhere,12,13 as have the characteristics of the participating acute care hospitals.13 Briefly, the 6 hospitals, with capacity of 140–799 adult beds, are located within and outside the Houston metropolitan area, and are a mix of not-for-profit and for-profit facilities. The hospital stays reported here are sepsis-associated stays in persons aged 18 years and above that occurred during the 12-month period from February 2012 through January 2013. In the 5 community hospitals, this period preceded the implementation of the sepsis screening and treatment protocols of the SERRI program; in the academic medical center, where the precedent program for SERRI was developed and has been in place since 2008, this period preceded the expansion of the program to additional clinical units.
The data were derived from hospital discharge/claims databases using the fields found in the Uniform Billing Form 04. Working from a technical specification document that describes fields and data formats, hospitals participating in SERRI provide deidentified but linkable discharge data to the SERRI Program Office, which analyzes the data and submits it back to the participating sites as well as to CMMI. The Program Office conducts data cleaning and extensive data validation and works with the sites to ensure data integrity. The analyses reported here were conducted by the SERRI Program Office (all the authors, except F.M.).
A sepsis-associated hospital stay was defined as a stay for which 1 or more of the following ICD-9-CM codes was found in any slot in the diagnosis list: 038 (septicemia), 995.91 (sepsis), 995.92 (severe sepsis), or 785.52 (septic shock). We classified the stage of sepsis for each stay according to the most severe sepsis ICD-9 code that was recorded in the discharge abstract, as follows: Stage 1 (sepsis), 038.0–038.9 and/or 995.91; Stage 2 (severe sepsis), 995.92; and Stage 3 (septic shock), 785.52. A stay might have all 4 ICD-9 sepsis codes, for example, if the patient was admitted at the septicemia/sepsis stage and progressed through the stage of severe sepsis to septic shock. We categorized patients as to the most severe stage they attained during the stay; the patient in the example would have been placed into Stage 3.
Stays were classified as sepsis present-on-admission (POA) if the POA field, a field required by Medicare as of October 1, 2007, had a “yes” indicator. Sepsis stays for which the POA indicator was “no” were classified as medical or surgical hospital-acquired sepsis based on whether the stay was classified into a medical or surgical Medicare Severity Diagnosis Related Group (MS-DRG). Because a sepsis-associated stay can be grouped into 1 of 4 sepsis-specific DRGs (Table 1) or many of the other 700+ DRGs, and payment to hospitals is dependent on DRG rather than ICD-9 code, we also report how sepsis-associated stays were distributed across DRGs. We do not analyze hospital charges, but rather “cost to payer,” which is the reimbursement that the hospital anticipates receiving for the stay from the primary payer. “Cost to payer,” a figure estimated by the hospital billing office, is hospital charges less contractual obligations, contractual discounts, and patient copayments. We chose this metric because one of the objectives for the projects in this CMMI Portfolio is to evaluate the extent to which they reduce CMS costs, that is, reimbursements to hospitals and providers. All hospitals estimate the cost to payer (the inverse of which is revenue to hospital) for each hospital stay; this figure estimates what the hospital expects to receive for the stay, and is available much sooner than the amount actually received by the hospital, given the lag that exists between filing a claim and being reimbursed for a claim.
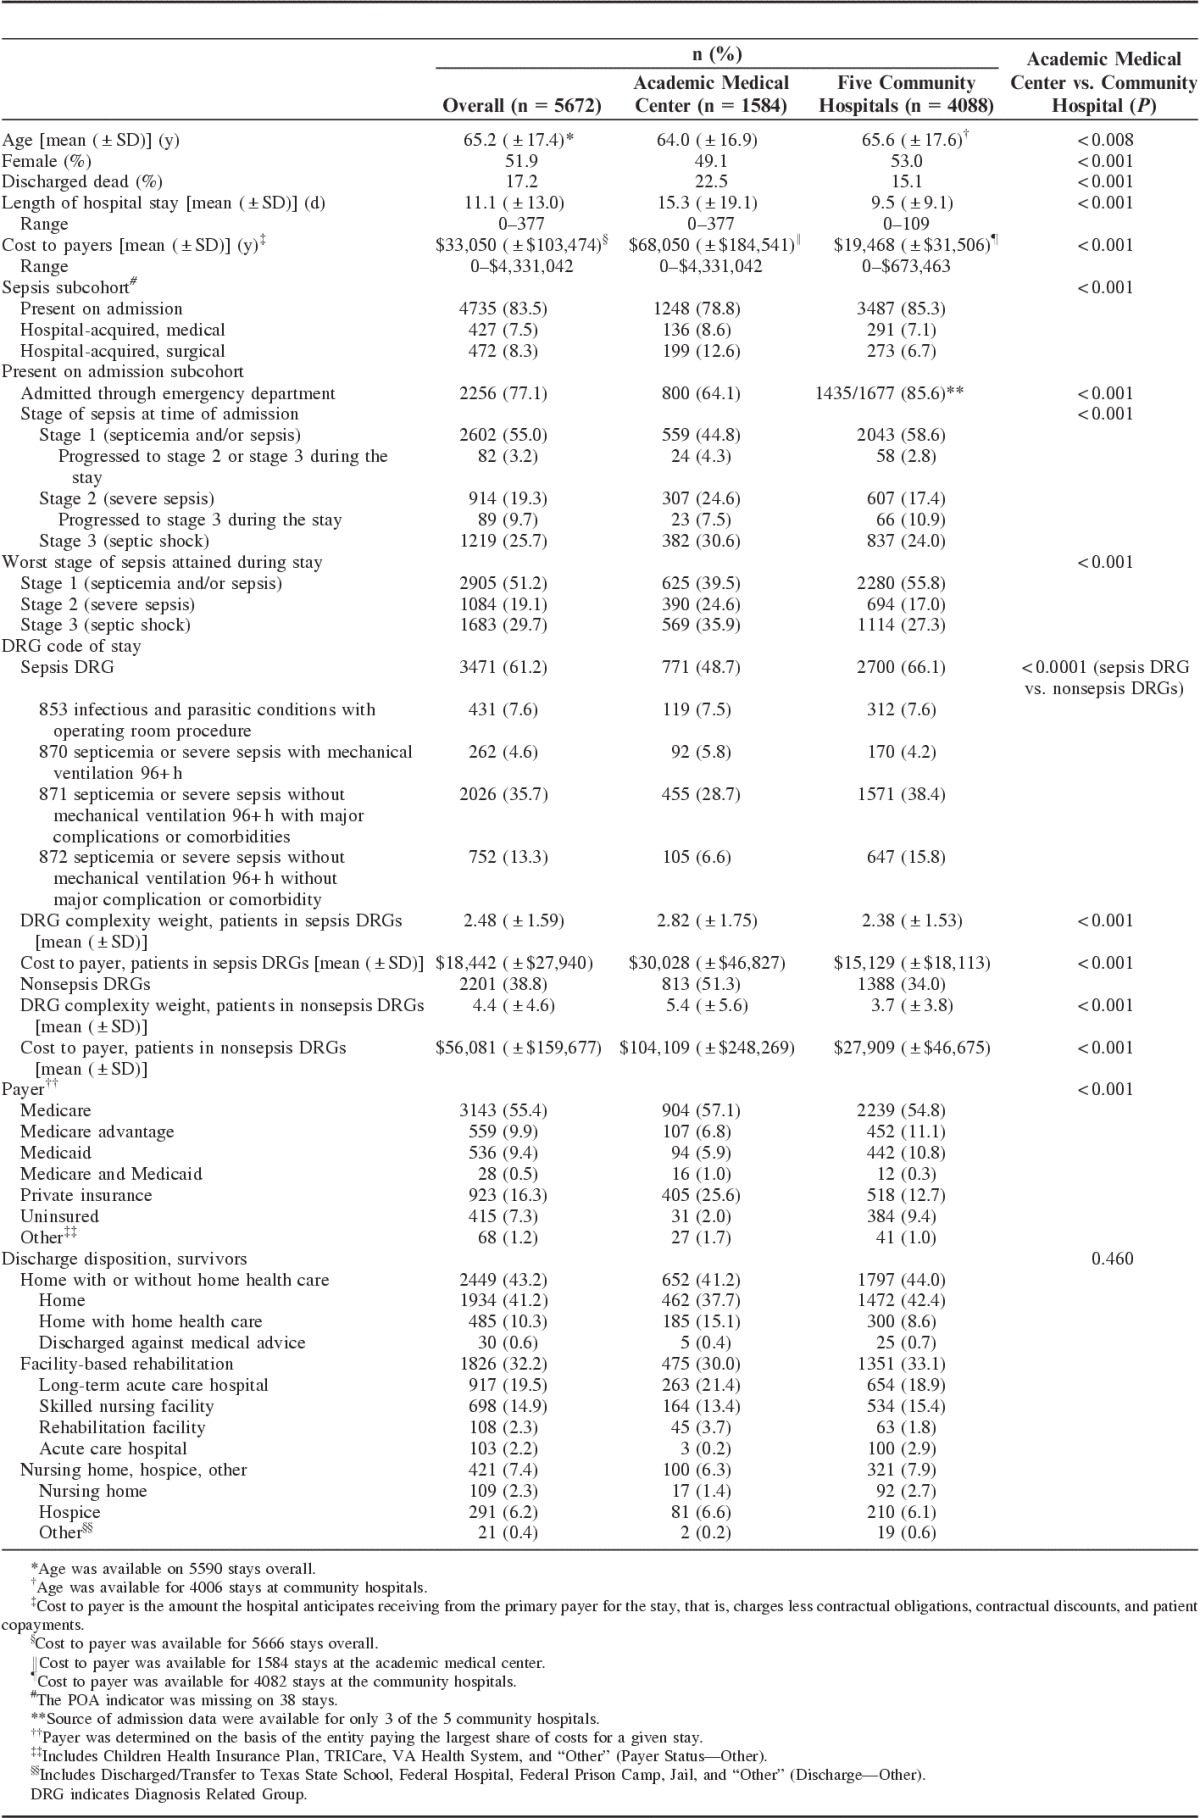
TABLE 1.
Sepsis-associated Stays: Demographics and Clinical Attributes and Outcomes, Overall and by Hospital Type
To compare the intensity of hospital use between persons hospitalized 1 or more times for sepsis during the 12-month period compared with those hospitalized for nonsepsis conditions, we obtained data on all inpatient stays (not just sepsis-associated stays) occurring during this 12-month period and calculated the multiple stay rate.14 The multiple stay rate is the number of hospital stays in a period divided by the number of unique hospital users. Two of the community hospitals and the academic medical center were able to provide these data.
RESULTS
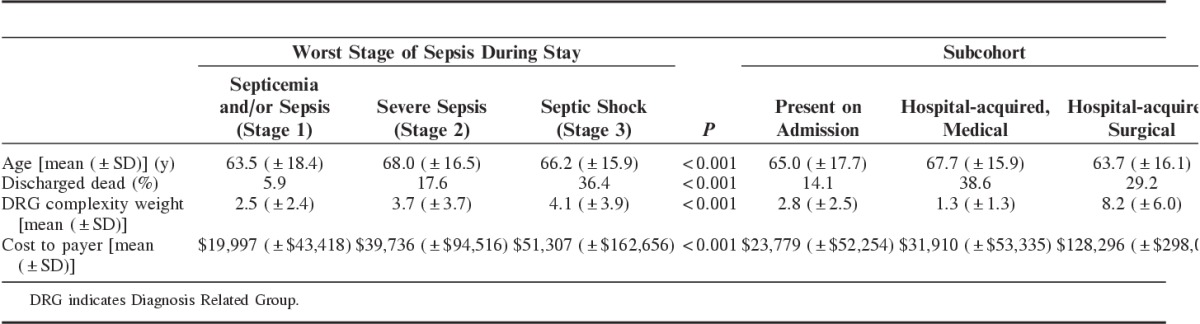
A total of 5672 sepsis-associated stays occurred at the 6 hospitals during the 12-month baseline period, only 61.2% of which were classified into a sepsis DRG (Table 1). In half the cases (51.2%) sepsis did not progress past Stage 1 (septicemia/sepsis). Overall, the inpatient death rate was 17.2% (Table 1), but as Table 2 shows the mortality rate was higher in patients with Stage 3 (septic shock) compared with Stages 1 or 2, in patients who acquired sepsis in hospital compared with those in whom it was POA, and in patients in DRG 870 (sepsis with mechanical ventilation for 96+ h) or in a nonsepsis DRG compared with those in the other sepsis DRGs.
TABLE 2.
Selected Attributes of Sepsis-associated Stays, by Stage of Sepsis, Present on Admission or Hospital Acquired, and DRG
Sepsis was POA in 83.5% of cases and was acquired in the hospital in the remainder (Table 1). Overall, 77.1% of patients whose sepsis was POA were admitted through the emergency department (ED). Over half of those (55.0%) whose sepsis was POA were Stage 1 at the time of admission. Progression to Stage 2 or 3 during the hospital stay occurred in 3.2% of those whose sepsis was Stage 1 at the time of admission; progression to Stage 3 occurred in 9.7% of patients whose sepsis was at Stage 2 at the time of admission (Table 1).
The average length of hospital stay was 11.1 days (±13.0 SD) and the average cost to payer was $33,050 (±$103,474 SD) (Table 1). Medicare and/or Medicaid was the primary payer for 75.2% of hospital stays. Mean cost per stay increased across the stages of sepsis. Stays in the surgical hospital-acquired sepsis subcohort were by far the most costly (mean $128,296±$298,003 SD) (Table 2).
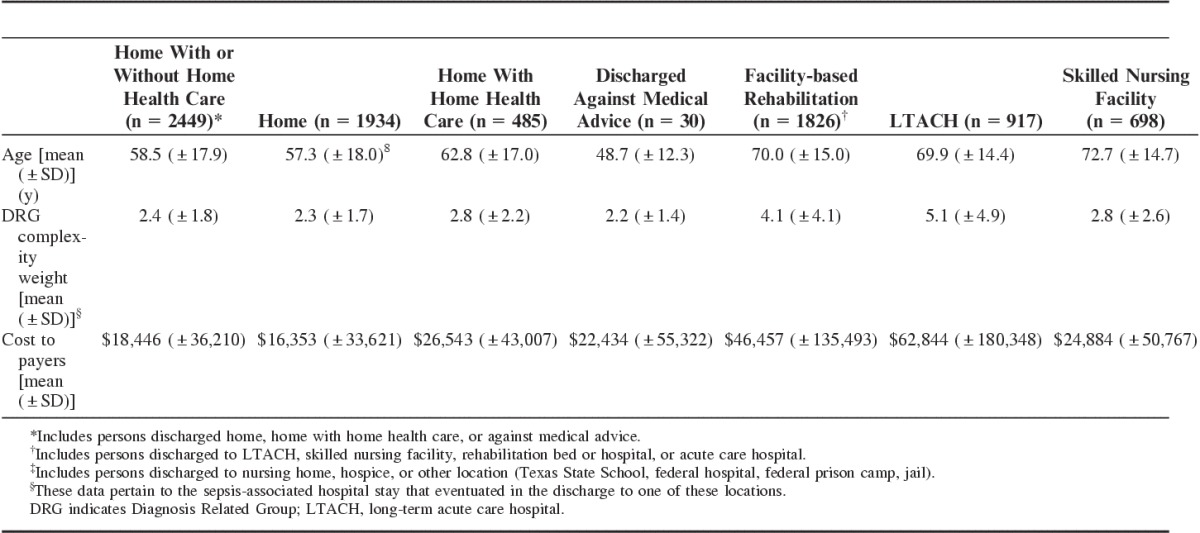
Whereas 43.2% of survivors were discharged home with or without home health care, 32.2% were discharged to facility-based rehabilitation (Table 1). Persons discharged home were younger than those discharged to facility-based rehabilitation (58.5±17.9 vs. 70.0±15.0 y SD) (Table 3).
TABLE 3.
Selected Attributes of Sepsis-associated Stays of Survivors, by Discharge Disposition
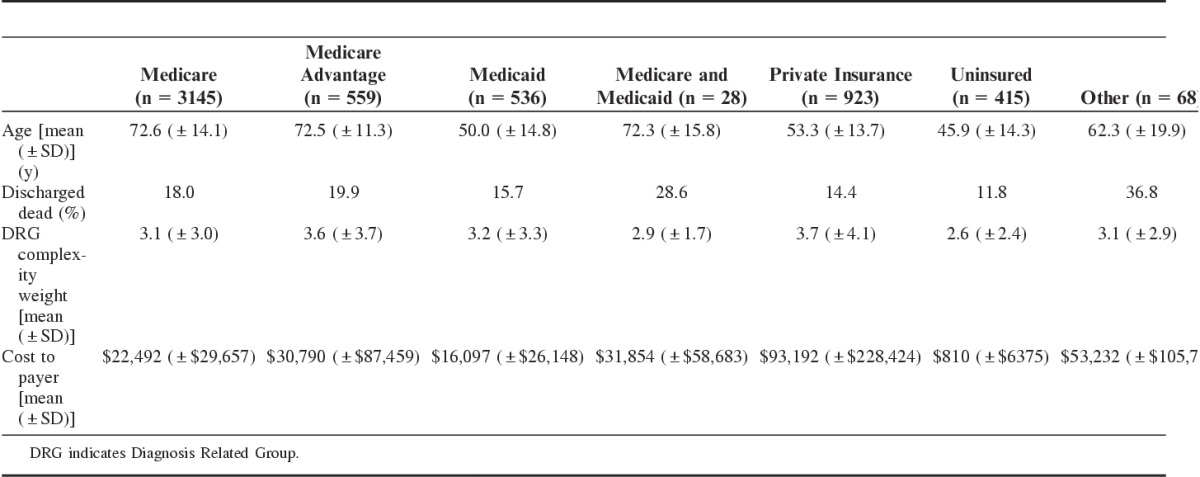
Compared with patients treated for sepsis at community hospitals, those treated at the academic medical center had a higher inpatient death rate (22.5% vs. 15.1%, P<0.001) and were more costly ($68,050±$184,541 vs. $19,468±$31,506 SD, P<0.001) (Table 1). These differences are at least partially explained by differences in the distribution of sepsis stages, the distribution of subcohorts, and DRG classifications between the 2 types of hospitals. Patients with more severe sepsis (Stage 2, severe sepsis and Stage 3, septic shock) accounted for less than half (44.3%) of sepsis patients treated at community hospitals, but 60.5% of those treated at the academic medical center (P<0.001). The 2 most lethal and costly subcohorts (hospital-acquired medical or surgical sepsis) accounted for 13.8% of sepsis patients at community hospitals but 21.2% at the academic medical center (P<0.001). Community hospitals treated proportionally fewer patients whose stays were classified into the highest-mortality DRG, DRG 870 (septicemia or sepsis with mechanical ventilation for 96+ h) or a nonsepsis DRG than did the academic medical center (Table 1). In stays classified into a nonsepsis DRG, DRG complexity weight (a value assigned by Medicare that is a proxy for clinical severity and resource consumption) was lower in community hospitals (mean DRG weight 3.7±3.8 vs. 5.4±5.6 SD, P<0.001), as was mean cost to payer ($27,909±$46,675 vs. $104,109±$248,269 SD, P<0.001) (Table 1). Another factor contributing to the higher cost for patients treated at the academic medical center is payer mix: private commercial insurance, which as Table 4 shows provides the highest reimbursements among types of payers, was twice as common among patients treated at the academic medical center. (Compared with community hospitals, academic medical centers also receive a slightly higher payment per DRG to cover the cost of graduate medical education and to compensate for a more severe case mix.).
TABLE 4.
Selected Attributes of Sepsis-associated Stays, by Payer
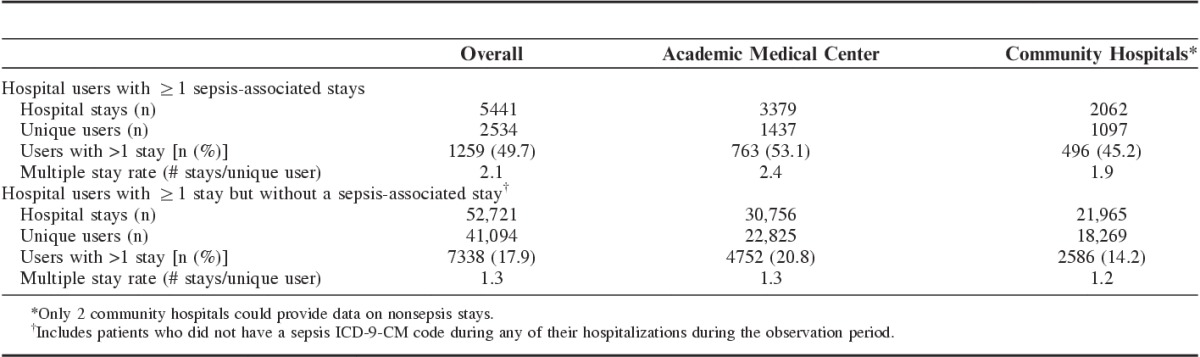
As to the intensity of hospital use during the 12-month period, patients with a sepsis-associated stay were higher users than those hospitalized for nonsepsis diagnoses (Table 5). In the sepsis group, 2543 unique individuals had 5441 stays (2.1 stays per user), whereas in the nonsepsis group 41,094 unique individuals had 52,721 stays (1.3 stays per user). The proportion of patients with >1 stay in the sepsis group was 49.7% compared with 17.9% in the nonsepsis group (P<0.001).
TABLE 5.
Multiple Hospital Stays by Type of Hospital User and Hospital Type
DISCUSSION
Our analysis of a cohort of over 5600 inpatients treated at 6 Texas hospitals shows that the great majority of patients are admitted with sepsis rather than acquiring it in hospital, that substantial differences exist between patients treated for sepsis at academic medical centers and community hospitals in terms of sepsis epidemiology, outcomes, and costs, and that patients with 1 or more sepsis stays in a given period are much more likely to have multiple hospital stays during that period than patients treated in hospital for other conditions. The overall inpatient death rate in our cohort—17.2%—is slightly higher than the inpatient mortality rate for septicemia hospitalizations derived from the Nationwide Inpatient Sample, 14.7%–16.3%.5 Hospital-acquired sepsis is associated with a higher mortality than sepsis POA, 14.1% vs. 38.6% for medical hospital-acquired sepsis and 29.2% for surgical hospital-acquired sepsis. Page et al,10 the first and only other group to our knowledge to categorize sepsis stays as community acquired or hospital acquired, also found that hospital-acquired sepsis was associated with a much greater inpatient mortality risk than community-acquired (POA) sepsis.
In this study, nearly 85% of patients with a sepsis-associated stay have sepsis POA—3 other studies have found 70%, 92%, and 89%, respectively9–11—and of those, over three quarters were admitted through the ED. To be effective, early recognition programs must include the ED and the prehospital period. Screening for sepsis is based mostly on criteria for presence of the systemic inflammatory response syndrome (SIRS), a syndrome characterized by fever, tachycardia, tachypnea, and an abnormal white blood count that can be the herald of sepsis or other noninfectious acute insults such as trauma or pancreatitis. Even in the intensive care unit setting, SIRS-based sepsis screening has substantial proportions of false positives and false negatives.15 SIRS is common in patients using the ED, even though the diagnosis of sepsis in the ED is uncommon. One study based on the National Hospital Ambulatory Medical Care Survey found a SIRS prevalence of 18% among adult ED cases; only 26% of those with SIRS were given a subsequent diagnosis of infection.16 Another study using the same data source found that <1% of ED visits culminate in an explicit diagnosis of sepsis.17 To be successful, specialized sepsis screening programs for use in ED settings must take into account the high prevalence of SIRS and unique ED workflows and missions. Moreover, besides health professionals in the ED, the lay public must be made aware of the signs and symptoms of sepsis and the need to seek prompt medical attention, hopefully before sepsis progresses past Stage 1. In this study, Stage 1 (septicemia and/or sepsis) was associated with a 5.9% inpatient death rate, compared with 17.6% in Stage 2 (severe sepsis) and 36.4% in Stage 3 (septic shock). Clearly, much more public education about sepsis is needed. A June 2014 survey conducted for the Sepsis Alliance found that only 44% of Americans had ever heard of sepsis.18
The differences noted in this study between patients with sepsis treated at an academic medical center versus community hospitals have important implications for cross-sectional comparisons of sepsis-associated inpatient death rates and longitudinal tracking of changes in sepsis-associated mortality. Our analyses indicate that the academic medical center cares for more severely ill and complex patients with sepsis. If differences in the types of hospitals in the analysis pool are not taken into account, spurious conclusions may be drawn about cross-sectional differences in quality of care or temporal trends in death rates. The same is true for the distribution of DRGs between the 2 types of hospitals: the underlying distribution of DRGs—and not just the sepsis DRGs—drives the direct costs as well as the reimbursements to hospitals for sepsis-associated stays. The academic medical center in this study has a high-volume organ transplant program, implants cardiac assist devices, and provides extracorporeal membrane oxygenator support, all of which are associated with an elevated risk of postprocedure, hospital-acquired sepsis, and which therefore introduce significant case mix differences between it and the community hospitals which do not offer these services. We are not aware of other work that makes this point. For example, a recent analysis of severe sepsis hospitalizations by Page et al,10 using University HealthSystem Consortium data that included 300 academic hospitals and their community affiliates, risk-adjusted at the patient level but not for hospital type. This approach is justifiable when examining sepsis epidemiology but may not be when comparing hospitals on sepsis outcomes and rewarding or penalizing them accordingly.
We do not know of other work that uses, as we do, “cost to payer” (what the hospital anticipates receiving from the primary payer for the stay, and its inverse, what the primary payer expects to have to pay) to examine the financial impact of sepsis-associated stays. Most other studies use hospital charges multiplied by their cost-to-charge ratios. It has been widely commented on in the research and lay literature that hospital charges are grossly skewed and bear an uncertain relationship to what it actually costs a hospital to produce an inpatient stay, which calls into question the entire foundation of the cost-to-charge ratio. In considering “cost to payer,” it is true that contractual obligations and discounts, which are part of this metric, vary across hospitals even in the same location, limiting the generalizability of these estimates. But “cost-to-payer” does reflect the amount of dollars the hospital is willing to accept as reimbursement for the stay, and there has been some empirical evaluation of the characteristics of hospitals that have high charge-to-reimbursement ratios.19 Use of the cost-to-payer metric seemed the optimal choice given the goals of the SERRI project, but further evaluation is warranted if this metric is used with the intention to generalize results outside the study.
Our analyses showed that patients with a sepsis-associated hospital stay have much more intense hospital use in a 12-month period compared with patients hospitalized for nonsepsis conditions: 2.1 stays per user in the former compared with 1.3 in the latter. These are underestimates for 2 reasons: first, our period was based on calendar time, which means that individuals did not have equal periods of risk for readmission, and second, we could only detect readmissions back to the same hospital or hospital system, which means readmissions elsewhere were missed. Moreover, we do not know whether the debility from a sepsis-associated stay is what precipitated a period of high hospital use in a previously low user, or whether sepsis occurred in the middle or end of a period of high hospital use in a person with serious chronic illness and recurrent hospitalizations, or whether sepsis was a sort of epiphenomenon during a series of hospitalizations for a serious condition such as organ failure and transplantation. Little is known about the hospital use patterns of persons with sepsis-associated stays, because most publicly available databases do not allow for the linking of successive hospital episodes by unique patient to view the per-person intensity of hospital utilization over time. Linking the Health and Retirement Survey with Medicare claims data, Prescott et al20 found that survivors of hospitalization for severe sepsis had 30-, 60-, and 365-day hospital readmission rates of 26.5%, 41%, and 63.0%, respectively. Among Medicare beneficiaries in an 18-state sample, septicemia was found to be second only to congestive heart failure, which for decades has been the number 1 cause of readmission, as to its 30-day readmission rate.21 This intense hospital use occurs in addition to the use of facility-based rehabilitation after discharge, which in our study followed the hospital stays of over 3 out of 10 survivors.
We used “explicit” case definitions for sepsis rather than the “implicit” definitions used by others, for example, by Angus et al,22 and most recently, by Page et al.10 Both approaches to case identification are based on ICD-9 codes but lead to somewhat different estimates of sepsis incidence and mortality.2 It is possible that we detected fewer cases of sepsis than actually existed at our participating hospitals. In contrast, because of potential regulatory penalties for coding a stay as sepsis associated when it was not, our approach means that we included fewer cases misclassified as sepsis when sepsis was not present, and our analyses accurately capture the outcomes and resource use of sepsis-associated stays. Introduced in 2002 and 2003, the explicit and specific ICD-9 codes for sepsis used in this study have now been in use for over 10 years (they were introduced in 2002 and 2003), long enough for sepsis coding to have stabilized, and permit replicable analyses. Using these sepsis-specific ICD-9 codes also makes it possible to categorize patients as to the most severe stage of sepsis attained, and indeed, our analyses showed that inpatient death rates and mean costs to payer increased monotonically from Stage 1 (sepsis) (5.9%; $19,997) to Stage 2 (severe sepsis) (17.6%; $39,736) to Stage 3 (septic shock) (36.4%; $51,307). To our knowledge, we are the first to use this staging approach, and confirmation from other studies is needed.
Besides the limitations already pointed out, our study was based on hospital discharge data collected for claims purposes rather than on primary data. While hospitals use many strategies to ensure their claims are accurate and face regulatory penalties if they are not, we did not attempt to verify the accuracy of coding in this study.
At present, most attention seems to be focused on the early recognition and prompt treatment of sepsis in hospitalized patients. However, the findings of our study reinforce the necessity of obtaining much more information about what is happening to patients hospitalized for or with sepsis before they are admitted and, if they survive, after they are discharged.
Footnotes
The project described is supported by Grant Number 1C1CMS330975-01-00 from the Department of Health and Human Services, Centers for Medicare and Medicaid Services.
The contents are solely the responsibility of the authors and do not necessarily represent the official views of US Department of Health and Human Services or any of its agencies.
The authors declare no conflict of interest.
REFERENCES
- 1.Torio CM (AHRQ), Andrews RM (AHRQ). National Inpatient Hospital Costs: The Most Expensive Conditions by Payer, 2011. HCUP Statistical Brief #160. August 2013. Agency for Healthcare Research and Quality, Rockville, MD. Available at: http://www.hcup-us.ahrq.gov/reports/statbriefs/sb160.pdf. Accessed December 29, 2015. [Google Scholar]
- 2.Gaieski DF, Edwards JM, Kallan MJ, et al. Benchmarking the incidence and mortality of severe sepsis in the United States. Crit Care Med. 2013;41:1167–1174. [DOI] [PubMed] [Google Scholar]
- 3.Kumar G, Taneja A, Majumdar T, et al. The association of lacking insurance with outcomes of severe sepsis: retrospective analysis of an administrative database. Crit Care Med. 2014;42:583–591. [DOI] [PMC free article] [PubMed] [Google Scholar]
- 4.Stevenson EK, Rubenstein AR, Radin GT, et al. Two decades of mortality trends among patients with severe sepsis: a comparative meta-analysis. Crit Care Med. 2014;42:625–631. [DOI] [PMC free article] [PubMed] [Google Scholar]
- 5.Elixhauser A, Friedman B, Stranges E. Septicemia in US Hospitals, 2009: Statistical Brief #122 Healthcare Cost and Utilization Project (HCUP) Statistical Briefs. Rockville, MD: Agency for Health Care Policy and Research (US); 2006. [Google Scholar]
- 6.Hall MJ, Williams SN, DeFrances CJ, et al. Inpatient care for septicemia or sepsis: a challenge for patients and hospitals. NCHS Data Brief. 2011;62:1–8, Available at: http://www.cdc.gov/nchs/data/databriefs/db62.pdf. Accessed December 29, 2015. [PubMed] [Google Scholar]
- 7.Wang HE, Donnelly JP, Shapiro NI, et al. Hospital variations in severe sepsis mortality. Am J Med Qual. 2015;30:328–336. [DOI] [PubMed] [Google Scholar]
- 8.Walkey AJ, Wiener RS. Hospital case volume and outcomes among patients hospitalized with severe sepsis. Am J Respir Crit Care Med. 2014;189:548–555. [DOI] [PMC free article] [PubMed] [Google Scholar]
- 9.Casey DE, Jr, Chang K, Bustami RT. Evaluation of hospitalization for infections that are present on admission. Am J Med Qual. 2011;26:468–473. [DOI] [PubMed] [Google Scholar]
- 10.Page D, Donnelly J, Wang H. Community-, healthcare-, and hospital-acquired severe sepsis hospitalizations in the university healthsystem consortium. Crit Care Med. 2015;43:1945–1951. [DOI] [PMC free article] [PubMed] [Google Scholar]
- 11.Liu V, Escobar GJ, Greene JD, et al. Hospital deaths in patients with sepsis from 2 independent cohorts. JAMA. 2014;312:90–92. [DOI] [PubMed] [Google Scholar]
- 12.Jones SL, Ashton CM, Kiehne L, et al. Reductions in sepsis mortality and costs after design and implementation of a nursing-based early recognition and response program. Jt Comm J Qual Patient Saf. 2015;41:483–491. [DOI] [PMC free article] [PubMed] [Google Scholar]
- 13.Jones SL, Ashton CM, Kiehne L, et al. The Sepsis Early Recognition and Response Initiative (SERRI): field notes from a Centers for Medicare and Medicaid Innovation project. Accepted for publication, Jt. Comm J Qual Patient Saf. [DOI] [PMC free article] [PubMed]
- 14.Wray NP, Petersen NJ, Souchek J, et al. The hospital multistay rate as an indicator of quality of care. Health Serv Res. 1999;34:777–790. [PMC free article] [PubMed] [Google Scholar]
- 15.Kaukonen K-M, Bailey M, Pilcher D, et al. Systemic inflammatory response syndrome criteria in defining severe sepsis. N Engl J Med. 2015;372:1629–1638. [DOI] [PubMed] [Google Scholar]
- 16.Horeczko T, Green JP, Panacek EA. Epidemiology of the systemic inflammatory response syndrome (SIRS) in the emergency department. West J Emerg Med. 2014;15:329–336. [DOI] [PMC free article] [PubMed] [Google Scholar]
- 17.Filbin MR, Arias SA, Camargo CA, Jr, et al. Sepsis visits and antibiotic utilization in US emergency departments. Crit Care Med. 2014;42:528–535. [DOI] [PubMed] [Google Scholar]
- 18.Gress J. Sepsis Awareness Research 2014. Nielsen Consumer Insights; 2014Available at: http://www.sepsis.org/files/sepsisawareness2014.pdf. Accessed December 29, 2015. [Google Scholar]
- 19.Muhlstein D. What types of hospitals have high charge-to-reimbursement ratios?: Health Affairs. 2013. Available at: http://healthaffairs.org/blog/2013/07/15/what-types-of-hospitals-have-high-charge-to-reimbursement-ratios/. Accessed December 29, 2015.
- 20.Prescott HC, Langa KM, Liu V, et al. Increased 1-year healthcare use in survivors of severe sepsis. Am J Respir Crit Care Med. 2014;190:62–69. [DOI] [PMC free article] [PubMed] [Google Scholar]
- 21.Hines AL (Truven Health Analytics), Barrett ML (ML Barrett, Inc), Jiang HJ (AHRQ), and Steiner CA (AHRQ). Conditions With the Largest Number of Adult Hospital Readmissions by Payer, 2011. HCUP Statistical Brief #172. April 2014. Agency for Healthcare Research and Quality: Rockville, MD. Available at: http://www.hcup-us.ahrq.gov/reports/statbriefs/sb172-Conditions-Readmissions-Payer.pdf. Accessed December 29, 2015. [Google Scholar]
- 22.Angus DC, Linde-Zwirble WT, Lidicker J, et al. Epidemiology of severe sepsis in the United States: analysis of incidence, outcome, and associated costs of care. Crit Care Med. 2001;29:1303–1310. [DOI] [PubMed] [Google Scholar]