

ABSTRACT
Planctomycete bacteria possess many unusual cellular properties, contributing to a cell plan long considered to be unique among the bacteria. However, data from recent studies are more consistent with a modified Gram-negative cell plan. A key feature of the Gram-negative plan is the presence of an outer membrane (OM), for which lipopolysaccharide (LPS) is a signature molecule. Despite genomic evidence for an OM in planctomycetes, no biochemical verification has been reported. We attempted to detect and characterize LPS in the planctomycete Gemmata obscuriglobus. We obtained direct evidence for LPS and lipid A using electrophoresis and differential staining. Gas chromatography-mass spectrometry (GC-MS) compositional analysis of LPS extracts identified eight different 3-hydroxy fatty acids (3-HOFAs), 2-keto 3-deoxy-d-manno-octulosonic acid (Kdo), glucosamine, and hexose and heptose sugars, a chemical profile unique to Gram-negative LPS. Combined with molecular/structural information collected from matrix-assisted laser desorption ionization–time of flight (MALDI-TOF) MS analysis of putative intact lipid A, these data led us to propose a heterogeneous hexa-acylated lipid A structure (multiple-lipid A species). We also confirmed previous reports of G. obscuriglobus whole-cell fatty acid (FA) and sterol compositions and detected a novel polyunsaturated FA (PUFA). Our confirmation of LPS, and by implication an OM, in G. obscuriglobus raises the possibility that other planctomycetes possess an OM. The pursuit of this question, together with studies of the structural connections between planctomycete LPS and peptidoglycans, will shed more light on what appears to be a planctomycete variation on the Gram-negative cell plan.
IMPORTANCE Bacterial species are classified as Gram positive or negative based on their cell envelope structure. For 25 years, the envelope of planctomycete bacteria has been considered a unique exception, as it lacks peptidoglycan and an outer membrane (OM). However, the very recent detection of peptidoglycan in planctomycete species has provided evidence for a more conventional cell wall and raised questions about other elements of the cell envelope. Here, we report direct evidence of lipopolysaccharide in the planctomycete G. obscuriglobus, suggesting the presence of an OM and supporting the proposal that the planctomycete cell envelope is an extension of the canonical Gram-negative plan. This interpretation features a convoluted cytoplasmic membrane and expanded periplasmic space, the functions of which provide an intriguing avenue for future investigation.
INTRODUCTION
The planctomycete bacterium Gemmata obscuriglobus (1) is of considerable interest to the fields of cell and evolutionary biology due to its uncommon cellular features and evolutionary placement within the Bacteria (2–5). G. obscuriglobus possesses an extensive endomembrane system (6) with superficial eukaryote-like properties, including the presence of membrane coat-like (MC-like) proteins (7), large quantities of sterols (8, 9), a proposed tubulovesicular transport system (7), and endocytosis-like behavior (10). G. obscuriglobus also exhibits an unusually condensed nucleoid (11) and moderate radiation resistance (12). Two recent tomography studies have enabled three-dimensional (3D) reconstruction of the G. obscuriglobus cell (7, 13), with conflicting conclusions about the cell plan. On the basis of two-dimensional imaging, G. obscuriglobus was initially described as having a nucleoid compartment completely enclosed by a double membrane (6, 14, 15), analogous to the eukaryotic nucleus. However, the first tomography analysis did not support the presence of closed cellular compartments and indicated the presence of a continuous cytoplasmic volume (7). Additionally, the endomembrane system was proposed to be an invaginated cytoplasmic membrane rather than a unique additional intracellular membrane, suggesting that the G. obscuriglobus cell plan should be considered a variant of the classical Gram-negative cell plan. In contrast, the second tomography study found closed compartments at certain life cycle stages, and the authors argued that such stage-specific membrane rearrangements would be expected, particularly for nucleoid segregation and transfer to daughter cells (13).
Most recently, the detection of peptidoglycan in the cell wall of planctomycetes, including G. obscuriglobus (16, 17), supports the interpretation of the G. obscuriglobus cell plan as Gram negative. The absence of peptidoglycan and presence of a proteinaceous cell wall (18) had long been distinguishing planctomycete features that led to the proposal of a unique cell plan for all planctomycetes (3, 5, 6, 13, 19). The proteinaceous barrier was previously suggested to substitute for other classical Gram-negative cell features, such as cell surface protection more typically provided by O antigen (20), a rigid structural framework in place of peptidoglycan (13), and possibly as an attachment platform for degradative enzymes, as in a related species, Rhodopirellula baltica (21). The proteinaceous exterior of G. obscuriglobus has not been shown to constitute a surface layer (S-layer), typically composed of only one or two proteins in a lattice configuration, like that found in some other bacteria, including archaea and the planctomycete “Candidatus Kuenenia stuttgartiensis” (13, 22, 23). The original cell wall analysis of G. obscuriglobus by Stackebrandt et al. (18) found the cell wall composition to include many amino acids, and the ability of the G. obscuriglobus cell to maintain its integrity was demonstrated by the finding that cell sacculi retained their native cell morphology after 10% SDS treatment (18), thus exhibiting resistance to SDS that is more like that of cells that have a peptidoglycan-containing murein sacculus (21). Despite that resistance ability, the cell wall of G. obscuriglobus was actually found in that study not to contain muramic acid and diaminopimelic acid, which are considered peptidoglycan markers (18). The G. obscuriglobus cell also stains as a Gram-negative bacterium (1). However, G. obscuriglobus cell wall characteristics have not appeared to exhibit a classical Gram-negative cell composition, exemplified by Escherichia coli as a prototype. Most typically, such a classical Gram-negative cell envelope arrangement includes an inner membrane (IM) and a periplasmic space containing peptidoglycan tethered to lipoproteins of an outer membrane (OM), the exterior layer of which holds lipid A linked to oligosaccharides (13, 24).
OM synthesis and the retention of integral outer membrane proteins (OMPs) in classical Gram-negative bacteria are typically achieved by two major pathways, that of the very conserved integral OMP insertion complex, β-barrel assembly machinery (BAM) (25), and the lipopolysaccharide (LPS) insertion complex (20), represented primarily by the large subunit LptD, OstA, or Imp and by LpxC, which catalyzes a major step in lipid A synthesis. Other genes contributing to synthesis of OM features include those of the O antigen (O-Ag) gene cluster. A particularly prominent component of the outer leaflet of the OM in Gram-negative bacteria is the semirigid LPS (26, 27), which is composed of glycolipids that cover a major proportion of the cell surface (24), providing a barrier to protect the cell from the environment (28, 29). The general architecture of LPS includes three distinct regions: lipid A, core oligosaccharides, and O antigen (28, 30–32). Lipid A is a unique carbohydrate-lipid, typically a (β-1,6)-d-glucosamine (GlcN) disaccharide linked to a varied number of fatty acids (FAs) and hydroxy-FAs (HOFAs) (30, 33, 34), and it is anchored by its lipophilic domain in the OM lipid bilayer (27). A second LPS region, the core oligosaccharide, typically holds the characteristic component 2-keto 3-deoxy-d-manno-octulosonate (Kdo) or, less typically, d-glycero-d-talo-2-octulopyranosonic acid (Ko) (30, 35). Every LPS characterized to date has been shown to contain either Kdo or Ko (31, 34). The inner and outer core oligosaccharides can be composed of up to 15 sugar moieties (31), with the outer core usually consisting of hexoses and hexosamines (30, 31) and the inner core usually holding one to three Kdo and two or three specific heptoses (30, 35). Finally, the third LPS region, the O-Ag repeat, a repetitive glycan structure of varied length, is not present in all organisms that carry an LPS (28, 36).
There is extensive component variety within this general LPS structural organization, with each organism displaying specific modifications (24, 28, 30, 31, 33, 36–38). Moreover, the inherent chemical heterogeneity of a particular LPS, derived from the interconnection of its three very different regions, makes it challenging to isolate and characterize (33, 38, 39). Beyond this, structural variations can also occur within the LPS of the same organism (39). Regardless of the huge variations possible in LPS structure, the identification of lipid A, its characteristic disaccharide, and 3-HOFAs, and Kdo or Ko, representing the core oligosaccharide, are strong indications for the presence of an LPS in a particular organism.
A previous study (40) that detected LPS in Planctomyces and Pirellula species gave the first indication of possible OM features within the planctomycetes. Rare glycolipids were found, apparently of LPS origin, that contained a unique HOFA pattern with major proportions of long-chain normal 3-HOFAs, specifically 3-OH eicosanoic (3-OH C20:0), and normal FAs. The results of this study prompted Kerger and associates (40) to propose 3-OH C20:0 as a potential signature FA of Planctomycetales LPS and concluded that their FA composition and LPS demonstrated that these strains had some similarities with classical Gram-negative eubacteria. A subsequent study (41) inventoried whole-cell FAs for a variety of organisms, with preliminary findings of eight different 3-HOFAs in G. obscuriglobus specifically, with an FA distribution of 82% normal and 18% unsaturated.
Intriguing hints that components of an OM structure may be present in G. obscuriglobus have also been discovered through genomic analyses, including the prediction of a 60-kDa OMP in all planctomycetes and in no other prokaryotes (42). Although sequencing of the G. obscuriglobus genome is incomplete, additional G. obscuriglobus-specific genomic OM evidence has been collected. Speth and colleagues (20) utilized the prediction tool Beta-Barrel Outer Membrane Protein Predictor (BOMP) and found 95 predicted OMPs in G. obscuriglobus, with only five of these having a BLAST hit to a known OMP, suggesting a highly unusual OMP composition. Remarkably, the major OM markers for LPS insertion (LptD) and OMP assembly (BamA) were identified in the G. obscuriglobus genome (20), despite the general thought that G. obscuriglobus does not have the capability to produce either of these cell features. G. obscuriglobus also possesses the key LPS biosynthetic genes LpxB and LpxC as well as KdsA, which adds specific moieties to the Kdo structure (25). Although O-antigen biosynthesis genes have not yet been reported for G. obscuriglobus, a search of its draft sequence via the Joint Genome Institute/Integrated Microbial Genomes (JGI/IMG) does indicate putative O antigen-related candidate genes, including one preliminarily annotated as an O-Ag polymerase (data not shown) of the “lipid A core–O-Ag ligase and related enzymes” grouping within the COG3307 category of cell wall/membrane/envelope biogenesis.
However, despite the expanding list of genomic data suggesting the existence of an OM in G. obscuriglobus, no OM gene products have been isolated, recovered for proteomic identification (13), or localized to the cell wall of G. obscuriglobus. Here, we attempt to describe LPS as part of an OM signature in G. obscuriglobus. We isolated LPS and detected and characterized its key components, including lipid A, its fatty acid constituents, and the disaccharide Kdo, as evidence for the presence of an OM. This was carried out by biochemical and differential staining approaches to enable the isolation of G. obscuriglobus LPS and lipid A, followed by gas chromatography-mass spectrometry (GC-MS), GC-tandem MS (GC-MS/MS) to obtain FA and carbohydrate composition (bottom-up), and matrix-assisted laser desorption ionization–time of flight (MALDI-TOF) MS analyses to determine molecular weight (MW) and structural information (top-down). This work resulted in the isolation and characterization of the LPS and lipid A unique to this bacterium and represents the first experimental confirmation that features usually associated with the OM are present in G. obscuriglobus.
MATERIALS AND METHODS
General methods. (i) Bacterial strains and LPS standard.
G. obscuriglobus DSM 5831T was obtained from the Leibniz-Institute Deutsche Sammlung von Mikroorganismen und Zellkulturen (DSMZ; German Collection of Microorganisms and Cell Cultures, Braunschweig, Germany), and E. coli UCLA 1246 was obtained from Erin Sander (University of California, Los Angeles [UCLA], CA). Liquid or solid DSMZ 629 Staley's maintenance medium was prepared as described on the DSMZ website (http://www.dsmz.de). G. obscuriglobus cells were grown at 30°C for 6 to 13 days on solid or in liquid 629 medium with shaking at 200 rpm. E. coli UCLA 1246 cells were grown overnight at 37°C on solid or in liquid lysogeny broth-Miller (LB-Miller) medium with shaking at 300 rpm. Purified lipopolysaccharide (LPS) standard (catalog no. L2630), derived from E. coli strain 0111:B4, was purchased from Sigma-Aldrich, St. Louis, MO.
(ii) Criteria for analysis of G. obscuriglobus culture purity.
Liquid G. obscuriglobus cultures prepared for lyophilization in this study were inoculated from liquid starter cultures of a smaller volume. These starter cultures represented 1 to 2% of the final scaled-up culture volume and were initially inoculated with colonies from solid agar plates. These solid agar cultures were in turn originally inoculated from our −80°C freezer maintenance stock of G. obscuriglobus. To confirm culture purity, the following processes were used: single-colony isolation to analyze colony morphology and growth rate on solid agar plates, phase-contrast microscopy to examine cell morphology in wet mounts of plate colonies and liquid culture aliquots, and 16S rRNA gene sequencing of DNA derived from lyophilized cell stocks used in this study.
(iii) DNA extraction, PCR amplification, and sequencing of 16S rRNA genes.
To further confirm the purity of the stocks from which lyophilized cells were derived, 16S rRNA gene sequences were recovered and analyzed from DNA extracted from these experimental stocks. Phosphate-buffered saline (PBS)-washed lyophilized G. obscuriglobus cells were rehydrated in sterile nuclease-free distilled water (dH2O) for DNA extraction via the PowerSoil DNA extraction method (catalog no. 12888-50; Mo Bio), per the manufacturer's instructions. DNA recovered was eluted in sterile nuclease-free dH2O and frozen at −20°C.
PCR amplification of the 16S rRNA gene was completed in a 50-μl reaction mixture, utilizing 1.25 U of Taq DNA polymerase (catalog no. M0273S; NEB), 200 μM deoxynucleoside triphosphate (dNTP) solution mixture (catalog no. N0447S; NEB), 9.4, 10.4, and 10.8 ng of G. obscuriglobus DNA template, and a 0.2 μM concentration of the 27F and 1492R 16S rRNA primers (Integrated DNA Technologies [IDT]). The 27F primer sequence was 5′-AGAGTTTGATCMTGGCTCAG-3′, with a melting temperature (Tm) of 53.2°C, and the 1492R sequence was 5′-CGGTTACCTTGTTACGACTT-3′, with a Tm of 52.3°C. Amplification was carried out in a Bio-Rad T-100 thermal cycler with reaction conditions as follows: initial denaturation at 95°C for 2 min, followed by 30 cycles incorporating a 30-s denaturation (95°C), 1 min at annealing temperature (49.8°C), and a 1.5-min extension (72°C). The reaction was completed by a final 5-min extension (72°C), and the reaction mixtures were maintained for 30 min at 10°C and then frozen at −20°C. Ten microliters of each PCR product was combined with 2 μl of NEB 6× loading dye (catalog no. B7021S) and loaded onto a 0.8% agarose–Tris-acetate-EDTA (TAE) gel for electrophoresis at 60 V for 1 h. The recovered PCR mixtures were purified using the QIAquick PCR purification kit (catalog no. 28104; Qiagen), per the manufacturer's instructions. The purified PCR products were eluted in nuclease-free dH2O, and concentrations were determined using a NanoDrop spectrophotometer. The purified PCR products were sequenced by Sequetech (Mountain View, CA) using a 519R internal 16S rRNA primer (IDT) with the sequence 5′-GWATTACCGCGGCKGCTG-3′, with a Tm of 58.1°C.
(iv) Reagents and supplies.
Sodium acetate (catalog no. RGC-5260), 10× Tris-glycine SDS buffer (catalog no. RGF-3390), 1 M Tris-HCl (pH 7.5) (catalog no. RGF-3350), 10% SDS (catalog no. RGE-3230), and phosphate-buffered saline (pH 7.4) (catalog no. RGF-3210) were purchased from KD Medical, Columbia, MD. Acetic acid (catalog no. A6283), hydrochloric acid (catalog no. H1758), chloroform (catalog no. C2432), Tri Reagent (catalog no. T9424), isobutyric acid (catalog no. I1754), and biotechnology-grade methanol (catalog no. 494437-16) were obtained from Sigma-Aldrich. Other reagents included ammonium hydroxide from Fluka (catalog no. 09859); biotechnology-grade glycerol (catalog no. 0854-14), proteomic-grade bromphenol blue sodium salt (catalog no. M116), and magnesium chloride hexahydrate (catalog no. 0288) from Amresco, Solon, OH; ethanol (catalog no. 111ACS200) from Pharmco-AAPER, Brookfield, CO; SDS (catalog no. BP166) from Thermo Fisher Scientific, Waltham, MA; sterile deionized water from Integrated DNA Technologies, Coralville, IA, and ISC BioExpress, Kaysville, UT (GeneMate G-3250); and LB agar (L9110) and LB broth (L9135) from Teknova, Hollister, CA. Dialysis tubing (3500 MWCO Spectra/Por 3 membrane; catalog no. 132720) was from Spectrum Medical Industries, Laguna Hills, CA.
(v) Preparation and lyophilization of whole bacterial cells.
Aliquots from each liquid culture flask were examined by phase-contrast microscopy (Olympus BX41; Olympus, Center Valley, NJ) to ensure culture purity. The remaining culture volumes from these G. obscuriglobus or E. coli liquid cultures were transferred to multiple 250-ml sterile centrifuge bottles and centrifuged (13,847 × g for 20 min at 16°C in a precooled Beckman JA14 rotor; Beckman J2-21M induction drive centrifuge; Beckman Coulter, Indianapolis, IN) to recover whole-cell pellets.
The original liquid culture volumes per flask for G. obscuriglobus were as follows: 3 vials of 1.5 ml, 7 of 12 ml, and 1 of 110 ml for a 198-ml total preparation; 101 ml, 198 ml, 300 ml, and 600 ml, for a 1,198-ml total preparation; 2 of 102 ml, 2 of 150 ml, 153 ml, 3 of 306 ml, and 511 ml for a 2,086-ml total preparation.
The original liquid culture volumes per flask for E. coli were as follows: 5 of 506 ml, 512 ml, and 1,015 ml for a 4,057-ml total preparation; and 1,000 ml for a 1,000-ml total preparation.
Pellets from G. obscuriglobus or E. coli were combined and washed with 100 to 200 ml of PBS by resuspension and further centrifugation, which was repeated 3 or 4 times. The pellets were resuspended in 100 to 200 ml of sterile dH2O, and cells were harvested again by centrifugation (13,847 × g for 20 min in Beckman JA14 rotor) two times. The PBS-dH2O-washed cell pellets were resuspended in 4 to 5 ml of sterile dH2O, transferred to fresh vials, frozen via liquid nitrogen, and lyophilized at −48°C and 2.4 Pa for 24 h (FreeZone 6 freeze-dry system; Labconco, Kansas City, MO).
The recovered lyophilized G. obscuriglobus cell quantities were 132 mg from the 198-ml preparation, 218 mg from the 1,198-ml preparation, and 350 mg from the 2,086-ml preparation. The recovered lyophilized E. coli cell quantities were 669 mg from the 1,000-ml preparation and 2,470 mg from the 4,057-ml preparation. The purity of recovered lyophilized G. obscuriglobus cells used in this study was confirmed by 16S rRNA gene sequencing of DNA extracted from these lyophilized experimental cell stocks, as described above.
(vi) Extraction and purification of LPS from whole bacterial cells.
Crude LPS was extracted from washed lyophilized cells by a modification of the Tri-Reagent method of Yi and Hackett (43) and performed at room temperature using a Beckman Coulter Microfuge 18 centrifuge with F241.5P rotor. The recovered products were dialyzed extensively versus dH2O and lyophilized using a FreeZone 6 freeze-dry system (Labconco). Crude LPS was purified by cold ethanol magnesium precipitation, based on a method described by Yi and Hackett (43). The details of these procedures are provided in the methods in the supplemental material.
(vii) Lipid A isolation by two approaches.
Lipid A was released from purified LPS by modification of the mild acid hydrolysis method of Yi and Hackett (43). An alternative method for lipid A isolation was based on the method of El Hamidi et al. (44) and enabled lipid A extraction directly from whole cells, rather than from purified LPS. Details of both lipid A isolation approaches are provided in the methods in the supplemental material. The Sigma LPS standard (catalog no. L2630) served as an extra control, in addition to E. coli cells, for lipid A extraction by this direct method.
(viii) SDS-PAGE and differential staining of LPS and lipid A extracts.
Samples were solubilized in 2× Laemmli sample buffer (62.5 mM Tris-HCl [pH 6.7], 2% SDS, 25% glycerol, 0.8% bromophenol blue [BPB]), boiled for 5 min, centrifuged (13,000 × g for 10 s at room temperature; Beckman Coulter Microfuge 18 centrifuge with F241.5P rotor), applied to a 4 to 20% gradient SDS-PAGE gel (Mini-Protean TGX, catalog no. 456-1094; Bio-Rad, Hercules, CA), and resolved by electrophoresis in 1× Tris-glycine SDS running buffer at 200 V for 33 min. The molecular weight (MW) markers, PageRuler Plus prestained protein ladder (catalog no. 26619; Thermo Scientific), Fermentas Spectra multicolor low-range protein ladder (catalog no. H266; Thermo Scientific), and CandyCane glycoprotein molecular weight standard (catalog no. C21852; Molecular Probes) were prepared and loaded onto the gel per the manufacturers' instructions. The gels were stained using Pro-Q Emerald 300 glycoprotein gel stain with Sypro Ruby protein stain (catalog no. P21855; Molecular Probes) and silver stain (catalog no. 24612; Pierce silver stain kit; Thermo Scientific), according to the manufacturers' protocols. The stained gels were visualized by white light or a 300-nm UV transilluminator (Bio-Rad GelDoc 1000) to measure fluorescence.
(ix) GC-MS.
Full-scan GC-MS analyses were performed with a gas chromatograph (model Trace) mass spectrometer (model DSQ-II; both from Thermo, Austin, TX). A 30-m (0.25-mm internal diameter by 0.25-μm-thick film), fused-silica DB-5 equivalent column (ZB-5; Phenomenex, Torrance, CA) was used for all chromatographic separations. Helium carrier gas was set at a constant flow rate of 1.0 ml/min. The gas chromatography conditions used for the separation of each particular metabolite group are listed in Table S1 in the supplemental material.
C4:0 to C24:0 straight-chain even-carbon and 3OH C14:0 to 3OH C18:0 straight-chain standard fatty acid methyl ester (FAME) mixtures were used to calculate the retention index (RI) for confirmatory identifications of saturated FAs present in the sample; the details of these calculations are provided in the methods in the supplemental material. Figure S1 in the supplemental material shows equivalent chain length (ECL), a parameter analogous to RI in the case of FAMEs, as a function of retention time (RT) for 3-HOFAs.
The MS was operated in the positive electron ionization (EI+) mode with an electron energy of −70 eV and emission current of 100 μA. The quadrupole mass analyzer was scanned at a rate of 4.5 scans/s in the range of m/z 50 to 550. The ion source was kept at 250°C, and a 4-min solvent delay was used. Chromatograms and mass spectra were collected with the Xcalibur software (version 2.0.7; Thermo Fisher Scientific). For MS measurements in the positive-ion chemical ionization (PICI) mode, methane was used as the reagent gas. The reagent gas flow (1 ml/min), emission current (25 μA), and electron energy (100 eV) were all optimized with a cis-docosahexaenoic acid methyl ester (DHA-ME) standard.
(v) GC-MS/MS.
Tandem mass spectral analyses were carried out with a gas chromatograph–triple-quadrupole mass spectrometer (Trace GC and TSQ7000, respectively; Finnigan, Austin, TX). Both product ion scans (MS/MS) and selected reaction monitoring (SRM) scans were conducted. The GC was fitted with a DB-5 equivalent column (ZB-5, 30 m by 0.25 mm by 0.25 μm; Phenomenex, Torrance, CA) and under the separation conditions listed in Table S1 in the supplemental material. Full-scan MS analyses followed by MS/MS modes, such as product ions, precursor ions, and neutral loss scans, were performed using argon gas as the collision gas. Tandem MS (MS/MS and SRM) parameters were optimized with perfluorotributylamine (PFTBA), with a collision-induced dissociation (CID) pressure of 1.0 mTorr, CID voltage of 15 V, and data acquisition rate of 0.4 scans/s (5 data points in 2 s). All other ionization parameters were as stated above.
Methods for global lipid analysis. (i) Reagents and supplies.
High-performance liquid chromatography (HPLC)-grade chloroform, hexane, and methanol were purchased from Fisher Chemical (Pittsburgh, PA). HPLC-grade water was obtained from Burdick & Jackson (Muskegon, MI). An even-carbon C4:0-C24:0 saturated FAME mixture (catalog no. 49453-U), cis-4,7,10,13,16,19-docosahexaenoic acid (DHA) (catalog no. D2534), acetyl chloride (catalog no. 00990), lanosterol (catalog no. L5768), N-methyl-N-(trimethylsilyl)trifluoroacetamide (MSTFA; catalog no. M7891), and trimethylchlorosilane (TMCS; catalog no. 92360) were purchased from Supelco (St. Louis, MO). All solvents and reagents were used without further purification.
(ii) Lipid extraction and derivatization.
Lyophilized G. obscuriglobus cells were subjected to a modified Bligh-Dyer extraction (described in detail in the methods in the supplemental material under “Lipid extraction from whole bacterial cells”), followed by a two-step derivatization procedure. Control lyophilized E. coli cells and a reagent blank containing Bligh-Dyer solvent only were processed using the same protocol.
A two-step process, methyl esterification of the carboxylate groups followed by silylation of hydroxyl groups, was used for the complete derivatization of all lipid functional groups prior to GC-MS and MS/MS analyses. A modified method of Schultz and Pugh (45) was used to carry out microwave-assisted methyl esterification using methanolic hydrochloride. Briefly, dried lipid extract was mixed with 200 μl of methanol and 40 μl of acetyl chloride (∼4 M methanolic hydrochloride), N2 gas was added to the reaction mixture vial to avoid potential oxidation of lipids, and the sealed vial was irradiated with microwave radiation with optimized power of 50 W, maximum temperature set at 70°C, and irradiation time of 3 min. Derivatization was performed using a software-controlled analytical microwave oven (Synergy software; CEM-Discover, Matthews, NC). The reaction mixture was neutralized with 6% (wt/vol) Na2CO3 solution (aqueous [aq]) and extracted with two volumes of 500 μl of hexane by liquid-liquid extraction (LLE). Hexane was evaporated in a SpeedVac (Thermo Fisher Scientific) (at room temperature for the organic phase and at 40°C for the aqueous phase) to make a final volume of 100 μl, and 1 μl of this sample was used for GC-MS analysis. Because methylation with methanolic hydrochloride is ineffective for the derivatization of hydroxyl functional groups, the second derivatization step of silylation, to produce trimethylsilyl (TMS) derivatives, was used to derivatize 3-HO FAMEs and sterols. An aliquot of 50 μl of methyl-esterified sample from the previous step was dried under a N2 gas stream and resuspended in 30 μl of MSTFA containing 1% (vol/vol) TMCS. The solution was then heated in an oven at 70°C for 20 min, and the derivatization reagent was evaporated in a SpeedVac. The sample was redissolved in 50 μl of hexane, and 1 μl was injected for GC-MS analyses.
Methods for targeted analysis of LPS composition. (i) Reagents and supplies.
Lipopolysaccharide (E. coli O111:B4), Kdo ammonium salt, d-glucose, d-galactose, d-mannoheptose, d-glucoheptose, and glucosamine standards were purchased from Sigma-Aldrich (St. Louis, MO). The 3-HOFA standards C14:0, C16:0, C17:0, and C18:0 were purchased from Matreya LLC (Pleasant Gap, PA), and C15:0 was purchased from Larodan (Malmö, Sweden). Pyridine and acetic anhydride for acetylation were also purchased from Sigma-Aldrich. Descriptions of the solvents and other reagents are provided above (see “Methods for global lipid analyses”). All solvents, reagents, and standards were used without further purification.
(ii) FA compositional analysis of LPS and lipid A compared to whole-cell FAs.
A microwave-assisted two-step derivatization method (methylation/esterification followed by silylation) was used for FA compositional analysis of LPS and lipid A samples, as described above (see “Lipid extraction and derivatization”). Initial methylation was performed on ∼2 mg of LPS and 2 mg of lipid A. The method described by Komagata and Suzuki (46) was used in the extraction of total 3-HOFAs from whole cells, as described in the methods in the supplemental material (see “Direct extraction and analysis of 3-HOFAs from whole cells”). Methylated-silylated 3-HOFAs, under EI+ conditions, yield ions at m/z 175 and 133 and a neutral with mass 42 atomic mass units (u), and these ions/transitions were chosen for product ion, precursor ion, and neutral loss MS/MS measurements, respectively. In addition, SRM measurements monitoring the transition from the ion at m/z 175 (diagnostic ion for TMS derivatives of 3-HO FAMEs) to m/z 133 was used as the confirmatory identification for 3-HOFAs.
(iii) Analysis of Kdo and other carbohydrates in LPS.
A two-step hydrolysis and derivatization method, methylation followed by peracetylation, was applied. This was carried out using a modified method of Rybka and Gamian (47) described in further detail in the methods in the supplemental material (see “Derivatization of LPS for detection of Kdo and other sugars”). Kdo ammonium salt and sugar standards were processed in the same way and used for confirmatory identifications of these compounds in G. obscuriglobus LPS when analyzed by GC-MS.
Methods for determination of lipid A structure. (i) Reagents and supplies.
Methanol, the MALDI-TOF MS matrix 5-chloro-2-mercaptobenzothiazole (CMBT), and mass calibration reagents, such as angiotensin I, angiotensin II, and neurotensin adrenocorticotropin (ACTH) clip (1-17), were purchased from Sigma-Aldrich (St. Louis, MO); the suppliers of the other reagents are described above (see “Methods for global lipid analysis”). All solvents, reagents, and matrices were used without further purification.
(ii) Deacylation of lipid A.
Lipid A samples were subjected to two different deacylation approaches prior to MALDI-TOF MS analysis. In the first procedure, partial de-O-acylation was performed as described by Silipo et al. (48). Briefly, approximately 1 mg of lipid A was mixed with 200 μl of diluted ammonia (1:3 NH4OH-H2O) and left at room temperature for 16 h (alternatively, 0.25 M aqueous NaOH at 37°C for 15 min gives the equivalent result). This hydrolysis selectively eliminates O-linked acyl chains, such as 3-acyloxyacyl and FA chains. In the second procedure, partial deacylation was carried out by mixing approximately 1 mg of lipid A with 200 μl of concentrated ammonia and incubating at room temperature for 16 h. Concentrated NH4OH completely eliminates O-linked acyl chains and secondary FA residues in the N-linked acyl chains. The primary FA residues in the N-acyl chains are unaffected. In both cases, ammonia was evaporated under a N2 gas stream.
(iii) MALDI-TOF MS instrumentation and lipid A sample preparation.
MALDI-TOF MS measurements were performed on both intact lipid A standards and lipid A samples that had been subjected to deacylation reactions (described above). Intact and partially deacylated lipid A samples were mixed with a 4:4:1 mixture of chloroform-methanol-water to make a solution of approximately 1 mg/ml. A fresh solution of CMBT MALDI-TOF MS matrix (20 mg/ml) was prepared in the same solvent mixture. The lipid A and matrix solutions were premixed in a 1:1 ratio (vol/vol), and an aliquot of 1 μl of the sample-matrix solution was deposited onto a stainless steel target. Analyses were carried out using a MALDI-TOF-MS (model Voyager DE-STR; Applied Biosystems) equipped with a 337-nm N2 laser in the negative-ion mode. An acceleration voltage of 20 kV was used in the delayed-extraction (500 ns) reflector mode. The laser intensity was optimized to 10 to 20% above the ionization threshold intensity. The low mass gate was set at m/z 700. The final mass spectra obtained were the average of 50 laser shots/spot from 10 different and random locations (or spots) within a deposited sample (i.e., a total of 500 laser shots/spectrum). A mixture (20 ppm each) of angiotensin II (C50H71N13O12; monoisotopic [m.i.] exact mass, 1,045.5345 u; deprotonated m.i. mass, 1,044.5272 u), angiotensin I (C62H89N17O14; m.i. mass, 1,295.6774 u; deprotonated m.i. mass, 1,294.6701 u), and neurotensin ACTH clip 1-17 (C78H121N21O20; m.i. mass, 1,671.9096 u; deprotonated m.i. mass, 1,670.9023 u), treated and analyzed in the same way, was used as an external mass calibrant.
RESULTS
Analysis of G. obscuriglobus experimental cultures and lyophilized cell stock purity.
In addition to phase-contrast microscopy examination of cells from the liquid cultures prepared for lyophilization in this study, plate colonies, from which liquid cultures were inoculated, were previously streaked to isolate single colonies and were examined carefully for plate growth rate and morphology, both of which were consistent with typical G. obscuriglobus characteristics. No contaminating colonies of different morphology or growth rate were found. Likewise, when wet mounts of representative cells from these plate colonies were examined using phase-contrast microscopy, the cells also exhibited typical G. obscuriglobus cell characteristics.
To further confirm the purity of the stocks from which lyophilized cells were derived, 16S rRNA gene sequences were recovered from DNA extracted from these experimental stocks. Following PCR amplification with 16S rRNA universal primers, bands of the appropriate size of ∼1.5 kb for the 16S rRNA gene product were detected, compared to migration of a NEB 1-kb molecular weight marker (MWM) (catalog no. N3232S; NEB). The no-template and extraction blank PCR mixtures showed no PCR product. Sequence chromatograms for each of the three independent sequencing reactions showed a high signal-to-noise ratio, with clean peaks and no evidence of contaminating signal. The DNA sequences were compared to all partial and complete genome sequences of bacteria in the JGI/IMG genome database via a blastn search, and each of the sequence comparisons returned 100% identity to G. obscuriglobus. Thus, the purity of these lyophilized experimental cultures was confirmed.
Global lipid analysis. (i) FAs.
Tentative identifications of all Bligh-Dyer-extractable FAs from G. obscuriglobus were made by a comparison of the FAME mass spectrum to that of standard FAMEs in the National Institute of Standards and Technology (NIST) 08 Standard Reference Database 1A or the American Oil Chemists' Society (AOCS) Lipid Library Archives of Mass Spectra (Lipid Library) and by a comparison of ECLs (see Fig. S2c in the supplemental material). G. obscuriglobus was shown to possess both saturated and unsaturated FAs in the range C14 to C22 (Table 1; see Fig. S2a and b in the supplemental material), with C18:0 being the most abundant FA, followed by C16:1. Global GC-MS analysis of the Bligh-Dyer-extractable fractions from G. obscuriglobus showed 69.6% ± 4.7% saturated FAs and 30.4% ± 4.7% unsaturated FAs, in contrast to the dominance of unsaturated FAs in E. coli (65.5% ± 5.1% unsaturated, 34.5% ± 5.1% saturated) (data not shown).
TABLE 1.
List of identified FAs in Bligh-Dyer extracts of lyophilized G. obscuriglobus cells
| RT (min)a | ECL (calculated)b | ID from MSc | ID from ECL | Final IDd | Qualifier ionse |
|---|---|---|---|---|---|
| 9.32 | 14.05 | C14:0 | C14:0 | C14:0 | M+· 242, 213, 211, 199, 87, 74* |
| 9.78 | 14.72 | C15:0 | methyl-C14:0 | Iso-C15:0 | M+· 256, 227, 229, 199, 87, 74* |
| 10.01 | 15.06 | C15:1 | C15:1 | C15:1 | M+· 254, 222, 97, 87, 74, 69, 55* |
| 10.04 | 15.11 | C15:0 | C15:0 | C15:0 | M+· 256, 227, 229, 199, 87, 74* |
| 10.69 | 16.06 | C16:1 | C16:1 | C16:1 | M+· 268, 236, 97, 87, 74, 69, 55* |
| 10.73 | 16.12 | C16:0 | C16:0 | C16:0 | M+· 270, 241, 239, 199, 87, 74* |
| 11.14 | 16.73 | C17:0 | methyl-C16:0 | Iso-C17:0 | M+· 284, 255, 253, 199, 87, 74* |
| 11.21 | 16.83 | C17:0 | methyl-C16:0 | Anteiso-C17:0 | M+· 284, 255, 253, 199, 87, 74* |
| 11.29 | 16.95 | C17:1 | C17:1 | C17:1 | M+· 282, 250, 97, 87, 74, 69, 55* |
| 11.39 | 17.10 | C17:0 | C17:0 | C17:0 | M+· 284, 255, 253, 199, 87, 74* |
| 11.90 | 17.85 | C18:1 | C18:1 | C18:1 | M+· 296, 264, 97, 87, 74, 69, 55* |
| 11.97 | 17.95 | C18:1 | C18:1 | C18:1 | M+· 296, 264, 97, 87, 74, 69, 55* |
| 12.02 | 18.02 | C18:0 | C18:0 | C18:0 | M+· 298, 269, 267, 199, 87, 74* |
| 12.39 | 18.57 | C19:0 | methyl-C18:0 | Iso-C19:0 | M+· 312, 283, 281, 199, 87, 74* |
| 12.45 | 18.66 | C19:0 | methyl-C18:0 | Anteiso-C19:0 | M+· 312, 283, 281, 199, 87, 74* |
| 12.61 | 18.89 | C19:0 | C19:0 | C19:0 | M+· 312, 283, 281, 199, 87, 74* |
| 13.08 | 19.59 | C20:1 | C20:1 | C20:1 | M+· 324, 292, 97, 87, 74, 69, 55* |
| 13.14 | 19.67 | C20:1 | C20:1 | C20:1 | M+· 324, 292, 97, 87, 74, 69, 55* |
| 13.18 | 20.19 | C20:0 | C20:0 | C20:0 | M+· 326, 297, 295, 199, 87, 74* |
| 13.73 | 21.02 | C21:0 | C21:0 | C21:0 | M+· 340, 311, 309, 199, 87, 74* |
| 14.15 | 21.65 | C22:1 | C22:1 | C22:1 | M+· 352, 320, 97, 87, 74, 69, 55* |
| 14.26 | 21.82 | C22:0 | C22:0 | C22:0 | M+· 354, 325, 323, 199, 87, 74* |
RT, retention time.
ECL, equivalent chain length.
ID, identification.
Consensus ID from ECL and MS.
Here, M+· is the molecular ion peak, and the m/z value marked with an asterisk indicates the base peak in the mass spectrum.
Several isomers of the monounsaturated FAs C16:1 and C18:1 were detected; however, no additional measurements were conducted to establish the location or stereochemistry of the double bonds in these positional isomers. In addition, GC-MS analyses of G. obscuriglobus determined the presence of methyl-branched iso- and anteiso-FAs, with signals at retention times (RT) of 11.14 and 11.20 min (see Fig. S3a in the supplemental material), through combined analysis of RI data (49), a comparison of their mass spectra with those of the unbranched FA, and the reference mass spectra in published databases (NIST mass spectral database and the AOCS Lipid Library) (Table 1; see also Fig. S3a).
(ii) PUFA.
A PUFA was tentatively identified in G. obscuriglobus Bligh-Dyer-extracted FAMEs by the mass spectral fragmentation pattern at an RT of 16.70 min in the chromatogram (Fig. 1). Analyses of a G. obscuriglobus sample by GC-MS in both EI and PICI modes, with DHA-ME as the reference compound, suggested that this signal corresponds to the PUFA heptacosatrienoic (ω3 C27:3) acid.
FIG 1.

EI mass spectrum of an unknown PUFA in G. obscuriglobus, with an RT of 16.70 min, showing m/z 108 as the diagnostic ion (ω) of ω3 PUFAs and tropylium ion (*) at m/z 91 as the base peak. The mass spectrum in the inset is of DHA-methyl ester, with an RT of 13.90 min, showing both ions. NL, neutral loss.
(iii) 3-HOFAs.
After silylation, the premethylated Bligh-Dyer extract of G. obscuriglobus cells showed multiple 3-HOFAs in the GC-MS-extracted ion chromatogram (XIC) of m/z 175 (see Fig. S4a in the supplemental material). The identification of 3-HOFAs in G. obscuriglobus was made by comparison to chromatogram RI and mass spectral data obtained for a mixture of silylated 3-HOFA-ME standards in the range C14 to C18. Assuming equal ionization and detection sensitivity, 3-OH C15:0 and C17:0 were present in highest abundance.
(iv) Sterols.
As reported previously (8), we detected the presence of two C30 sterols, lanosterol and parkeol, identified through a comparison with the TMS derivative of the lanosterol standard (data not shown). A comparison of the available mass spectra (NIST mass spectral database and the AOCS Lipid Library and published articles) for TMS derivatives of several possible lanosterol and parkeol isomers suggested that the two early-eluting peaks in the G. obscuriglobus sample, at retention times of 24.11 and 24.17 min (see Fig. S5 in the supplemental material), may represent isoarborinol isomers.
Detection of LPS and lipid A by differential staining and SDS-PAGE. (i) Evidence for appropriate LPS and lipid A extraction and staining protocols.
Because, to the best of our knowledge, LPS and lipid A protocols had not been applied to G. obscuriglobus, we performed the same lipid A extraction, staining, and electrophoresis methods on a commercial E. coli (strain 0111:B4) LPS standard, which thus served as a reference compound. The E. coli commercial LPS standard and the lipid A preparations derived from it showed banding patterns in differentially stained gels (Fig. 2, lane 1, lipid A, and lane 2, LPS), which were consistent with previously published information (50–53) for E. coli strain 0111:B4. Presumed LPS and lipid A preparations from G. obscuriglobus displayed increasing refinement through the extraction and purification strategy (Fig. 2A, lanes 3 to 6), with a loss of higher-MW bands in the G. obscuriglobus lipid A samples (Fig. 2, lanes 5 and 6), compared to the corresponding crude and purified LPS (Fig. 2, lanes 3 and 4, respectively), suggesting successful lipid A enrichment. The noticeably evident major band at ∼5 kDa in the Sypro Ruby-stained gel (Fig. 2, lanes 1, 5, and 6), appearing in both E. coli and G. obscuriglobus lipid A preparations, is consistent with enriched lipid A after hydrolysis from LPS. The residual higher (40 to 90 kDa)-molecular-mass bands in E. coli lipid A (Fig. 2A, lane 1) may be relatively more resistant to the acid hydrolysis that liberates lipid A, as has been reported for longer polysaccharide chains (Sigma L2630 LPS product information). All three stains appropriately detected MW markers, with silver and Sypro Ruby stains detecting eight CandyCane glycosylated protein marker (CM) bands (Fig. 2A and C, respectively, lane CM) and six low-molecular-weight (LM) bands (Fig. 2A and C, respectively, lane LM), as expected. The Sypro Ruby product literature (Molecular Probes) states that it may negatively stain prestained protein markers, due to the ability of these markers to quench the fluorescence of this stain. This was noted in our gel staining results as well, but although they stained negatively, the marker bands were still very visible on the Sypro Ruby-stained gel (Fig. 2C, lane LM). Most importantly, the ProQ glycosylation stain detected three of the glycosylated proteins, with molecular masses of 18, 42, and 82 kDa, from the CandyCane marker (Fig. 2B, lane CM), while all eight proteins were detected in this marker lane by either silver stain (Fig. 2A, lane CM), which detects all macromolecules, including lipids, fatty acids, proteins, nucleic acids, carbohydrates, and lipopolysaccharides, or Sypro Ruby stain (Fig. 2C, lane CM), which although it is included in the category of a protein stain, binds by association with primary amine groups (Fig. 2C, lane CM).
FIG 2.
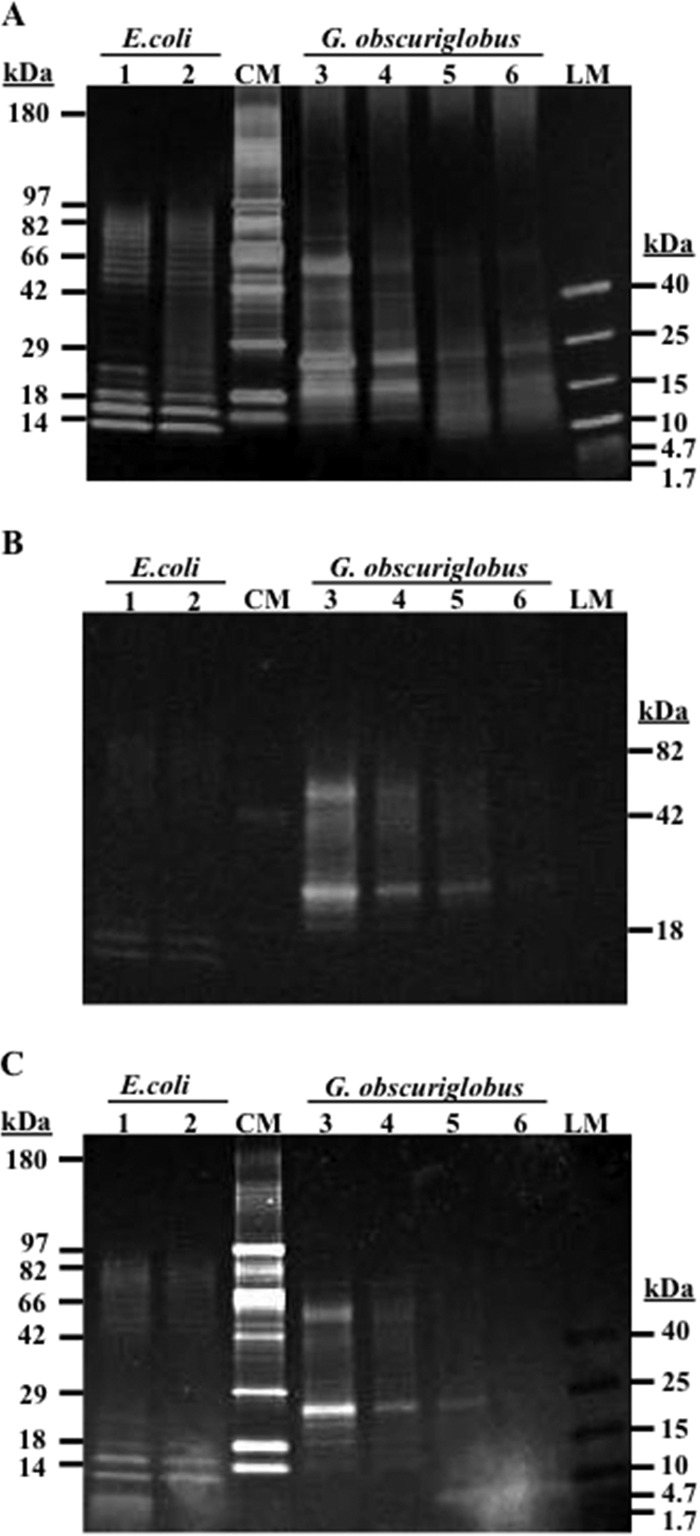
Differential staining of LPS and lipid A extracts resolved on 4 to 20% SDS-PAGE gels. Shown are silver stain (A), Emerald ProQ glycosylation stain (B), and Sypro Ruby protein stain (C). The samples include Sigma standard E. coli strain 0111:B4 lipid A (lane 1) and purified LPS (lane 2), the CandyCane glycosylated protein marker (lane CM), G. obscuriglobus crude LPS (lane 3), purified LPS (lane 4), and lipid A (lanes 5 and 6), and a spectrum low-molecular-weight marker (lane LM).
(ii) Evidence for LPS and lipid A in G. obscuriglobus.
G. obscuriglobus samples yielded banding profiles consistent with the presence of LPS/lipid A in both silver- and differentially stained gels (Fig. 2, lanes 3 to 6), based on a comparison with the E. coli controls and general literature on the migration profiles of LPS and lipid A from other bacterial species. Laddering and glycosylation shown in the middle- to upper (∼18- to 82-kDa)-molecular mass regions of the G. obscuriglobus LPS samples (Fig. 2, lanes 3 and 4), and even more distinctly ∼20 to 90 kDa for E. coli LPS (Fig. 2, lanes 2), suggest the presence of LPS O-antigen polysaccharides of various lengths. Although each showed a different pattern, distinct bands for E. coli lipid A within the range of 5 to 20 kDa (Fig. 2, lanes 1) and LPS (lane 2), and somewhat less-distinct bands in the same ranges for G. obscuriglobus lipid A (Fig. 2, lanes 5 and 6) and LPS (lanes 3 and 4), are likely to represent lipid A and inner/outer core LPS components. The numerous bands ranging from ∼10 to 90 kDa in E. coli LPS (Fig. 2, lanes 2), and ∼18 to 82 kDa in G. obscuriglobus LPS (Fig. 2, lanes 3 and 4), in all three stained gels, particularly noting those also detected with the Pro Q glycosylation stain (Fig. 2C), suggest that there are multiple oligosaccharide sugar moieties of differing compositions in the LPS of both of these species. Sypro Ruby (primary amine) staining of E. coli (Fig. 2C, lane 1) and G. obscuriglobus (Fig. 2C, lanes 5 and 6) lipid A preparations detected very-low-molecular-mass bands (∼5 kDa) that are not visible on silver-stained (Fig. 2A) or glycosylation-stained (Fig. 2B) gels but that are characteristic of lipid A presence.
Beyond these common features, the LPS and lipid A banding profiles of G. obscuriglobus and E. coli, and thus their presumed biochemical structure, are very different. G. obscuriglobus samples show significant glycosylation within the molecular mass range of 18 to 82 kDa (Fig. 2B, lanes 3 to 6), with particularly strong detection of two major LPS bands at ∼25 and 50 kDa that were not observed in E. coli. The lower band at 25 kDa is also very distinct in the G. obscuriglobus lipid A samples. The Sypro Ruby stain (Fig. 2C, lanes 1 to 6), which associates with primary amines, revealed an additional difference between the lipid A and LPS samples for both G. obscuriglobus and E. coli, as a major band of ∼5 kDa is detectable, although partially obscured by a gel staining artifact, in only the lipid A of both E. coli (Fig. 2C, lane 1) and G. obscuriglobus (Fig. 2C, lanes 5 and 6).
Targeted analysis of LPS composition. (i) 3-HOFA composition of LPS and lipid A.
As targeted analysis of LPS composition has not been applied to G. obscuriglobus, we validated our protocol by analyses of isolated LPS and lipid A from controls, i.e., E. coli LPS standard (Sigma-Aldrich) and LPS from E. coli UCLA strain 1246, in the same way as for G. obscuriglobus LPS. Both controls, when methylated and silylated, showed a single peak in XIC of m/z 175, identified as 3-OH C14:0 (data not shown), the presence of which is in agreement with previous reports (54).
GC-MS analysis of the nonpolar fraction of G. obscuriglobus LPS after methylation-silylation showed eight 3-HOFAs in the range C14 to C18 (see Fig. S4b in the supplemental material), with 3-OH C14:0 being the most abundant. The other seven FAs included three C15:0 acids (iso-, anteiso-, and n-C15:0), a C16:0 acid, two C17:0 acids (iso- or anteiso- and n-C17:0), and a C18:0 acid. 3-HOFAs were identified by comparison with the GC RI data obtained for a mixture containing five saturated 3-HOFA standards derivatized in the same way. A similar GC-MS profile was obtained for G. obscuriglobus lipid A prepared in the same way (see Fig. S6 in the supplemental material). The relative abundances of C14:0, C18:0, C16:0, iso- and n-C15:0, and the remaining OH FAs were in the proportions 4:1:0.5:0.5:0.25 and were indistinguishable for both LPS and lipid A.
Analysis by GC-MS of methylated and silylated 3-HOFAs extracted from G. obscuriglobus cells using the Komagata-Suzuki methods (46) showed 13 different 3-HOFAs, in the range C14 to C18, including monounsaturated and methyl-branched compounds. Figure 3a shows these 3-HOFAs, detected in the XIC m/z 175 using the single-quadrupole instrument, which were identified and confirmed using RI data (i.e., ECLs). Tandem MS (MS/MS) analysis in SRM mode, using the transition from m/z 175 to m/z 133, was also performed, confirming the presence of the same signals detected in the XIC of m/z 175 measurements (Fig. 3b and c).
FIG 3.

(a) Identified 3-HOFAs in G. obscuriglobus with combined GC and MS data. Analysis was performed using the single-quadrupole GC-MS with XIC of m/z 175 for G. obscuriglobus treated by the Komagata-Suzuki method (46) with identified peaks produced by GC-MS. (b and c) Analysis performed using the triple-quadrupole GC-MS/MS, with the chromatograms comparing 3-HOFA distributions in G. obscuriglobus cells by full-scan GC-MS/MS (b) and GC-MS/MS in SRM mode (c). The inset in the chromatogram represents the SRM mass spectrum, showing a peak at m/z 133. NL, neutral loss.
(ii) Kdo in LPS.
GC-MS analyses of peracetylated premethylated G. obscuriglobus LPS showed three Kdo peaks in XIC of m/z 375 (Fig. 4; see also Fig. S7 in the supplemental material). These peaks were identified based on their combined mass spectral and GC RT data. In contrast to the isomer profile of the Kdo standard, Kdo1 (pyranoside ring) is the dominant isomer in G. obscuriglobus LPS, as is also seen in E. coli (Fig. 4; see also Fig. S7). Both of these bacterial species have relative abundances of Kdo1 > Kdo2 > Kdo3, based on the signal at m/z 375.
FIG 4.

(a) XIC (m/z 375) showing the presence of Kdo in G. obscuriglobus LPS analyzed by GC-MS. As found in Gram-negative bacteria, the pyranosidic form (Kdo1) is the predominant Kdo in Gemmata LPS. (b) Mass spectrum showing fragmentation pattern with a peak at an RT of 10.16 min. The fragmentation pattern and RT match those of the Kdo standard, confirming the presence of Kdo in G. obscuriglobus. NL, neutral loss.
(iii) Carbohydrates.
G. obscuriglobus LPS, when derivatized and analyzed by GC-MS, was shown to contain both hexose and heptose sugars (XICs of m/z 331 and m/z 403, respectively) (see Fig. S8 in the supplemental material). These carbohydrates were subsequently identified as glucose and mannoheptose by comparison to a similarly derivatized standard sugar mixture on the basis of both GC RT and MS fragmentation information (data not shown).
(iv) Glucosamine.
GC-MS analyses of completely methylated E. coli and G. obscuriglobus LPS, after acetylation, showed peaks tentatively identifiable as glucosamine at RT of 9.65 and 9.75 min, through comparison with a glucosamine standard (see Fig. S9 in the supplemental material). Although glucosamine was identified in both G. obscuriglobus LPS and lipid A (data not shown), the exact location of this chemical moiety (polysaccharide versus lipid A) could not be confirmed.
Determination of lipid A structure. (i) Structural analysis of intact G. obscuriglobus lipid A.
MALDI-TOF MS parameters were optimized by an analysis of lipid A derived from the E. coli 0111:B4 LPS standard. The mass spectrum of a different E. coli lipid A extract control (that from UCLA 1246) (Fig. 5A) showed a fragmentation pattern similar to that of the lipid A standard (data not shown). However, the lipid A sample isolated from G. obscuriglobus cells showed a completely different MALDI TOF mass spectrum, with no discernible fragmentation pattern and no apparent loss of 80 u, the characteristic fragmentation pattern for dephosphorylation (Fig. 5B). A series of peaks separated by 14 u, ranging from m/z 2,017.16 to 2,143.28, with the most intense peak at m/z 2,087.22 (monoisotopic mass for the deprotonated molecule [M-H]−), were observed (Fig. 5C). Given that 3-OH C14:0 was shown to be the most abundant G. obscuriglobus FA by GC-MS analyses, it can be assumed that the most intense peak at m/z 2,087.22 corresponds to a dominant lipid A structure having 3-OH C14:0 as the major FA component (and assuming equal MALDI-TOF MS efficiencies for all lipid A moieties). Further investigation revealed another cluster of 14-u-separated peaks in the range m/z 1,883.28 to 1,953.48 (Fig. 5B). The most intense peak in this cluster, i.e., m/z 1,911.13, is 176 u away from the m/z 2,087.22. A low-intensity peak at m/z 1,684.28 and another cluster of peaks around m/z 1,270.44 were also observed.
FIG 5.

Comparative negative-ion MALDI-TOF mass spectra of E. coli controls (A) and G. obscuriglobus lipid A (B), isolated by the Yi and Hackett method (43). Lack of adequate fragmentations impedes the determination of the exact molecular structure. However, the presence of a cluster of ions, each separated by 14 u, may indicate the presence of multiple lipid A species in G. obscuriglobus. (C) Expanded view of the negative-ion-mode MALDI-TOF mass spectra showing the deprotonated molecule region for the lipid A isolated from G. obscuriglobus (inset, calculated isotopic pattern for the highest abundant acyl homolog).
The use of the method of El Hamidi et al. (44) of direct lipid A isolation from whole cells provided an alternative isolation method to that of Yi and Hackett (43), which may cause alterations in lipid A structure, such as the loss of a primary or secondary O-acyl chain and dephosphorylation (55, 56). For both controls and G. obscuriglobus, the mass spectra obtained from the El Hamidi et al. (44) preparations were similar to those from the Yi and Hackett method (reference 43 and data not shown), although with a lower signal-to-noise ratio.
(ii) Structural analysis of selectively deacylated lipid A.
To substantiate the G. obscuriglobus lipid A MALDI-TOF mass spectrum fragmentation pattern (Fig. 5b) and to ascertain the location of fatty acid chains, de-O-acylation reactions were carried out, sequentially removing primary O-acyl FA chains and then secondary O-acyl-linked FA residues in N-acyl chains, using ammonia hydrolysis. For E. coli lipid A, diluted and concentrated ammonia hydrolysates produced similar GC mass spectra. However, G. obscuriglobus lipid A did not exhibit any significant evidence of deacylation (data not shown).
(iii) Carbohydrate compositional analyses of LPS and lipid A.
Comprehensive GC-MS analysis of G. obscuriglobus LPS, derivatized by methylation-peracetylation, showed the presence of glucosamine and diaminoglucose (Fig. 6). Glucosamine was identified by mass spectral and RT comparisons with the glucosamine standard, while diaminoglucose (2,3-diamino, 2,3-dideoxy glucose [GlcN3N]) was tentatively identified on the basis of differences in fragmentation pattern and RT shift (data not shown) due to the presence of an extra -NH-Ac group (there was not a Lipid Library entry available for a diamino-diacetylated methyl-glycoside derivative). A hexuronic acid (e.g., GalA; molecular mass, 194 u) was also identified in the G. obscuriglobus LPS by GC-MS analysis (Fig. 6d). Additionally, a G. obscuriglobus lipid A sample, isolated by the Yi and Hackett method (43), showed all the polar components described above when analyzed in the same way as the LPS (Fig. 6). This lipid A sample, when analyzed by GC-MS, showed two peaks at RT of 26.03 and 26.80 min (data not shown), having mass spectra similar to those of the glucosamine standard. However, the glucosamine standard exhibited two peaks consistent with the presence of α- and β-anomers, while only one G. obscuriglobus peak matched an RT of the glucosamine β-anomer, and the other G. obscuriglobus peak eluted 6 s before the RT of the α-anomer. Thus, GC-MS analyses of both G. obscuriglobus LPS and lipid A produced peaks identified as glucosamine and another peak tentatively identified as diaminoglucose.
FIG 6.
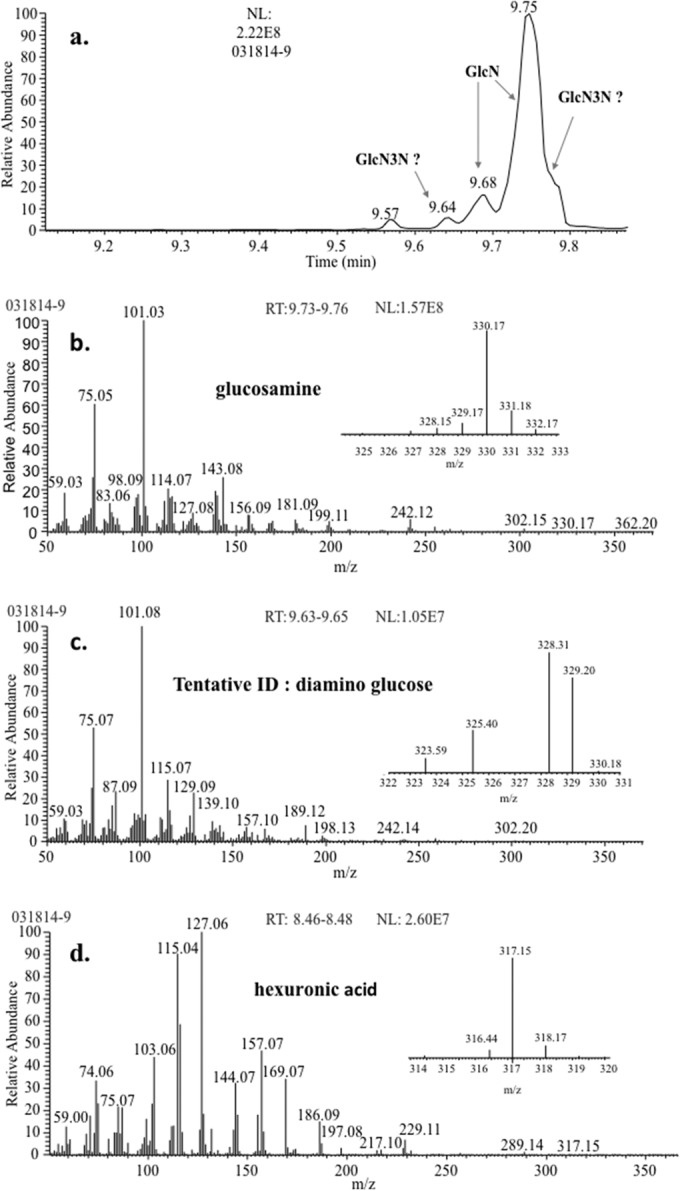
(a) XIC of m/z 101 showing peaks corresponding to glucosamine and diaminoglucose when methylated acetylated G. obscuriglobus LPS was analyzed via GC-MS. The corresponding mass spectra are shown for glucosamine (b) and diaminoglucose (c). Glucosamine produces a characteristic m/z 330 with the loss of a methoxy radical, while diaminoglucose produces m/z 329 by the same loss. (d) EI mass spectrum (GC-MS) of hexuronic acid, with the characteristic ion at m/z 317 shown in the profile. The mass spectrum of the hexuronic acid from G. obscuriglobus has an 80% match with the NIST library hit. All samples were derivatized by methylation-acetylation. NL, neutral loss.
DISCUSSION
The principal aim of this study was to experimentally determine the presence of LPS, a hallmark of the OM (26, 27), in G. obscuriglobus, based on previous predictions from genomic data (20, 25, 42). Specific components within the G. obscuriglobus LPS were elucidated, including lipid A 3-OH fatty acid composition, the presence of Kdo (the disaccharide that links the lipid A to LPS core oligosaccharides [35]), and the presence of glucose and mannoheptose, which may constitute the G. obscuriglobus core oligosaccharide or O-Ag components (30, 35). Combined data from these analyses provide a tentative lipid A structure for G. obscuriglobus (presented below), which is a monophosphorylated hexa-acylated structure with a trisaccharide backbone. Furthermore, we identified a putative PUFA and two sterols that were not previously reported, and we achieved a detailed comparison of the FAs present in G. obscuriglobus whole cells, LPS, and lipid A. Our isolation and characterization of LPS suggest indirectly that an OM is present.
Global lipid analysis. (i) FAs.
Both saturated and unsaturated long-chain fatty acids (LCFAs) were found in G. obscuriglobus whole-cell extracts. We found that G. obscuriglobus contained ∼70% saturated versus ∼30% unsaturated FAs, consistent with a previous analysis (41) that reported 82% saturated and 18% unsaturated FAs. As reported in an earlier study (57), C18:0 and C16:1 were found to be the dominant FAs. This profile is also in agreement with the nonhydroxy FA composition reported previously by Sittig and Schlesner (41). Long-chain FAs (LCFAs; 16 to 18 carbons) are necessary for the production of lipids required to support the integrity of bacterial membranes (58, 59), and LCFAs also contribute to low bacterial endotoxicity (38), consistent with the fact that no previous study or literature reference reports endotoxicity in G. obscuriglobus. Several isomers of the monounsaturated FAs C16:1 and C18:1 were detected, and methyl-branched iso- and anteiso-FAs, including methyl-branched-chain 3-HOFAs, were also detected. Branched-chain FAs impact membrane fluidity through effects on the combined FA melting point (60–62).
(ii) PUFA.
In whole-cell extracts, we detected a previously unreported very-long-chain FA (VLCFA; >18 carbons) that appears to be a heptacosatrienoic (ω3 C27:3) acid, a type of omega-3 PUFA (63–65). To the best of our knowledge, a PUFA of this same structure and chain length has been found in marine sponges only (66). A different VLCFA, n-C31:9, has been reported for G. obscuriglobus (57). VLCFAs are most often found in alphaproteobacteria and members of the order Cytophagales (57, 67), and they can be derived from exogenous sources (68) or synthesized de novo; the origin of the G. obscuriglobus PUFA remains to be determined. PUFAs exhibit very low melting temperatures and thus contribute to increased membrane fluidity. The G. obscuriglobus PUFA may provide an adaptive response to increase membrane fluidity (through low melting temperature), counterbalancing the reduction in fluidity associated with an abundance of saturated FAs (69). PUFAs also regulate membranes and membrane-bound proteins (68), aid in membrane curvature (70), and facilitate increased membrane permeability and membrane vesicle formation and fusion (71, 72). A role for the G. obscuriglobus PUFA in membrane curvature, permeability, membrane remodeling, or vesicular transport would be an intriguing avenue for future study, given the presence of MC-like proteins and the proposed tubulovesicular transport system (7).
(iii) 3-HOFAs.
Multiple-long-chain 3-HOFAs were identified in G. obscuriglobus whole-cell extracts, consistent with an earlier study (41) that reported eight different 3-HOFAs, and exceeding the single-long-chain normal 3-HOFA reported for other planctomycete species, Planctopirus limnophilus, Planctomyces sp. strain 1317, and Pirellula staleyi (40, 73). The presence of both branched-chain FAs and 3-HOFAs in a single species is relatively rare (61). The diversity of G. obscuriglobus 3-HOFAs may be related to the presence of a PUFA, as discussed above. β-OH FAs may also be components of ornithine-amide lipids (74), and several planctomycete strains contain ornithine lipids (75). Although we cannot exclude the possibility that the 3-HOFAs of G. obscuriglobus derive from other cellular lipids, 3-HOFAs are always components of lipid A (35), as discussed below.
(iv) Sterols.
We confirmed the presence of two previously reported G. obscuriglobus C30 sterols, lanosterol and parkeol (8), but also detected two additional sterols tentatively identified as isoarborinol isomers. The fact that G. obscuriglobus contains both sterols and a PUFA is intriguing, considering reports that a high degree of membrane disorder results from this lipid combination (71, 76, 77). It is possible that these two lipid classes are differently distributed in the cell membranes to provide locally specialized functions.
Evidence for LPS and lipid A in G. obscuriglobus using SDS-PAGE.
Our SDS-PAGE profiles of extracted and purified G. obscuriglobus LPS provide the first gel images that are consistent with isolated LPS and lipid A for this species or any planctomycete. Increasing refinement of successive extractions was evident, with the loss of higher-molecular-weight material in the lipid A preparation. The gel profiles of E. coli standard LPS and lipid A indicate that the E. coli LPS may be more resistant to the hydrolysis required to liberate lipid A, as has been reported for LPS carrying longer-chain polysaccharides (Sigma L2630 LPS product information).
Differentially stained SDS-PAGE gel profiles show results consistent with published gel images specific to LPS of the particular E. coli strain (0111:B4) (50–53) represented by the E. coli standard, and more generally with data reported in the scientific literature for LPS from various other bacteria (24, 28, 30, 31, 37, 78–80). Common features for E. coli and G. obscuriglobus LPS include the presence of multiple oligosaccharide sugar moieties that differ in composition between the two species, inferred from band laddering and glycosylation. This suggests the presence of LPS O-antigen polysaccharides of various lengths or other glycosylated components; LPS inner and outer core oligosaccharides are typically composed of up to 15 sugar moieties (31). Some Gram-negative bacteria lack the repeating units referred to as O-Ag, or they display a very limited O-Ag chain (28, 81). G. obscuriglobus may be one of these, based on the smaller number of laddered glycosylated bands in the gel region where O-Ag bands typically migrate. A related bacterium within the Chlamydiaceae has been found to carry the most truncated LPS structure reported. The SDS-PAGE gel bands of very low MW, which are visible only in the lipid A preparations of both species, are characteristic of the presence of lipid A (24, 28, 30, 31, 37, 78). This major component may be most visible in the lipid A gel lanes, because it represents lipid A that is released from LPS by hydrolysis and subsequently enriched.
Bands of ∼10 to 20 kDa in LPS and lipid A from both species may represent lipid A and inner/outer core LPS components, based on literature comparisons (24, 28, 30, 31, 37). Differences between G. obscuriglobus and E. coli LPS or lipid A include significant glycosylation of G. obscuriglobus LPS components in the range of 20 to 85 kDa, with two particularly apparent entities (∼25 and 50 kDa) not found in the E. coli LPS. Because of their laddered appearance, apparent molecular weights, and glycosylation, the LPS of G. obscuriglobus might include a very limited O-Ag makeup (discussed above) or, alternatively, represent part of the core oligosaccharide. One of these glycosylated components (∼25 kDa) is also found in the G. obscuriglobus lipid A preparation.
Targeted analysis of LPS composition. (i) 3-HOFA composition of LPS and lipid A.
GC-MS analysis of G. obscuriglobus LPS showed eight 3-HOFAs, in the range C14 to C18, with C14 being most abundant. The same GC-MS profile was obtained from an analysis of G. obscuriglobus lipid A, which was expected because LPS hydrolysis would release lipid A from its linkage to Kdo, and the lipid A FA content would remain the same as that for the entire LPS. 3-HOFAs are always present in lipid A structures, with the degree of acylation impacting the host immune response when exposed to a particular lipid A (24). In contrast to the relatively restricted 3-OH content of the LPS, whole cells were shown to contain 13 different 3-HOFAs (discussed above), suggesting that our purification protocols for LPS and lipid A were effective.
(ii) Kdo in LPS.
GC-MS analyses of G. obscuriglobus LPS revealed three Kdo (35, 38, 78) peaks. The identification of Kdo in G. obscuriglobus is a finding of note, because all LPS described to date contains either Kdo or Ko (26, 34, 82), although Kdo is known to occur in other cell polymers (83). The LPS inner core of a Gram-negative bacterium usually has one to three Kdo and two or three specific heptoses and a variety of possible structural configurations (82). Alternative methodologies will be needed to determine the exact number of Kdo moieties (i.e., Kdo monomer, dimer, trimer, etc.). Both G. obscuriglobus and E. coli (UCLA 1246) had relative abundances of Kdo1 > Kdo2 > Kdo3, but the identification of the specific structural location of each of these isomers in G. obscuriglobus requires further study.
(iii) Carbohydrates.
G. obscuriglobus LPS, when derivatized and analyzed by GC-MS, was shown to contain both hexose and heptose sugars, consistent with a previous report (18). These sugars, further identified as glucose and mannoheptose, may represent the LPS core oligosaccharide or O-Ag components, although heptose has been known to occur in other non-LPS bacterial glycolipids (84); a more-detailed structural analysis will be needed to decipher their specific locations within the LPS structure.
(iv) Glucosamine.
Although the exact location of glucosamine in the G. obscuriglobus LPS, within the core polysaccharide chain or part of lipid A, was not determined, its presence in both the LPS and lipid A preparations supports the effective isolation of LPS, because lipid A is composed of a unique carbohydrate-lipid combination that is frequently a β-1,6-d-glucosamine disaccharide linked to a varied number of FAs and OH-FAs.
(v) Determination of lipid A structure.
Structural analysis of intact G. obscuriglobus lipid A suggested that the dominant G. obscuriglobus lipid A structure has 3-OH C14:0 (the most abundant FA in whole cells) as the major FA. The presence of multiple repeated peak clusters of a similar fragmentation pattern and the detection of eight different lipid A 3-HOFAs raise the possibility that G. obscuriglobus contains multiple lipid A species, as previously reported for Porphyromonas gingivalis (85). Consistent mass spectra obtained for intact lipid A using the methods of Yi and Hackett (43) and El Hamidi et al. (44) support our predicted lipid A structure. Structural analysis of deacylated G. obscuriglobus lipid A did not show any evidence of sequential removal of O-acyl FA chains by deacylation, which may indicate that it lacks an O-acyl chain(s).
(vi) Sugar compositional analyses of LPS and lipid A.
The detection of glucosamine, (tentatively) diaminoglucose, and a hexuronic acid in both LPS and lipid A samples from G. obscuriglobus suggests that all three components are contained in the lipid A backbone. Hexuronic acid is found within the glycosaminoglycan family (GAGs) and found in lipid A from other bacterial species, e.g., Rhodospirillum salinarum 40 (86) and Rhizobium trifolii (87). The lipid A backbones of Rhizobium species also contain either d-galacturonic acid/d-glucosamine or glucosamine/2,3-diaminoglucose (88), similar to our findings in G. obscuriglobus.
(vii) Elucidation of a tentative lipid A structure for G. obscuriglobus.
On the basis of combined GC-MS and MALDI-TOF MS results, we propose a tentative structure for the G. obscuriglobus lipid A molecule (one representative structure shown in Fig. 7), which is a monophosphorylated hexa-acylated structure with a trisaccharide backbone, featuring a heterodimer of GlcN-GlcN3N with a phosphate at C1 replaced by a hexuronic acid (GalA), i.e., P-GlcN-GlcN3N-GalA. Hexuronic acids are capable of maintaining the negative charge on a lipid A molecule that is more commonly provided by phosphate moieties. Negative charges in close proximity to a membrane are characteristic of known LPS structures and contribute to membrane stability by allowing cross-linking with bivalent cations. For the most intense acyl homolog cluster in the G. obscuriglobus MALDI-TOF mass spectrum, m/z 2,087.22 (monoisotopic mass of deprotonated molecule), our proposed structure would correspond to the neutral molecular formula C114H214N3O27P (monoisotopic mass, 2,088.52 Da). The tentative representative structure (Fig. 7) shows an example of FA distribution, with linked FAs with carbon numbers 16, 14, 16, 14, 18, and 18 (a total of 96 carbon atoms, plus 18 carbon atoms in the trisaccharide backbone, for a total of 114 carbon atoms). This tentative structure comprises contributions from three of the most abundant 3-OH FAs detected in our GC-MS measurements, n-C14:0, n-C16:0, and n-C18:0.
FIG 7.
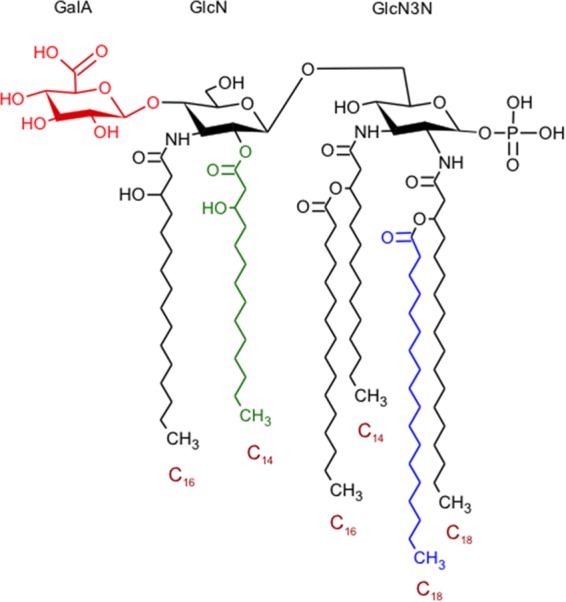
A tentative representative molecular structure for G. obscuriglobus lipid A, referring to m/z 2,087.22. The structure shown is neutral. The secondary FA chain presented in blue or 3-OH C16:0 at C3′, when replaced with FA chains of <C18:0, yields m/z 2,073.22 and 2,059.22, respectively. On the other hand, replacement of the 3-OH FA chain drawn in green with FA of >C14:0 yields the signals above m/z 2,087.22.
The monophosphorylation of G. obscuriglobus lipid A (when one of two typical phosphate group positions is replaced by hexuronic acid) may contribute to lower endotoxicity for this lipid A (89), as this organism has not been reported to exhibit endotoxicity and may be impacted by this lipid A structural replacement. There are several other examples of Gram-negative bacteria that exhibit only one, or a complete lack of, phosphate group in their lipid A, but a diphosphorylated lipid A is the most highly conserved structure in this bacterial group (34). To our knowledge, Rhizobium etli is the only other organism reported to have a lipid A structure containing the same trisaccharide backbone as that proposed for G. obscuriglobus, although there are 2 or 3 reported lipid A structures that do carry the heterologous disaccharide backbone of GlcN-GlcN3N (28, 90). The tentative representative structure we propose is an example of possible FA distribution, 16 + 14 + 17 + 14 + 18 + 18 = 97, which incorporates three of the most abundant 3-OH FAs detected in the GC-MS measurements, n-C14:0, n-C16:0, and n-C18:0. However, other structures are possible, and later studies involving further fractionation of the individual components may be necessary.
Our confirmation of an LPS implies the presence of an OM in G. obscuriglobus, although verification of the LPS location within this organism by immunogold or fluorescent antibody detection will be necessary, and it raises the possibility that other planctomycetes also have outer membrane components. The pursuit of this question, together with studies of the structural connections between the LPS of G. obscuriglobus (and possibly other planctomycetes) and the newly discovered planctomycete peptidoglycans (16, 17), will shed more light on what is now emerging as the planctomycete variation on the Gram-negative cell plan (20).
Supplementary Material
Footnotes
Supplemental material for this article may be found at http://dx.doi.org/10.1128/JB.00517-15.
REFERENCES
- 1.Franzmann PD, Skerman VB. 1984. Gemmata obscuriglobus, a new genus and species of the budding bacteria. Antonie Van Leeuwenhoek 50:261–268. doi: 10.1007/BF02342136. [DOI] [PubMed] [Google Scholar]
- 2.Devos DP. 2013. Gemmata obscuriglobus. Curr Biol 23:R705–R707. [DOI] [PubMed] [Google Scholar]
- 3.Fuerst JA. 2013. The PVC superphylum: exceptions to the bacterial definition? Antonie Van Leeuwenhoek 104:451–466. doi: 10.1007/s10482-013-9986-1. [DOI] [PubMed] [Google Scholar]
- 4.Reynaud EG, Devos DP. 2011. Transitional forms between the three domains of life and evolutionary implications. Proc Biol Sci 278:3321–3328. doi: 10.1098/rspb.2011.1581. [DOI] [PMC free article] [PubMed] [Google Scholar]
- 5.Fuerst JA, Sagulenko E. 2011. Beyond the bacterium: planctomycetes challenge our concepts of microbial structure and function. Nat Rev Microbiol 9:403–413. doi: 10.1038/nrmicro2578. [DOI] [PubMed] [Google Scholar]
- 6.Fuerst JA. 2005. Intracellular compartmentation in planctomycetes. Annu Rev Microbiol 59:299–328. doi: 10.1146/annurev.micro.59.030804.121258. [DOI] [PubMed] [Google Scholar]
- 7.Santarella-Mellwig R, Pruggnaller S, Roos N, Mattaj IW, Devos DP. 2013. Three-dimensional reconstruction of bacteria with a complex endomembrane system. PLoS Biol 11:e1001565. doi: 10.1371/journal.pbio.1001565. [DOI] [PMC free article] [PubMed] [Google Scholar]
- 8.Pearson A, Budin M, Brocks JJ. 2003. Phylogenetic and biochemical evidence for sterol synthesis in the bacterium Gemmata obscuriglobus. Proc Natl Acad Sci U S A 100:15352–15357. doi: 10.1073/pnas.2536559100. [DOI] [PMC free article] [PubMed] [Google Scholar]
- 9.Lamb DC, Jackson CJ, Warrilow AGS, Manning NJ, Kelly DE, Kelly SL. 2007. Lanosterol biosynthesis in the prokaryote Methylococcus capsulatus: insight into the evolution of sterol biosynthesis. Mol Biol Evol 24:1714–1721. doi: 10.1093/molbev/msm090. [DOI] [PubMed] [Google Scholar]
- 10.Lonhienne TGA, Sagulenko E, Webb RI, Lee K-C, Franke J, Devos DP, Nouwens A, Carroll BJ, Fuerst JA. 2010. Endocytosis-like protein uptake in the bacterium Gemmata obscuriglobus. Proc Natl Acad Sci U S A 107:12883–12888. doi: 10.1073/pnas.1001085107. [DOI] [PMC free article] [PubMed] [Google Scholar]
- 11.Yee B, Sagulenko E, Morgan GP, Webb RI, Fuerst JA. 2012. Electron tomography of the nucleoid of Gemmata obscuriglobus reveals complex liquid crystalline cholesteric structure. Front Microbiol 3:326. doi: 10.3389/fmicb.2012.00326. [DOI] [PMC free article] [PubMed] [Google Scholar]
- 12.Lieber A, Leis A, Kushmaro A, Minsky A, Medalia O. 2009. Chromatin organization and radio resistance in the bacterium Gemmata obscuriglobus. J Bacteriol 191:1439–1445. doi: 10.1128/JB.01513-08. [DOI] [PMC free article] [PubMed] [Google Scholar]
- 13.Sagulenko E, Morgan GP, Webb RI, Yee B, Lee K-C, Fuerst JA. 2014. Structural studies of planctomycete Gemmata obscuriglobus support cell compartmentalisation in a bacterium. PLoS One 9:e91344. doi: 10.1371/journal.pone.0091344. [DOI] [PMC free article] [PubMed] [Google Scholar]
- 14.Lindsay MR, Webb RI, Strous M, Jetten MS, Butler MK, Forde RJ, Fuerst JA. 2001. Cell compartmentalisation in planctomycetes: novel types of structural organisation for the bacterial cell. Arch Microbiol 175:413–429. doi: 10.1007/s002030100280. [DOI] [PubMed] [Google Scholar]
- 15.Jenkins C, Kedar V, Fuerst JA. 2002. Gene discovery within the planctomycete division of the domain Bacteria using sequence tags from genomic DNA libraries. Genome Biol 3:research0031.1–research0031.11. [DOI] [PMC free article] [PubMed] [Google Scholar]
- 16.Jeske O, Schüler M, Schumann P, Schneider A, Boedeker C, Jogler M, Bollschweiler D, Rohde M, Mayer C, Engelhardt H, Spring S, Jogler C. 2015. Planctomycetes do possess a peptidoglycan cell wall. Nat Commun 6:7116. doi: 10.1038/ncomms8116. [DOI] [PMC free article] [PubMed] [Google Scholar]
- 17.van Teeseling MCF, Mesman RJ, Kuru E, Espaillat A, Cava F, Brun YV, VanNieuwenhze MS, Kartal B, van Niftrik L. 2015. Anammox planctomycetes have a peptidoglycan cell wall. Nat Commun 6:6878. doi: 10.1038/ncomms7878. [DOI] [PMC free article] [PubMed] [Google Scholar]
- 18.Stackebrandt E, Wehmeyer U, Liesack W. 1986. 16S ribosomal RNA- and cell wall analysis of Gemmata obscuriglobus, a new member of the order Planctomycetales. FEMS Microbiol Lett 37:289–292. doi: 10.1111/j.1574-6968.1986.tb01810.x. [DOI] [Google Scholar]
- 19.Fuerst JA, Webb RI. 1991. Membrane-bounded nucleoid in the eubacterium Gemmata obscuriglobus. Proc Natl Acad Sci U S A 88:8184–8188. doi: 10.1073/pnas.88.18.8184. [DOI] [PMC free article] [PubMed] [Google Scholar]
- 20.Speth DR, van Teeseling MCF, Jetten MSM. 2012. Genomic analysis indicates the presence of an asymmetric bilayer outer membrane in Planctomycetes and Verrucomicrobia. Front Microbiol 3:304. doi: 10.3389/fmicb.2012.00304. [DOI] [PMC free article] [PubMed] [Google Scholar]
- 21.Paparoditis P, Västermark Å, Le AJ, Fuerst JA, Saier MH Jr. 2014. Bioinformatic analyses of integral membrane transport proteins encoded within the genome of the Planctomycetes species, Rhodopirellula baltica. Biochim Biophys Acta 1838:193–215. doi: 10.1016/j.bbamem.2013.08.007. [DOI] [PMC free article] [PubMed] [Google Scholar]
- 22.Amat F, Comolli LR, Nomellini JF, Moussavi F, Downing KH, Smit J, Horowitz M. 2010. Analysis of the intact surface layer of Caulobacter crescentus by cryo-electron tomography. J Bacteriol 192:5855–5865. doi: 10.1128/JB.00747-10. [DOI] [PMC free article] [PubMed] [Google Scholar]
- 23.van Teeseling MCF, de Almeida NM, Klingl A, Speth DR, Op den Camp HJM, Rachel R, Jetten MSM, van Niftrik L. 2014. A new addition to the cell plan of anammox bacteria: “Candidatus Kuenenia stuttgartiensis” has a protein surface layer as the outermost layer of the cell. J Bacteriol 196:80–89. doi: 10.1128/JB.00988-13. [DOI] [PMC free article] [PubMed] [Google Scholar]
- 24.Raetz CRH, Whitfield C. 2002. Lipopolysaccharide endotoxins. Annu Rev Biochem 71:635–700. doi: 10.1146/annurev.biochem.71.110601.135414. [DOI] [PMC free article] [PubMed] [Google Scholar]
- 25.Sutcliffe IC. 2010. A phylum level perspective on bacterial cell envelope architecture. Trends Microbiol 18:464–470. doi: 10.1016/j.tim.2010.06.005. [DOI] [PubMed] [Google Scholar]
- 26.Kamerling JP. 2007. Comprehensive glycoscience: from chemistry to systems biology. Elsevier, Amsterdam, the Netherlands. [Google Scholar]
- 27.De Castro C, Parrilli M, Holst O, Molinaro A. 2010. Microbe-associated molecular patterns in innate immunity: extraction and chemical analysis of gram-negative bacterial lipopolysaccharides. 480:89–115. doi: 10.1016/S0076-6879(10)80005-9. [DOI] [PubMed] [Google Scholar]
- 28.Caroff M, Karibian D. 2003. Structure of bacterial lipopolysaccharides. Carbohydr Res 338:2431–2447. doi: 10.1016/j.carres.2003.07.010. [DOI] [PubMed] [Google Scholar]
- 29.Hug I, Feldman MF. 2011. Analogies and homologies in lipopolysaccharide and glycoprotein biosynthesis in bacteria. Glycobiology 21:138–151. doi: 10.1093/glycob/cwq148. [DOI] [PubMed] [Google Scholar]
- 30.Marolda CL, Lahiry P, Vinés E, Saldías S, Valvano MA. 2006. Micromethods for the characterization of lipid A-core and O-antigen lipopolysaccharide. Methods Mol Biol 347:237–252. [DOI] [PubMed] [Google Scholar]
- 31.Knirel YA, Valvano MA. 2011. Bacterial lipopolysaccharides: structure, chemical synthesis, biogenesis, and interaction with host cells. Springer, Vienna, Austria. [Google Scholar]
- 32.Ruiz N, Kahne D, Silhavy TJ. 2009. Transport of lipopolysaccharide across the cell envelope: the long road of discovery. Nat Rev Microbiol 7:677–683. doi: 10.1038/nrmicro2184. [DOI] [PMC free article] [PubMed] [Google Scholar]
- 33.Kabanov DS, Prokhorenko IR. 2010. Structural analysis of lipopolysaccharides from Gram-negative bacteria. Biochemistry (Moscow) 75:383–404. doi: 10.1134/S0006297910040012. [DOI] [PubMed] [Google Scholar]
- 34.Trent MS. 2004. Biosynthesis, transport, and modification of lipid A. Biochem Cell Biol 82:71–86. [DOI] [PubMed] [Google Scholar]
- 35.Gronow S, Brade H. 2001. Invited review: lipopolysaccharide biosynthesis: which steps do bacteria need to survive? J Endotoxin Res 7:3–23. doi: 10.1177/09680519010070010301. [DOI] [PubMed] [Google Scholar]
- 36.Wang X, Quinn PJ. 2010. Endotoxins: structure, function and recognition. Springer Verlag, New York, NY. [Google Scholar]
- 37.Valvano MA, Messner P, Kosma P. 2002. Novel pathways for biosynthesis of nucleotide-activated glycero-manno-heptose precursors of bacterial glycoproteins and cell surface polysaccharides. Microbiology 148:1979–1989. doi: 10.1099/00221287-148-7-1979. [DOI] [PubMed] [Google Scholar]
- 38.Zähringer U, Lindner B, Knirel YA, van den Akker WMR, Hiestand R, Heine H, Dehio C. 2004. Structure and biological activity of the short-chain lipopolysaccharide from Bartonella henselae ATCC 49882T. J Biol Chem 279:21046–21054. doi: 10.1074/jbc.M313370200. [DOI] [PubMed] [Google Scholar]
- 39.Kilár A, Dörnyei Á Kocsis B. 2013. Structural characterization of bacterial lipopolysaccharides with mass spectrometry and on- and off-line separation techniques. Mass Spectrom Rev 32:90–117. doi: 10.1002/mas.21352. [DOI] [PubMed] [Google Scholar]
- 40.Kerger BD, Mancuso CA, Nichols PD, White DC, Langworthy T, Sittig M, Schlesner H, Hirsch P. 1988. The budding bacteria, Pirellula and Planctomyces, with atypical 16S rRNA and absence of peptidoglycan, show eubacterial phospholipids and uniquely high proportions of long chain beta-hydroxy fatty acids in the lipopolysaccharide lipid A. Arch Microbiol 149:255–260. doi: 10.1007/BF00422014. [DOI] [Google Scholar]
- 41.Sittig M, Schlesner H. 1993. Chemotaxonomic investigation of various prosthecate and/or budding bacteria. Syst Appl Microbiol 16:92–103. doi: 10.1016/S0723-2020(11)80253-5. [DOI] [Google Scholar]
- 42.Strous M, Pelletier E, Mangenot S, Rattei T, Lehner A, Taylor MW, Horn M, Daims H, Bartol-Mavel D, Wincker P, Barbe V, Fonknechten N, Vallenet D, Segurens B, Schenowitz-Truong C, Médigue C, Collingro A, Snel B, Dutilh BE, Op den Camp HJM, van der Drift C, Cirpus I, van de Pas-Schoonen KT, Harhangi HR, van Niftrik L, Schmid M, Keltjens J, van de Vossenberg J, Kartal B, Meier H, Frishman D, Huynen MA, Mewes H-W, Weissenbach J, Jetten MSM, Wagner M, Le Paslier D. 2006. Deciphering the evolution and metabolism of an anammox bacterium from a community genome. Nature 440:790–794. doi: 10.1038/nature04647. [DOI] [PubMed] [Google Scholar]
- 43.Yi EC, Hackett M. 2000. Rapid isolation method for lipopolysaccharide and lipid A from Gram-negative bacteria. Analyst 125:651–656. doi: 10.1039/b000368i. [DOI] [PubMed] [Google Scholar]
- 44.El Hamidi A, Tirsoaga A, Novikov A, Hussein A, Caroff M. 2005. Microextraction of bacterial lipid A: easy and rapid method for mass spectrometric characterization. J Lipid Res 46:1773–1778. doi: 10.1194/jlr.D500014-JLR200. [DOI] [PubMed] [Google Scholar]
- 45.Schultz E, Pugh ME. 2001. Determination of the fatty acid content of biological membranes: a highly versatile GC-MS experiment. J Chem Educ 78:944. doi: 10.1021/ed078p944. [DOI] [Google Scholar]
- 46.Komagata K, Suzuki K-I. 1988. 4-Lipid and cell-wall analysis in bacterial systematics, p 161–207. In Grigorova R, Norris JR (ed), Methods in microbiology. Academic Press, San Diego, CA. [Google Scholar]
- 47.Rybka J, Gamian A. 2006. Determination of endotoxin by the measurement of the acetylated methyl glycoside derivative of Kdo with gas-liquid chromatography-mass spectrometry. J Microbiol Methods 64:171–184. doi: 10.1016/j.mimet.2005.04.029. [DOI] [PubMed] [Google Scholar]
- 48.Silipo A, Lanzetta R, Amoresano A, Parrilli M, Molinaro A. 2002. Ammonium hydroxide hydrolysis: a valuable support in the MALDI-TOF mass spectrometry analysis of lipid A fatty acid distribution. J Lipid Res 43:2188–2195. doi: 10.1194/jlr.D200021-JLR200. [DOI] [PubMed] [Google Scholar]
- 49.Basile F, Voorhees KJ, Hadfield TL. 1995. Microorganism Gram-type differentiation based on pyrolysis-mass spectrometry of bacterial fatty acid methyl ester extracts. Appl Environ Microbiol 61:1534–1539. [DOI] [PMC free article] [PubMed] [Google Scholar]
- 50.Huang JX, Azad MAK, Yuriev E, Baker MA, Nation RL, Li J, Cooper MA, Velkov T. 2012. Molecular characterization of lipopolysaccharide binding to human α-1-acid glycoprotein. J Lipids 2012:475153. [DOI] [PMC free article] [PubMed] [Google Scholar]
- 51.Lee DH, Kim S-H, Kang W, Choi YS, Lee S-H, Lee S-R, You S, Lee HK, Chang K-T, Shin E-C. 2011. Adjuvant effect of bacterial outer membrane vesicles with penta-acylated lipopolysaccharide on antigen-specific T cell priming. Vaccine 29:8293–8301. doi: 10.1016/j.vaccine.2011.08.102. [DOI] [PubMed] [Google Scholar]
- 52.Peterson AA, Haug A, McGroarty EJ. 1986. Physical properties of short- and long-O-antigen-containing fractions of lipopolysaccharide from Escherichia coli 0111:B4. J Bacteriol 165:116–122. [DOI] [PMC free article] [PubMed] [Google Scholar]
- 53.Tan L, Grewal PS. 2002. Comparison of two silver staining techniques for detecting lipopolysaccharides in polyacrylamide gels. J Clin Microbiol 40:4372–4374. doi: 10.1128/JCM.40.11.4372-4374.2002. [DOI] [PMC free article] [PubMed] [Google Scholar]
- 54.Meredith TC, Aggarwal P, Mamat U, Lindner B, Woodard RW. 2006. Redefining the requisite lipopolysaccharide structure in Escherichia coli. ACS Chem Biol 1:33–42. doi: 10.1021/cb0500015. [DOI] [PubMed] [Google Scholar]
- 55.Darveau RP, Pham T-TT, Lemley K, Reife RA, Bainbridge BW, Coats SR, Howald WN, Way SS, Hajjar AM. 2004. Porphyromonas gingivalis lipopolysaccharide contains multiple lipid A species that functionally interact with both Toll-like receptors 2 and 4. Infect Immun 72:5041–5051. doi: 10.1128/IAI.72.9.5041-5051.2004. [DOI] [PMC free article] [PubMed] [Google Scholar]
- 56.Gibbons HS, Kalb SR, Cotter RJ, Raetz CRH. 2005. Role of Mg2+ and pH in the modification of Salmonella lipid A after endocytosis by macrophage tumour cells. Mol Microbiol 55:425–440. [DOI] [PubMed] [Google Scholar]
- 57.Kulichevskaya IS, Baulina OI, Bodelier PLE, Rijpstra WIC, Damsté JSS, Dedysh SN. 2009. Zavarzinella formosa gen. nov., sp. nov., a novel stalked, Gemmata-like planctomycete from a Siberian peat bog. Int J Syst Evol Microbiol 59:357–364. doi: 10.1099/ijs.0.002378-0. [DOI] [PubMed] [Google Scholar]
- 58.Torella JP, Ford TJ, Kim SN, Chen AM, Way JC, Silver PA. 2013. Tailored fatty acid synthesis via dynamic control of fatty acid elongation. Proc Natl Acad Sci U S A 110:11290–11295. doi: 10.1073/pnas.1307129110. [DOI] [PMC free article] [PubMed] [Google Scholar]
- 59.Cronan JE. 2003. Bacterial membrane lipids: where do we stand? Annu Rev Microbiol 57:203–224. doi: 10.1146/annurev.micro.57.030502.090851. [DOI] [PubMed] [Google Scholar]
- 60.Abe F. 2013. Dynamic structural changes in microbial membranes in response to high hydrostatic pressure analyzed using time-resolved fluorescence anisotropy measurement. Biophys Chem 183:3–8. doi: 10.1016/j.bpc.2013.05.005. [DOI] [PubMed] [Google Scholar]
- 61.Kaneda T. 1991. Iso- and anteiso-fatty acids in bacteria: biosynthesis, function, and taxonomic significance. Microbiol Rev 55:288–302. [DOI] [PMC free article] [PubMed] [Google Scholar]
- 62.Legendre S, Letellier L, Shechter E. 1980. Influence of lipids with branched-chain fatty acids on the physical, morphological and functional properties of Escherichia coli cytoplasmic membrane. Biochim Biophys Acta 602:491–505. doi: 10.1016/0005-2736(80)90328-4. [DOI] [PubMed] [Google Scholar]
- 63.Gill I, Valivety R. 1997. Polyunsaturated fatty acids, part 1: occurrence, biological activities and applications. Trends Biotechnol 15:401–409. doi: 10.1016/S0167-7799(97)01076-7. [DOI] [PubMed] [Google Scholar]
- 64.Gill I, Valivety R. 1997. Polyunsaturated fatty acids, part 2: biotransformations and biotechnological applications. Trends Biotechnol 15:470–478. doi: 10.1016/S0167-7799(97)01077-9. [DOI] [PubMed] [Google Scholar]
- 65.Siddiqui RA, Harvey K, Stillwell W. 2008. Anticancer properties of oxidation products of docosahexaenoic acid. Chem Phys Lipids 153:47–56. doi: 10.1016/j.chemphyslip.2008.02.009. [DOI] [PubMed] [Google Scholar]
- 66.Ando Y, Kawabata Y, Narukawa K, Ota T. 1998. Demospongic acids of the marine sponge Halichondria panicea from the coast of Hokkaido, Japan. Fish Sci 64:136–139. [Google Scholar]
- 67.Nichols DS, McMeekin TA. 2002. Biomarker techniques to screen for bacteria that produce polyunsaturated fatty acids. J Microbiol Methods 48:161–170. doi: 10.1016/S0167-7012(01)00320-7. [DOI] [PubMed] [Google Scholar]
- 68.Certik M, Shimizu S. 1999. Biosynthesis and regulation of microbial polyunsaturated fatty acid production. J Biosci Bioeng 87:1–14. doi: 10.1016/S1389-1723(99)80001-2. [DOI] [PubMed] [Google Scholar]
- 69.Ferguson GP, Roop RM Jr, Walker GC. 2002. Deficiency of a Sinorhizobium meliloti bacA mutant in alfalfa symbiosis correlates with alteration of the cell envelope. J Bacteriol 184:5625–5632. doi: 10.1128/JB.184.20.5625-5632.2002. [DOI] [PMC free article] [PubMed] [Google Scholar]
- 70.Ellens H, Siegel DP, Alford D, Yeagle PL, Boni L, Lis LJ, Quinn PJ, Bentz J. 1989. Membrane fusion and inverted phases. Biochemistry 28:3692–3703. doi: 10.1021/bi00435a011. [DOI] [PubMed] [Google Scholar]
- 71.Stillwell W, Wassall SR. 2003. Docosahexaenoic acid: membrane properties of a unique fatty acid. Chem Phys Lipids 126:1–27. doi: 10.1016/S0009-3084(03)00101-4. [DOI] [PubMed] [Google Scholar]
- 72.Wassall SR, Stillwell W. 2008. Docosahexaenoic acid domains: the ultimate non-raft membrane domain. Chem Phys Lipids 153:57–63. doi: 10.1016/j.chemphyslip.2008.02.010. [DOI] [PubMed] [Google Scholar]
- 73.Scheuner C, Tindall BJ, Lu M, Nolan M, Lapidus A, Cheng J-F, Goodwin L, Pitluck S, Huntemann M, Liolios K, Pagani I, Mavromatis K, Ivanova N, Pati A, Chen A, Palaniappan K, Jeffries CD, Hauser L, Land M, Mwirichia R, Rohde M, Abt B, Detter JC, Woyke T, Eisen JA, Markowitz V, Hugenholtz P, Göker M, Kyrpides NC, Klenk H-P. 2014. Complete genome sequence of Planctomyces brasiliensis type strain (DSM 5305T), phylogenomic analysis and reclassification of Planctomycetes including the descriptions of Gimesia gen. nov., Planctopirus gen. nov. and Rubinisphaera gen. nov. and emended descriptions of the order Planctomycetales and the family Planctomycetaceae. Stand Genomic Sci 9:10. doi: 10.1186/1944-3277-9-10. [DOI] [PMC free article] [PubMed] [Google Scholar]
- 74.Wilkinson SG, Caudwell PF. 1980. Lipid composition and chemotaxonomy of Pseudomonas putrefaciens (Alteromonas putrefaciens). J Gen Microbiol 118:329–341. doi: 10.1099/00221287-118-2-329. [DOI] [PubMed] [Google Scholar]
- 75.Moore EK, Hopmans EC, Rijpstra WIC, Villanueva L, Dedysh SN, Kulichevskaya IS, Wienk H, Schoutsen F, Sinninghe Damsté JS. 2013. Novel mono-, di-, and trimethylornithine membrane lipids in northern wetland planctomycetes. Appl Environ Microbiol 79:6874–6884. doi: 10.1128/AEM.02169-13. [DOI] [PMC free article] [PubMed] [Google Scholar]
- 76.Schroeder F, Jefferson JR, Kier AB, Knittel J, Scallen TJ, Wood WG, Hapala I. 1991. Membrane cholesterol dynamics: cholesterol domains and kinetic pools. Proc Soc Exp Biol Med 196:235–252. doi: 10.3181/00379727-196-43185. [DOI] [PubMed] [Google Scholar]
- 77.Wassall SR, Stillwell W. 2009. Polyunsaturated fatty acid-cholesterol interactions: domain formation in membranes. Biochim Biophys Acta 1788:24–32. doi: 10.1016/j.bbamem.2008.10.011. [DOI] [PubMed] [Google Scholar]
- 78.Holst O, Müller-Loennies S. 2007. Microbial polysaccharide structures, p 123–179. In Kamerling H. (ed), Comprehensive glycoscience. Elsevier, Oxford, United Kingdom. [Google Scholar]
- 79.Chart H, Rowe B. 1991. Purification of lipopolysaccharide from strains of Yersinia enterocolitica belonging to serogroups 03 and 09. FEMS Microbiol Lett 61:341–345. [DOI] [PubMed] [Google Scholar]
- 80.Palva ET, Mäkelä PH. 1980. Lipopolysaccharide heterogeneity in Salmonella Typhimurium analyzed by sodium dodecyl sulfate polyacrylamide gel electrophoresis. Eur J Biochem 107:137–143. doi: 10.1111/j.1432-1033.1980.tb04634.x. [DOI] [PubMed] [Google Scholar]
- 81.Wang X, Quinn PJ. 2010. Lipopolysaccharide: biosynthetic pathway and structure modification. Prog Lipid Res 49:97–107. doi: 10.1016/j.plipres.2009.06.002. [DOI] [PubMed] [Google Scholar]
- 82.Gronow S, Xia G, Brade H. 2010. Glycosyltransferases involved in the biosynthesis of the inner core region of different lipopolysaccharides. Eur J Cell Biol 89:3–10. doi: 10.1016/j.ejcb.2009.10.002. [DOI] [PubMed] [Google Scholar]
- 83.Jann K, Jann B. 1983. The K antigens of Escherichia coli. Prog Allergy 33:53–79. [DOI] [PubMed] [Google Scholar]
- 84.Sutherland IW. 1977. Surface carbohydrates of the prokaryotic cell. Academic Press, New York, NY. [Google Scholar]
- 85.Reife RA, Coats SR, Al-Qutub M, Dixon DM, Braham PA, Billharz RJ, Howald WN, Darveau RP. 2006. Porphyromonas gingivalis lipopolysaccharide lipid A heterogeneity: differential activities of tetra- and penta-acylated lipid A structures on E-selectin expression and TLR4 recognition. Cell Microbiol 8:857–868. doi: 10.1111/j.1462-5822.2005.00672.x. [DOI] [PubMed] [Google Scholar]
- 86.Rau H, Seydel U, Freudenberg M, Weckesser J, Mayer H. 1995. Lipopolysaccharide of Rhodospirillum salinarum 40: structural studies on the core and lipid A region. Arch Microbiol 164:280–289. doi: 10.1007/BF02529962. [DOI] [PubMed] [Google Scholar]
- 87.Hollingsworth RI, Lill-Elghanian DA. 1989. Isolation and characterization of the unusual lipopolysaccharide component, 2-amino-2-deoxy-2-N-(27-hydroxyoctacosanoyl)-3-O-(3-hydroxy-tetradecanoyl)-gluco-hexuronic acid, and its de-O-acylation product from the free lipid A of Rhizobium trifolii ANU843. J Biol Chem 264:14039–14042. [PubMed] [Google Scholar]
- 88.Bhat UR, Carlson RW. 1992. A new method for the analysis of amide-linked hydroxy fatty acids in lipid-As from Gram-negative bacteria. Glycobiology 2:535–539. doi: 10.1093/glycob/2.6.535. [DOI] [PubMed] [Google Scholar]
- 89.Rietschel ET, Zähringer U, Wollenweber HW, Miragliotta G, Musehold J, Lüderitz T, Schade U. 1984. Bacterial endotoxins: chemical structure and biologic activity. Am J Emerg Med 2:60–69. doi: 10.1016/0735-6757(84)90110-4. [DOI] [PubMed] [Google Scholar]
- 90.Moran AP, Zähringer U, Seydel U, Scholz D, Stütz P, Rietschel ET. 1991. Structural analysis of the lipid A component of Campylobacter jejuni CCUG 10936 (serotype O:2) lipopolysaccharide. Description of a lipid A containing a hybrid backbone of 2-amino-2-deoxy-d-glucose and 2,3-diamino-2,3-dideoxy-d-glucose. Eur J Biochem 198:459–469. [DOI] [PubMed] [Google Scholar]
Associated Data
This section collects any data citations, data availability statements, or supplementary materials included in this article.