

Abstract
Cross-sectional studies of patients with systemic lupus erythematosus (SLE) have demonstrated an association between activation of type I interferon (IFN) pathway and disease activity. This study examined longitudinal changes in IFN-regulated gene expression in peripheral blood using microarrays. A cross-section of 66 patients from the Autoimmune Biomarkers Collaborative Network SLE archive was evaluated. We also examined paired samples from a 15 patient subset collected during a period of low disease activity (Baseline) and at a subsequent flare event, and baseline scores of 29 patients who maintained low disease activity. IFN response (IFNr) scores were calculated from three IFN-regulated genes. Overall, higher IFNr scores were associated with increased disease activity. However, IFNr scores were not significantly different between the paired Baseline and Flare samples. An extended longitudinal analysis in 11 patients indicated little change in IFNr scores over time, even during dynamic disease activity. In patients with low disease activity, IFNr scores were not different between patients who experienced a subsequent flare and those who maintained low disease activity. In summary, although higher IFNr scores were associated with greater disease activity, IFNr scores of individual patients did not correlate with changes in disease severity or flare risk.
Keywords: gene expression, longitudinal analysis, systemic lupus erythematosus, type I interferon
Introduction
Systemic lupus erythematosus (SLE) is a chronic, systemic autoimmune disease characterised by heterogeneous clinical manifestations and disease course in different individuals. Clinically significant complications can arise in multiple organ systems including the skin, joints, blood vessels, blood cells, heart, kidneys and central nervous system. The SLE disease course can be highly variable, with some individuals maintaining low disease activity that is controlled with relatively little medication, whereas others experience periods of remission and flare that require high doses of immunosuppressive drugs. Elevated titers of IgG autoanti-bodies to various ‘self’-antigens are a common feature of SLE, and antigenic targets include constituents of the cell nucleus, such as double stranded DNA (dsDNA), small nuclear ribonucleoproteins (snRNPs), phospholipids and cell surface molecules. These auto-antibodies are thought to contribute to the immunopathology of the disease by various mechanisms1 and are thought to result from compromises in the pathways that maintain B cell tolerance.2,3 The wide variability in disease activity, organ system manifestations and response to therapy poses significant challenges to the diagnosis and management of SLE.
It has recently become apparent that SLE is commonly associated with activation of the type I interferon (IFN) pathway. Elevated levels of IFN-α had been detected in the serum of some lupus patients as early as 1979.4 More recently, we and other researchers have shown that peripheral blood cells from SLE patients had increased expression of genes that are inducible by IFN,5–8 and a correlation between serum IFN-α activity and increased gene expression has also been demonstrated.9 Elevated levels of serum proteins that are induced by IFN have also been documented in SLE patients.10 IFN ‘scores’, calculated by combining the expression level of several IFN-induced genes, were elevated in about half of adult SLE patients when compared with healthy blood donors,5,7,8 and high scores in some studies were associated with some measures of disease activity. Activation of the IFN pathway provides a reasonable mechanistic connection to the SLE disease processes. Immune complexes containing dsDNA or snRNPs have been shown to induce release of type I IFNs from plasmacytoid dendritic cells (pDCs),11,12 promoting DC maturation, T cell activation and B cell stimulation and providing a positive feedback mechanism to maintain autoantibody production.13,14 Recently, a genetic association between SLE and an important regulator of IFN signalling, the transcription factor IFN regulatory factor 5 (IRF5), has been identified.15,16 When combined with the reported appearance of lupus-like symptoms in some cancer patients treated with IFN-α,17 these observations suggest that dysregulation of type I IFN expression plays a significant role in lupus disease activity.
Although activation of the IFN pathway is associated with SLE, it is unclear whether it plays a dynamic role in disease activity or contributes primarily to predisposition to disease. Longitudinal analysis of peripheral blood cell gene expression from one patient suggested that the IFN score may correlate with changes in disease activity over time,7 although such patterns have not been consistently observed.9 In a preliminary study of 15 patients, there were increases in the IFN score that paralleled disease flare in approximately half of the patients, and other patients showed elevated IFN scores prior to flare.18 However, analysis of an independent group of 27 patients demonstrated no association between the IFN signature and longitudinal changes in SLE disease activity.19 Furthermore, examination of SLE patients and related family members has indicated a significant heritable contribution to elevated serum IFN-α activity.20 Thus, significant controversy remains over the longitudinal relationship between the IFN signature and the SLE disease activity. In this study, we used a cohort of patients from the Autoimmune Biomarkers Collaborative Network (ABCoN)21 to study the relationship between longitudinal changes in disease activity and the activation state of the IFN pathway as measured by expression of IFN response (IFNr) genes. A second goal was to determine if the IFN ‘signature’ could identify SLE patients at risk for increased disease activity. We found that the IFN score does not change with disease activity measured by two validated indices in a given patient, but it rather seems to classify SLE patients into different subgroups based on the expression level of the IFN-induced genes.
Materials and methods
Study population, samples and clinical data
SLE patients were enrolled from the Hopkins Lupus Cohort21 under the auspices of the National Institutes of Health/National Institute of Arthritis and Musculoskeletal and Skin Diseases-Sponsored ABCoN, following informed consent. The study protocol was approved by the Human Subjects Institutional Review Boards at North Shore Long Island Jewish Hospital, Johns Hopkins University School of Medicine and the University of Minnesota Medical School. Blood was collected by peripheral venipuncture using PAXgene tubes (PreAnalytix GmbH, Hombrechtikon, Switzerland).
Routine clinical visits were scheduled quarterly with interval visits scheduled when necessary due to disease activity or complications. All patients were evaluated at each visit by the same examining physician (M.P.). Detailed clinical data were available for each visit and included laboratory test results, medication profiles and other parameters necessary for measuring disease activity by both the Safety of Estrogen in Lupus: National Assessment (SELENA) revision of the SLE Disease Activity Index (SLEDAI)22 and the British Isles Lupus Assessment Group (BILAG).23
Study conduct
From the available ABCoN biorepository, samples from 66 patients were selected for RNA purification and microarray analysis of gene expression. All patients were included in the cross-sectional analysis of gene expression. The demographics of these patients in comparison with all patients included in the ABCoN archive are shown in Table 1. In a subset of these patients, ‘Baseline’ samples were selected from a period of low disease activity (SLEDAI ≤ 4) where no flare had occurred for a period of at least 60 days prior to the blood draw. This patient subset included a ‘Flare’ group (n = 15), comprised of patients who experienced a flare in the next 175 days, and a ‘No flare’ group (n = 29), comprised of patients who did not flare over the same time period. Baseline samples for both groups were matched for SLEDAI, physician’s global assessment and treatment (Table 1). A flare was defined as a SLEDAI increase of ≥4 points over the baseline level. This value of 4 has been found to be a suitable measure of clinical flare in longitudinal research.24,25 To more thoroughly assess the changes in IFNr gene expression with disease activity over time, additional longitudinal samples were evaluated from nine patients from ‘Flare’ group as described above and two patients from the initial 66 ABCoN cohort.
Table 1.
Demographic characteristics of study groups
| Characteristica | ABCoN cohort (n = 288), % or mean ± SD | This study (n = 66), % or mean ± SD | Baseline No flare (n = 29) % or mean ± SD | Baseline Flare (n = 15), % or mean ± SD | P valuea (No flare vs Flare) |
|---|---|---|---|---|---|
| Malar rash (1) | 55 | 62 | 64 | 53 | 0.52 |
| Discoid rash (2) | 20 | 17 | 18 | 7 | 0.40 |
| Photosensitivity (3) | 53 | 53 | 54 | 53 | 1.00 |
| Oral ulcers (4) | 49 | 61 | 71 | 60 | 0.51 |
| Arthritis (5) | 78 | 80 | 75 | 100 | 0.08 |
| Pleuritis (6) | 43 | 52 | 39 | 80 | 0.02 |
| Pericarditis (6) | 24 | 36 | 32 | 40 | 0.73 |
| Proteinuria (7) | 45 | 50 | 46 | 60 | 0.52 |
| Haematuria (7) | 34 | 38 | 29 | 53 | 0.18 |
| Seizure (8) | 7 | 6 | 7 | 0 | 0.53 |
| Psychosis (8) | 3 | 2 | 0 | 0 | 1.00 |
| Haemolytic anaemia (9) | 9 | 11 | 7 | 13 | 0.60 |
| Leukopenia (9) | 51 | 53 | 50 | 33 | 0.35 |
| Lymphopenia (9) | 53 | 64 | 57 | 53 | 1.00 |
| Thrombocytopenia (9) | 23 | 26 | 32 | 13 | 0.28 |
| Positive anti-dsDNA antibodies (10) | 61 | 65 | 64 | 60 | 1.00 |
| Low C3 or C4 | 65 | 76 | 86 | 73 | 0.69 |
| Anti-Sm (10) | 14 | 15 | 11 | 13 | 1.00 |
| Abnormal serological test for syphilis (10) | 21 | 20 | 25 | 27 | 1.00 |
| Anti-nuclear antibodies (11) | 97 | 98 | 96 | 100 | 1.00 |
| Age at first study visit (years) | 43 ± 11 | 41 ± 10 | 40 ± 9 | 41 ± 11 | 0.81 |
| Years of SLE since Dx | 9 ± 7 | 11 ± 8 | 10 ± 10 | 11 ± 8 | 0.99 |
| Sex female | 88 | 92 | 86 | 93 | 0.64 |
| Ethnicity | |||||
| White | 57 | 58 | 61 | 47 | 0.78 |
| African American | 36 | 33 | 21 | 47 | 0.33 |
| Other | 7 | 9 | 18 | 7 | 0.64 |
| Ever treated with | |||||
| Prednisone | 82 | 86 | 82 | 100 | 0.14 |
| Plaquenil | 80 | 85 | 82 | 80 | 1.00 |
| Immunosuppressive drugs | 25 | 59 | 15 | 27 | 0.43 |
The normal healthy volunteer (NHV) cohort comprised 27 adult donors (12 male, 15 female, age 22–60 years) who provided blood samples after giving informed consent.
Gene expression analysis
Human Genome CGH 44A microarrays (Agilent Technologies, Palo Alto, California, USA) were used to determine IFNr gene expression. These cyanine 3-CTP/5-CTP (Cy3/Cy5) chips contain 41,675 probes (60 mers) that represent most of the genes found in the REFSEQ database (National Center for Biotechnology Information); additional genes on the chip represented various housekeeping and alignment controls. The chips were run as recommended by the manufacturer and scanned using an Agilent DNA microarray scanner. Briefly, 200 ng of total RNA isolated from the PAXgene blood sample was labelled with Cy5. The reference RNA, a pool of PAXgene derived RNA samples from 10 healthy donors, was labelled with Cy3. Complementary RNA was created using Agilent Low RNA Input Fluorescent Linear Amplification Kit protocol version 2.0 and purified using Qiagen (Valencia, CA, USA) RNeasy purification kit. Following standard Agilent microarray protocol, 750 ng of Cy5 and Cy3 samples were combined, fragmented and hybridised onto microarrays overnight. The slides were washed, scanned at 10 um resolution and feature extracted using Agilent software version A 7.5.1.
Single channel microarray data derived from Agilent Feature Extraction ver 7.5 (BgSubSig) for samples from NHV (n = 27) and the 66 lupus patients (n = 111) were combined and quantile normalised.28 Log transformed data from multiple probes for the same gene were averaged for the calculation of IFNr score.
IFNr score calculation
The IFNr score was calculated using three genes: IFI27, OAS3 and IFI44, to capture a broad measure of IFN-induced gene expression that would be less susceptible to technical fluctuations than would be a single gene assay. These genes were chosen because they are known to be regulated by type I IFN, and their expression levels were highly correlated with each other in this sample set. IFI27 was observed to have the largest range of variation in this patient population. OAS3 and IFI44 have been described in the literature to be upregulated in SLE patients.29 The method used closely follows a previously described scoring system that can be applied to either microarray data or quantitative polymerase chain reaction (qPCR) data as it is independent of numerical scale.29,30 The mean and SD were calculated from array data for each of the three genes using RNA from 27 NHVs. For each patient, a z-score was calculated for each gene by subtracting the NHV mean from the patient expression value for that gene and then dividing the difference by the NHV SD. The z-scores for the three genes were then averaged to produce a final composite score for each patient.
Statistical analysis
IFNr scores were compared between paired baseline samples and Flare samples using the two-tailed paired t-test to assess changes in the IFNr score from the low disease activity to increased disease activity stage. We also tested the hypothesis that the IFNr score in samples from a period of low disease activity would distinguish patients who have a future episode of flare from patients that remain stable (No flare) using the two-tailed two-sample t-test as well as the non-parametric Wilcoxon (Mann–Whitney U) test. ANOVA with repeated measures was used to compare changes in SLEDAI and IFNr scores for the first three visits of the 11 patients who contributed more than two longitudinal samples. The clinical parameters of the high and low IFNr score groups (36 high, 30 low) were compared by ratio and P value as determined by Fisher’s exact test for the presence or absence of a SLEDAI value in a given group. The significance of the difference in averages of parametric values, such as white blood cell (WBC) count, was determined by Student’s t-test.
Results
Expression of IFN pathway genes is associated with disease activity in SLE patients
To investigate the correlation between IFN pathway activation and SLE disease activity, whole blood RNA samples were selected from 66 patients from the ABCoN archive21 and gene expression was evaluated using Agilent Human Genome CGH 44A microarrays. Expression levels of genes known to be regulated by type I IFN5,6,31,32 and differentially regulated in SLE5,6,8,25 showed a high degree of correlation with each other. IFI27 is a type I IFN inducible gene33 that showed the highest degree of variation in this sample set, and the expression levels of 139 genes were correlated with IFI27 with an absolute r ≥ 0.5. To evaluate the expression of IFN-regulated genes in various samples, an IFNr score was calculated from the expression level of three IFN-regulated genes, IFI27, IFI44 and OAS3 (see Materials and methods section), to minimise the variability associated with measuring just a single gene. Using expression data from this study, the score generated by this algorithm was compared with the scores generated by algorithms that have been used in other studies using different sets of IFN-regulated genes.5,7,30 A high degree of correlation was observed between these different IFNr scores (Table 2) suggesting that each provides a similar measure of IFN-α pathway activation.
Table 2.
Correlation of different IFN response (IFNr) score algorithms
The distribution of our three genes IFNr score for all subjects in this study compared with a cohort of NHVs is shown in Figure 1. The distribution of IFNr scores suggests the presence of IFNr low and high groups. Since our IFNr score calculation is based on a z-score analysis, a score of 2 (dashed line in Figure 1) would represent a combined expression level 2 SDs above the mean NHV score and would be expected to have a frequency of about 5% in a normal population. As expected, two (7%) of the 27 NHV subjects have a score slightly above this cut-off. In contrast, 38 (58%) of the 66 SLE patients have IFNr scores greater than 2. Using a value ≥2 to define high IFNr scores, we observed significantly greater disease activity as measured by SLEDAI in patients who are in the high IFNr group as compared with patients with low IFNr scores (P = 2.3 × 10⁻⁴, Table 3). Specific components of disease activity that were significantly increased in the high IFNr group included low complement, increased DNA binding, high erythrocyte sedimentation rate, low WBC count and increased renal disease (P < 0.05). IFNr scores and anti-dsDNA titers had a Pearson correlation of 0.45. The high IFNr group tended to be enriched for patients who have a history of anti-Sm, anti-Ro/SSA and anti-RNP autoantibodies, but this trend reached significance only for anti-Sm and anti-RNP.
Figure 1.
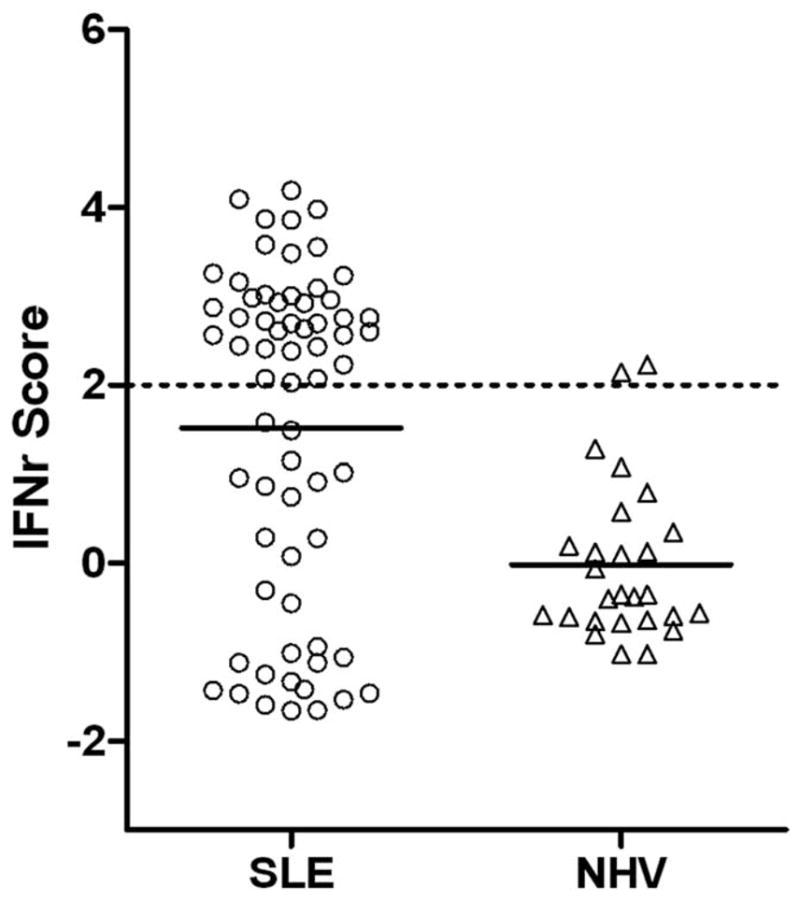
The distribution of interferon response (IFNr) scores in 66 SLE patients and 27 normal healthy volunteers (NHV). IFNr scores were calculated from microarray data as described in Materials and methods section. When multiple samples were available for a subject, data from the first available sample were used to calculate the IFNr score. The mean score for each group is indicated by the solid horizontal bar and a IFNr score of 2 is indicated by a dashed line.
Table 3.
Relationship of interferon response (IFNr) score to clinical parameters
| IFNr score
|
||||
|---|---|---|---|---|
| Clinical variable | Low | High | Ratio High/Low | P value |
| SLEDAI components | ||||
| Total score (mean) ± SD | 2.1 ± 2.0 | 3.8 ± 2.1 | 1.8 | 2.33E-04 |
| Haematuria | 20.0% | 22.0% | 1.1 | 1.000 |
| Proteinuria | 3.0% | 8.3% | 2.8 | 0.620 |
| Pyuria | 10.0% | 19.0% | 1.9 | 0.490 |
| SLEDAI renal components/all renal components | 14/892 | 43/1164 | 2.4 | 1.53E-03 |
| Low complement | 6.6% | 19.0% | 2.9 | 0.290 |
| Increase DNA binding | 8.0% | 25.0% | 3.1 | 0.041 |
| Malar rash | 20.0% | 33.3% | 1.7 | 0.430 |
| Physician global estimate (0–3) | 0.86 ± 0.46 | 0.92 ± 0.48 | 1.07 | 0.602 |
| Clinical values during study | ||||
| HCT (%) | 39.4 ± 3.4 | 37.4 ± 4.1 | 0.95 | 0.036 |
| WBC (×1000/uL) | 6.8 ± 2.3 | 4.6 ± 1.4 | 0.7 | 1.07E-05 |
| LYMPH (×1000/uL) | 1.6 ± 0.7 | 0.95 ± 0.4 | 0.6 | 1.07E-04 |
| ESR (mm/h) | 22.0 ± 20.0 | 35.7 ± 21.3 | 1.6 | 0.038 |
| Urinary protein (g/24 h) | 0.43 ± 0.7 | 0.61 ± 0.8 | 1.5 | 0.360 |
| C3 (mg/dL) | 118 ± 28.9 | 83.9 ± 20.9 | 0.7 | 5.88E-07 |
| C4 (mg/dL) | 15.3 ± 5.7 | 21.7 ± 9.4 | 0.7 | 3.52E-04 |
| DNA binding (units/ml) | 8.4 ± 28.2 | 119.5 ± 165 | 14.2 | 7.04E-04 |
| Tx any immunosuppressive drug | 46.6% | 63.9% | 1.4 | 0.420 |
| Tx with cellcept | 10.0% | 33.0% | 3.3 | 0.086 |
| Patient history of | ||||
| Increased DNA binding | 47.0% | 81.0% | 1.7 | 0.231 |
| Leukopenia | 43.0% | 61.0% | 1.4 | 0.047 |
| Anti-Sm antibodies | 3.0% | 25.0% | 8.3 | 0.041 |
| Anti-Ro/SSA antibodies | 17.0% | 47.9% | 2.8 | 0.079 |
| Anti-La/SSB antibodies | 7.0% | 19.0% | 2.7 | 0.285 |
| Anti-RNP | 10.0% | 39.0% | 3.9 | 0.051 |
| Renal biopsy ever (%) | 20.0% | 28.0% | 1.4 | 0.140 |
| Hospitalisations (SLE ever) | 57.0% | 72.0% | 1.3 | 0.559 |
| Demographics | ||||
| % Female | 90.0% | 94.4% | 1.05 | 0.657 |
| % White | 63.3% | 52.8% | 0.83 | 0.687 |
| % Black | 33.3% | 33.3% | 1.00 | 1.000 |
| % Asian | 0.0% | 8.3% | NA | 0.251 |
| % Hispanic | 0.0% | 2.8% | NA | 1.000 |
| Age (years) | 42.5 ± 8.6 | 40.3 ± 11.3 | 0.95 | 0.410 |
| Weight (pounds) | 186 ± 41 | 145 ± 32 | 0.78 | 2.07E-05 |
Abbreviations: ESR: erythrocyte sedimentation rate; HCT: hematocrit; WBC: white blood count; SLEDAI: SLE Disease Activity Index.
Values are based on 66 patients (30 IFNr low and 36 IFNr high) studied by microarray. Renal SLEDAI components were scored per visit. If at any study visit the component was positive, the patient was considered positive for that component. The percentages represent the number of either low or high IFNr patients that scored positive for that component. The P values were calculated based on Fisher’s exact test. Parametric values are averages from all study visits of each patient and were evaluated using Student’s t-test. There were 512 study visits by the 66 patients in the study.
IFNr scores do not change with increasing disease activity
To investigate the correlation between IFN pathway activation and changes in SLE disease activity, 15 paired samples were selected from the ABCoN sample archive comprised of a baseline sample from a period of low disease activity (SLEDAI ≤ 4) and a sample associated with a SLE flare event (SLEDAI increase ≥4) within the next 175 days. Although disease activity of the Flare samples (mean SLEDAI = 8.9 ± 3.2) was higher than baseline samples (mean SLEDAI = 2.2 ± 3.2), the mean IFNr score for the baseline samples (1.7 ± 1.9) was not significantly different from that of the flare visit samples (1.6 ± 2.0; paired t-test P = 0.78). IFNr scores of most individual patients (Figure 2B) were similar at the two time points.
Figure 2.

Interferon response (IFNr) scores do not consistently change with increasing disease activity. (A) SELENA SLE Disease Activity Index (SLEDAI) for 15 paired samples is plotted for a period of low disease activity (Baseline) and a flare event (Flare) following within 175 days (range 56–175). Fewer than 15 data points are visible at each timepoint because of coincident scores. (B) IFNr scores calculated from microarray data generated from blood samples collected at the same time as the clinical data used in (A).
To further examine the dynamic nature of the IFNr score and its correlation with disease activity, we analysed longitudinal samples from 11 patients who had three or more samples available (Figure 3A–K). Although all patients experienced significant changes in disease activity at some point during the observational period, as measured by either the SELENA-SLEDAI or BILAG, IFNr scores tended to remain constant. Disease activity increased in patients with IFNr scores in both the low (Figure 3B) and high range (Figure 3C) without an appreciable change in IFN pathway activity. Changes in IFNr score were noted in two patients, but the pattern was not consistent with respect to the disease activity. The IFNr score for one of these two patients (Figure 3E) decreased with decreasing disease activity and increased with a subsequent increase in disease activity. In contrast, the IFNr score for the second patient (Figure 3H) increased, whereas disease activity remained low and was decreased at the subsequent visit where increased disease activity was noted. Repeated measures ANOVA was done on the first three visits for these 11 patients. The results showed that although changes in the SELENA-SLEDAI measure with time are highly significant (P = 0.0066), the changes in the IFNr score are not significantly different with time (P = 0.78). This indicates that the IFNr score is a relatively stable characteristic of the individual patient and does not change with the disease activity.
Figure 3.

Longitudinal interferon response (IFNr) scores do not correlate with the disease activity in individual patients. IFNr scores were monitored in blood samples collected along with clinical data from 11 patients over a period of several months. Disease activity is indicated by both the SELENA SLE Disease Activity Index (SLEDAI) and a numerical conversion of the British Isles Lupus Assessment Group (BILAG) index.34
IFNr scores do not distinguish patients at risk for impending disease flare
The association between IFN pathway activation and risk of SLE flare was evaluated by comparing baseline samples of the Flare group with samples from a second group of 29 patients who also had low disease activity, but who maintained low disease activity and did not experience a flare over this same time period (No flare group). No significant differences were observed between the baseline samples of the Flare and No flare patients with respect to age, gender, immunosuppression medication regimens and mean daily steroid use (Table 1). The mean IFNr score for the baseline sample of 29 patients in the No flare group (1.5 ± 1.7) was not significantly different from that of the baseline of the 15 patients in the Flare group (1.7 ± 1.9) (t-test, P = 0.83). This result suggests that the IFN gene expression signature may not be predictive of impending flare over a 175-day window.
Discussion
Although elevated levels of IFN-α in the sera of SLE patients were first noted in 1979,4 interest in the role of type I IFN in the pathogenesis of SLE has considerably increased recently. An association between IFN-α pathway activation and SLE has been demonstrated by a variety of techniques, including (1) increased expression of IFN-regulated genes in peripheral blood cells,5,6,8,25,29 (2) increased serum IFN-α activity9 and (3) elevated serum levels of IFN-regulated chemokines.11 These different measures of IFN-α pathway activation provide a similar cross-sectional description of adult SLE patients, where about half of the population exhibits evidence of IFN pathway activation, and the ‘IFN high’ phenotype is associated with greater disease activity. Our analyses, which used an algorithm based on expression levels of three IFN-regulated genes to monitor IFN pathway activation, confirm these previous observations, showing that a cross-section of SLE patients had a range of IFNr scores, and higher scores are associated with low complement, high anti-dsDNA, higher sedimentation rates and more renal complications.
Studies attempting to address the longitudinal relationship between the IFN signature and changes in SLE disease activity have yielded conflicting results.7,9,18,19 IFN pathway activation in these previous studies was measured by quantitative reverse transcriptase-PCR using RNA from either peripheral blood mononuclear cell7,9,18 or whole blood,19 and different methods have been used to calculate an IFN score. Our study used RNA from whole blood and measured gene expression by microarray analysis. Although gene expression analysis using microarrays is thought to be less precise than quantitative real-time PCR (qRT-PCR), there is a high degree of correlation between the two techniques35 and both have similar patterns in cross-sectional studies. Limited sample size is more likely to contribute to different results in a heterogeneous disease like SLE. The results of our longitudinal study replicate those of Landolt-Marticorena, et al.19 and indicate that longitudinal IFNr scores in samples from the same patient show no correlation with changes in disease activity. In the large majority of the patients in our study, the IFNr score was quite constant and did not change with increasing disease activity. In the few patients in whom the IFNr score did exhibit change over time, there was no consistent correlation with the directional change in SELENA-SLEDAI values. These observations suggest that expression of IFN responsive genes is not a dynamic component of the SLE disease process, but rather is a relatively stable characteristic of the individual and may reflect an inherent activation state of the IFN pathway. Although the IFNr score in individual patients apparently can change, and previous studies have shown that high doses of corticosteroids seem to reduce IFN pathway activation,6,7 it is not clear what other factors can influence the IFNr score or what level of change represents a significant change in the state of IFN pathway activation.
Several strengths of our study make it an important replication of the previous report that changes in SLE disease activity are not accompanied by concurrent changes in the IFN gene expression signature.19 The same examining physician evaluated each patient in our study at every visit, eliminating inter-observer differences in scoring of disease activity. Our study used a set of three IFN-regulated genes that were distinct from those used in the previous report, suggesting that their result was not dependent on the specific set of genes used to define the IFNr score. Furthermore, our method for IFNr score calculation ensures equal weighting of each gene, preventing any single gene from dominating the score calculation.
These observations are also consistent with recent results which indicated a significant heritable contribution to level of serum IFN-α activity.20 In that study, SLE patients with high serum IFN-α activity were much more likely to have close healthy relatives with high activity compared with unrelated healthy individuals. The healthy relatives rarely had measurable levels of SLE-associated autoantibodies even if they had high serum IFN-α activity, suggesting that the IFN pathway activation in those individuals was not caused by immune complex stimulation. Similarly, genetic variants of the IRF5 and PTPN22 genes that are associated with the risk of developing SLE have also been shown to be associated with higher levels of serum IFN activity in SLE patients.36,37 The expression of IFN responsive genes has been noted to be quite variable in a cross-sectional survey of gene expression in blood samples from healthy donors,38 again demonstrating that inherent activation of the IFN system does not necessarily have clinical cause or consequences. The baseline activation state of the IFN pathway may reflect heritable variation in host defence systems, which perhaps can provide some protective advantage to infection. Differences in IFN pathway activation have been shown to be associated with the species-specific susceptibility to the pathological effects of Simian immunodeficiency virus or HIV infection.39 However, such adaptations may lead to an increased risk of autoimmune disease.
This study is somewhat limited by a relatively small sample size from a single study centre. However, samples were selected for the pattern of disease activity without prior knowledge of the gene expression results. The distribution of the IFNr scores and the association of high scores with increased disease activity observed in this study are very consistent with observations that have been made previously, suggesting that our study cohort is not particularly unusual. The changes in disease activity evaluated in this study, increases in the SELENA-SLEDAI score between 4 and 12, would be considered mild to moderate flares22 and did not address severe disease. However, this also minimised the confounding influence that could be associated with overt tissue damage.40 Additionally, even though our longitudinal study failed to show a correlation between IFN gene scores and disease activity with samples collected an average of every 3 months, further studies with more frequent sample collection will be necessary to determine whether there are more consistent fluctuations of the IFN gene score when observed over a shorter window of time.
A number of studies have now well established an association between SLE and enhanced activity of the IFN-α system. Some of the biological effects of IFN-α, such as induction of dendritic cell and B cell maturation41,42 and T cell activation,43 provide a number of ways by which immune tolerance might be overcome, and the ability of autoantibody immune complexes to induce IFN-α production by pDCs established a means for perpetuating the autoimmune cycle.11,12 Additional studies will be required to determine how best to monitor IFN pathway activity and how these tools can be used to help manage SLE disease.
Acknowledgments
The Hopkins Lupus Cohort is supported by NIH AR 43727 and the Johns Hopkins University School of Medicine General Clinical Research Center MOI-RR00052. This study was also supported by the National Institute of Arthritis, Musculoskeletal and Skin Diseases contract N01-AR-1-2256. Dr Dedrick and Dr Fry are employees of XDx, Inc. Dr Behrens and Dr Lal are employees of Genentech Inc.
References
- 1.Kotzin BL. Systemic lupus erythematosus. Cell. 1996;85:303–306. doi: 10.1016/s0092-8674(00)81108-3. [DOI] [PubMed] [Google Scholar]
- 2.Jacobi AM, Diamond B. Balancing diversity and tolerance: lessons from patients with systemic lupus erythematosus. J Exp Med. 2005;202:341–344. doi: 10.1084/jem.20050221. [DOI] [PMC free article] [PubMed] [Google Scholar]
- 3.Lipsky PE. Systemic lupus erythematosus: an autoimmune disease of B cell hyperactivity. Nat Immunol. 2001;2:764–766. doi: 10.1038/ni0901-764. [DOI] [PubMed] [Google Scholar]
- 4.Hooks JJ, Moutsopoulos HM, Geis SA, Stahl NI, Decker JL, Notkins AL. Immune interferon in the circulation of patients with autoimmune disease. N Engl J Med. 1979;301:5–8. doi: 10.1056/NEJM197907053010102. [DOI] [PubMed] [Google Scholar]
- 5.Baechler EC, Batliwalla FM, Karypis G, et al. Interferon-inducible gene expression signature in peripheral blood cells of patients with severe lupus. Proc Natl Acad Sci U S A. 2003;100:2610–2615. doi: 10.1073/pnas.0337679100. [DOI] [PMC free article] [PubMed] [Google Scholar]
- 6.Bennett L, Palucka AK, Arce E, et al. Interferon and granulopoiesis signatures in systemic lupus erythematosus blood. J Exp Med. 2003;197:711–723. doi: 10.1084/jem.20021553. [DOI] [PMC free article] [PubMed] [Google Scholar]
- 7.Kirou KA, Lee C, George S, Louca K, Peterson MG, Crow MK. Activation of the interferon-alpha pathway identifies a subgroup of systemic lupus erythematosus patients with distinct serologic features and active disease. Arthritis Rheum. 2005;52:1491–1503. doi: 10.1002/art.21031. [DOI] [PubMed] [Google Scholar]
- 8.Nikpour M, Dempsey AA, Urowitz MB, Gladman DD, Barnes DA. Association of a gene expression profile from whole blood with disease activity in systemic lupus erythematosus. Ann Rheum Dis. 2007;67:1069–1087. doi: 10.1136/ard.2007.074765. [DOI] [PubMed] [Google Scholar]
- 9.Hua J, Kirou K, Lee C, Crow MK. Functional assay of type I interferon in systemic lupus erythematosus plasma and association with anti-RNA binding protein autoantibodies. Arthritis Rheum. 2006;54:1906–1916. doi: 10.1002/art.21890. [DOI] [PubMed] [Google Scholar]
- 10.Bauer JW, Baechler EC, Petri M, et al. Elevated serum levels of interferon-regulated chemokines are biomarkers for active human systemic lupus erythematosus. PLoS Med. 2006;3:e491. doi: 10.1371/journal.pmed.0030491. [DOI] [PMC free article] [PubMed] [Google Scholar]
- 11.Savarese E, Chae OW, Trowitzsch S, et al. U1 small nuclear ribonucleoprotein immune complexes induce type I interferon in plasmacytoid dendritic cells through TLR7. Blood. 2006;107:3229–3234. doi: 10.1182/blood-2005-07-2650. [DOI] [PubMed] [Google Scholar]
- 12.Vallin H, Blomberg S, Alm GV, Cederblad B, Ronnblom L. Patients with systemic lupus erythematosus (SLE) have a circulating inducer of interferon-alpha (IFN-alpha) production acting on leucocytes resembling immature dendritic cells. Clin Exp Immunol. 1999;115:196–202. doi: 10.1046/j.1365-2249.1999.00772.x. [DOI] [PMC free article] [PubMed] [Google Scholar]
- 13.Baechler EC, Gregersen PK, Behrens TW. The emerging role of interferon in human systemic lupus erythematosus. Curr Opin Immunol. 2004;16:801–807. doi: 10.1016/j.coi.2004.09.014. [DOI] [PubMed] [Google Scholar]
- 14.Schmidt KN, Ouyang W. Targeting interferon-alpha: a promising approach for systemic lupus erythematosus therapy. Lupus. 2004;13:348–352. doi: 10.1191/0961203304lu1025oa. [DOI] [PubMed] [Google Scholar]
- 15.Graham RR, Kozyrev SV, Baechler EC, et al. A common haplotype of interferon regulatory factor 5 (IRF5) regulates splicing and expression and is associated with increased risk of systemic lupus erythematosus. Nat Genet. 2006;38:550–555. doi: 10.1038/ng1782. [DOI] [PubMed] [Google Scholar]
- 16.Graham RR, Kyogoku C, Sigurdsson S, et al. Three functional variants of IFN regulatory factor 5 (IRF5) define risk and protective haplotypes for human lupus. Proc Natl Acad Sci U S A. 2007;104:6758–6763. doi: 10.1073/pnas.0701266104. [DOI] [PMC free article] [PubMed] [Google Scholar]
- 17.Gota C, Calabrese L. Induction of clinical autoimmune disease by therapeutic interferon-alpha. Autoimmunity. 2003;36:511–518. doi: 10.1080/08916930310001605873. [DOI] [PubMed] [Google Scholar]
- 18.MacDermott EJ, Cherian J, Santiago AG, et al. Type 1 interferon pathway activation predicts flares of disease activity in SLE. Arthritis Rheum. 2008;58:3974–3975. [Google Scholar]
- 19.Landolt-Marticorena C, Bonventi G, Lubovich A, et al. Lack of association between the interferon-alpha signature and longitudinal changes in disease activity in systemic lupus erythematosus. Ann Rheum Dis. 2008 doi: 10.1136/ard.2008.093146. [DOI] [PubMed] [Google Scholar]
- 20.Niewold TB, Hua J, Lehman TJ, Harley JB, Crow MK. High serum IFN-alpha activity is a heritable risk factor for systemic lupus erythematosus. Genes Immun. 2007;8:492–502. doi: 10.1038/sj.gene.6364408. [DOI] [PMC free article] [PubMed] [Google Scholar]
- 21.Petri M. Hopkins Lupus Cohort. 1999 update. Rheum Dis Clin North Am. 2000;26:199–213 v. doi: 10.1016/s0889-857x(05)70135-6. [DOI] [PubMed] [Google Scholar]
- 22.Petri M, Kim MY, Kalunian KC, et al. Combined oral contraceptives in women with systemic lupus erythematosus. N Engl J Med. 2005;353:2550–2558. doi: 10.1056/NEJMoa051135. [DOI] [PubMed] [Google Scholar]
- 23.Symmons DP, Coppock JS, Bacon PA, et al. Members of the British Isles Lupus Assessment Group (BILAG) Development and assessment of a computerized index of clinical disease activity in systemic lupus erythematosus. Q J Med. 1988;69:927–937. [PubMed] [Google Scholar]
- 24.Gladman DD, Urowitz MB, Kagal A, Hallett D. Accurately describing changes in disease activity in systemic lupus erythematosus. J Rheumatol. 2000;27:377–379. [PubMed] [Google Scholar]
- 25.Han GM, Chen SL, Shen N, et al. Analysis of gene expression profiles in human systemic lupus erythematosus using oligonucleotide microarray. Genes Immun. 2003;4:177–186. doi: 10.1038/sj.gene.6363966. [DOI] [PubMed] [Google Scholar]
- 26.Hochberg MC. Updating the American College of Rheumatology revised criteria for the classification of systemic lupus erythematosus. Arthritis Rheum. 1997;40:1725. doi: 10.1002/art.1780400928. [DOI] [PubMed] [Google Scholar]
- 27.Tan EM, Cohen AS, Fries JF, et al. The 1982 revised criteria for the classification of systemic lupus erythematosus. Arthritis Rheum. 1982;25:1271–1277. doi: 10.1002/art.1780251101. [DOI] [PubMed] [Google Scholar]
- 28.Bolstad BM, Irizarry RA, Astrand M, Speed TP. A comparison of normalization methods for high density oligonucleotide array data based on variance and bias. Bioinformatics. 2003;19:185–193. doi: 10.1093/bioinformatics/19.2.185. [DOI] [PubMed] [Google Scholar]
- 29.Kirou KA, Lee C, George S, et al. Coordinate overexpression of interferon-alpha-induced genes in systemic lupus erythematosus. Arthritis Rheum. 2004;50:3958–3967. doi: 10.1002/art.20798. [DOI] [PubMed] [Google Scholar]
- 30.Feng X, Wu H, Grossman JM, et al. Association of increased interferon-inducible gene expression with disease activity and lupus nephritis in patients with systemic lupus erythematosus. Arthritis Rheum. 2006;54:2951–2962. doi: 10.1002/art.22044. [DOI] [PubMed] [Google Scholar]
- 31.Der SD, Zhou A, Williams BR, Silverman RH. Identification of genes differentially regulated by interferon alpha, beta, or gamma using oligonucleotide arrays. Proc Natl Acad Sci U S A. 1998;95:15623–15628. doi: 10.1073/pnas.95.26.15623. [DOI] [PMC free article] [PubMed] [Google Scholar]
- 32.Indraccolo S, Pfeffer U, Minuzzo S, et al. Identification of genes selectively regulated by IFNs in endothelial cells. J Immunol. 2007;178:1122–1135. doi: 10.4049/jimmunol.178.2.1122. [DOI] [PubMed] [Google Scholar]
- 33.Rasmussen UB, Wolf C, Mattei MG, et al. Identification of a new interferon-alpha-inducible gene (p27) on human chromosome 14q32 and its expression in breast carcinoma. Cancer Res. 1993;53:4096–4101. [PubMed] [Google Scholar]
- 34.Ravirajan CT, Rowse L, MacGowan JR, Isenberg DA. An analysis of clinical disease activity and nephritis-associated serum autoanti-body profiles in patients with systemic lupus erythematosus: a cross-sectional study. Rheumatology (Oxford) 2001;40:1405–1412. doi: 10.1093/rheumatology/40.12.1405. [DOI] [PubMed] [Google Scholar]
- 35.Shi L, Reid LH, Jones WD, et al. The MicroArray Quality Control (MAQC) project shows inter- and intraplatform reproducibility of gene expression measurements. Nat Biotechnol. 2006;24:1151–1161. doi: 10.1038/nbt1239. [DOI] [PMC free article] [PubMed] [Google Scholar]
- 36.Kariuki SN, Crow MK, Niewold TB. The PTPN22 C1858T polymorphism is associated with skewing of cytokine profiles toward high interferon-alpha activity and low tumor necrosis factor alpha levels in patients with lupus. Arthritis Rheum. 2008;58:2818–2823. doi: 10.1002/art.23728. [DOI] [PMC free article] [PubMed] [Google Scholar]
- 37.Niewold TB, Kelly JA, Flesch MH, Espinoza LR, Harley JB, Crow MK. Association of the IRF5 risk haplotype with high serum interferon-alpha activity in systemic lupus erythematosus patients. Arthritis Rheum. 2008;58:2481–2487. doi: 10.1002/art.23613. [DOI] [PMC free article] [PubMed] [Google Scholar]
- 38.Whitney AR, Diehn M, Popper SJ, et al. Individuality and variation in gene expression patterns in human blood. Proc Natl Acad Sci U S A. 2003;100:1896–1901. doi: 10.1073/pnas.252784499. [DOI] [PMC free article] [PubMed] [Google Scholar]
- 39.Mandl JN, Barry AP, Vanderford TH, et al. Divergent TLR7 and TLR9 signaling and type I interferon production distinguish pathogenic and nonpathogenic AIDS virus infections. Nat Med. 2008;14:1077–1087. doi: 10.1038/nm.1871. [DOI] [PubMed] [Google Scholar]
- 40.Cobb JP, Mindrinos MN, Miller-Graziano C, et al. Application of genome-wide expression analysis to human health and disease. Proc Natl Acad Sci U S A. 2005;102:4801–4806. doi: 10.1073/pnas.0409768102. [DOI] [PMC free article] [PubMed] [Google Scholar]
- 41.Le Bon A, Schiavoni G, DAgostino G, Gresser I, Belardelli F, Tough DF. Type i interferons potently enhance humoral immunity and can promote isotype switching by stimulating dendritic cells in vivo. Immunity. 2001;14:461–470. doi: 10.1016/s1074-7613(01)00126-1. [DOI] [PubMed] [Google Scholar]
- 42.Jego G, Palucka AK, Blanck JP, Chalouni C, Pascual V, Banchereau J. Plasmacytoid dendritic cells induce plasma cell differentiation through type I interferon and interleukin 6. Immunity. 2003;19:225–234. doi: 10.1016/s1074-7613(03)00208-5. [DOI] [PubMed] [Google Scholar]
- 43.Marrack P, Kappler J, Mitchell T. Type I interferons keep activated T cells alive. J Exp Med. 1999;189:521–530. doi: 10.1084/jem.189.3.521. [DOI] [PMC free article] [PubMed] [Google Scholar]