Abstract
We have investigated and compared a number of sample conditions on different NMR platforms in the search of maximum SNR and optimal experiment time efficiency for structure elucidation and quantitation of natural products. Using restricted volume 3 mm Shigemi microcell assembly in conjunction with a 900 MHz NMR spectrometer equipped with a 5 mm carbon-sensitive inverse cryoprobe, it was possible to achieve a substantial increase in SNR (46-fold) as compared with a conventional room temperature 400 MHz instrument. Switching from standard 5 mm NMR tube to 3 mm Shigemi microcell assembly typically improved SNR by threefold on either 600 or 900 MHz cryoplatform. A quantitation method that relies on a calibrated residual protonated NMR solvent signal as internal standard was developed using the same hardware setup and restricted sample volume tubes. Linearity of the method spans over 3 orders of magnitude, from low microgram to milligram quantities. We successfully applied this method to quantify a low micrgram sample of paclitaxel, verified by a UV/VIS quantitation measurement.
Keywords: NMR, 1H, 13C, 15 N, 900 MHz, qNMR, Shigemi microcell assembly, internal standard, cryoprobe
Introduction
Natural products continue to represent an excellent source of new pharmaceuticals, accounting for at least 27% (47% if natural product mimics are included) of the all of the approved drugs on the market in 2012.[1] The structural diversity encountered in natural products is often accompanied by very low amounts of material available, posing a challenge for structure elucidation and characterization by NMR spectroscopy. Over the past several decades many technical improvements have been introduced to increase the intrinsic NMR sensitivity: optimizing the sample volume for specific availability or solubility of a given sample, increasing the external magnetic field strength (currently standing at 23.5 T), and optimizing the probe quality factor (Q factor) and RF coil geometry. Other efforts aimed at further increasing sensitivity limits include spin polarization and dynamic nuclear polarization transfer methodology.[2,3]
Probe performance contributes significantly to the overall instrument performance. Research into probe performance has led to a reduction in probe diameter,[4–8] cryogen cooled probes (cryoprobes),[9,10] and development of capillary probes with nanoliter to microliter-size active volumes.[11,12] More recently, efforts in probe development have resulted in commercial availability of microcryoprobes.[8,13]
Another approach to increase the SNR is to restrict the entire sample volume into the active volume of the RF probe coil, thus increasing mass sensitivity. Restrictive volume NMR tubes are readily available from Shigemi Inc. and Wilmad-Labglass. Microcell assemblies, consisting of a glass tube and a plunger, reduce the solvent volume by approximately half for the same tube diameter. Glass material matched to the magnetic susceptibility properties of the solvent is used to fill the bottom compartment of the tube as well as the plunger. Additional gains in sensitivity can be achieved by using sample tubes of smaller diameter then the corresponding probe coil diameter, further reducing the thermal noise at the expense of fill factor.[14]
While these sensitivity gains can be appreciable, collecting NMR data on limited sample quantities still involves long data collection times, eventually exceeding instrument detection limits or becoming simply cost prohibitive below certain sample concentration. In addition, low-abundant samples (microgram or nanogram) are difficult to analyze by classical analytical methods. Unless thoroughly dried or handled in an anhydrous environment, residual solvent or moisture may contribute to inaccuracies in the determination of sample weight. The use of quantitative NMR (qNMR) to measure analytes or impurities has successfully been applied in many areas of research including natural products.[15] An inherent property of NMR is that the integrated area of an NMR signal from a fully relaxed spectrum is directly proportional to the number of nuclei represented by a peak integral.[16] Experimental conditions required for acquisition of qNMR spectra have been described in great detail.[17]
In general, a single well-characterized external or internal reference compound is used to compare the concentrations of analytes present in an NMR sample.[18–20] Alternatively, the residual protons from the deuterated NMR solvent itself can be used as an internal standard or an electronic signal handled by software (QUANTAS).[21–24] Concentration of analytes dissolved in the solvent can be calculated by comparing the integral of the solvent peak to the appropriate integrals of protons from the compounds in solution. Thus, molar concentration of compounds in solution can be determined without any prior knowledge of molecular weight and/or other physical properties of the solute.
Our research is focused on isolation and characterization of natural products from cultured cyanobacteria, where we often encounter only submilligram quantities of isolated metabolites.[25,26] Traditionally, natural product research has been supported by low to midfield NMR instrumentation. In 2004, the University of Illinois at Chicago established Center for Structure Biology with the addition of an 800 MHz cryoplatform and a 900 MHz cryoplatform to supplement an existing 600 MHz platform.[27] Although primarily configured for protein research, we have utilized these high-field platforms extensively in our research.[28,29] In addition to enabling large increase in SNR, these ultrahigh-field platforms provide an increased chemical shift dispersion often required for accurate assignments and integration of proton signals.
Herein, we present a study of the sensitivity enhancement achieved using reduced diameter and restricted volume tubes when applied to standard 5 mm diameter (cryo)probes, as well as a quantification method for samples that cannot be accurately measured using a microanalytical balance. The quantitation method in restricted volume tubes is based on comparison of integrated intensity of the residual proton signal (DMSO-d5 in DMSO-d6, in this particular case) to the protons of the dissolved analyte in order to determine the concentration in solution. The demonstrated method has a linear response over 103-fold concentration range and limit of detection in nanomolar range.
Experimental section
General experimental procedures
1H NMR spectra were recorded on a Bruker Avance AV 400 equipped with BBO ATM 5 mm Z-gradient probe, Avance DRX 600 equipped with CPTXI 5 mm Z-gradient probe, and Avance AV 900 spectrometer equipped with CPTCI ATM 5 mm Z-gradient probe.
The same batch of NMR solvent (DMSO-d6 99.96% D, Sigma-Al-drich-Fluka, Corp.) was used for all measurements. Restricted volume 3 and 5 mm NMR microcell assemblies were purchased from Shigemi, Inc. Standard 5-mm tubes and 3-mm tubes were from Wilmad-Labglass (535-PP-7 and 335-PP-7, respectively), purchased through Sigma-Aldrich-Fluka Corp. Microcapillarries (1.7 mm, item #29138) and MATCH accessory kit (item #H12181) for 5-mm probes were purchased from Bruker Biospin Corp.
Sample preparation
Solutions of paclitaxel (MW = 854, MP Biomedicals, 95%, lot #1365H) in DMSO-d6 used in sensitivity study were made from a stock solution (10 mg/ml). From this solution, 20 μl aliquots were transferred in different NMR tubes, followed by the corresponding volumes of DMSO-d6 – 20 μl for 1.7 mm, 100 μl for 3 mm Shigemi, 180 μl for 3 mm, 280 μl for 5 mm Shigemi, and 580 μl for 5 mm NMR tube, respectively.
Solutions containing pyrimidine (Sigma-Aldrich-Fluka Corp., 99.9%, lot #05203JE) were prepared from a 2 M stock solution of pyrimidine in DMSO-d6, from which aliquots were transferred via automated pipette into 3 mm standard or Shigemi microcell assemblies. All spectra were collected in triplicate.
Standard solutions of paclitaxel in DMSO-d6 for qNMR measurements were made by serial dilutions of stock solutions prepared by dissolving accurately weighed samples of paclitaxel (1.40, 2.50, and 4.80 mg) in the calculated volumes of DMSO-d6. Final concentrations were 0.960, 0.500, 0.280, 0.028, and 0.007 mg/ml, respectively. Aliquots (200 μl) of each standard solution, containing 2 μl of pyrimidine, were transferred to 3 mm NMR tubes. A separate sample was prepared from a stock solution of paclitaxel (0.7 mg in 10 ml of HPLC grade MeOH (Thermo-Fisher, lot # 081717)) by taking a 100 μl aliquot into a microcuvette and measuring the absorbance (A) at 227 nm on a Varian CARY 50 UV/VIS spectrophotometer. Sample concentration was calculated from Lamber-Beer’s law using measured A of 1.444 and molar absorption coefficient ε = 29 800.[30] The solution was recovered from the microcuvette used, dried down in Speedvac concentrator (ThermoFisher SCP250), redissolved in 120 μl aliquot of DMSO-d6 (99.96% D, Cambridge Isotope Laboratories, lot.# 6 J-541), and transferred into DMSO-matched 3 mm Shigemi microcell assembly.
Another set of paclitaxel solutions prepared by serial dilutions of 10 and 1 mg/ml stock solutions in DMSO-d6 was used for collecting DEPTQ and 2D datasets.
Retrorsine standard (5 mg, MW = 351, Chromadex, lot #00018140-106) stock solution was prepared by dissolving contents of the sample vial in 1 ml of MeOD-d4 (99.8% D, Sigma-Aldrich-Fluka Corp.). From the stock solution, an aliquot of 130 μl was transferred directly into a 3 mm Shigemi microcell assembly. Second sample was prepared from a 65 μl aliquot of stock and an equal amount of MeOD-d4 to yield final concentration of 0.325 mg/ml.
NMR measurements
All free induction decays were acquired at room temperature (25 °C) under steady state conditions with nonspinning samples using a standard Bruker parameter sets, with either a nonselective 90° pulse or with solvent suppression utilizing excitation sculpting.[31] Chemical shifts were referenced internally to the residual DMSO-d5 (δ 2.49 ppm).
Sensitivity measurements followed established protocols for 1H sensitivity: The Bruker zgesgp pulse sequence program was used with NS = 1, DS = 0, AQ = 2.6 s, relaxation delay D1 = 20 s, and a spectral width of 12626 Hz. 1H PW90 was calibrated for each tube diameter prior to acquisition. Shaped Gaussian pulse was applied for selective excitation P12 = 2.2 ms and SP1 = 32 dB. Selection gradients GPZ1 and GPZ2 were set to 28 and 20% of maximum gradient power.
Signal-to-noise ratio was measured using ‘sinocal’ routine within XwinNMR 3.5 and Topspin 1.3 (Bruker Biospin, Billerica MA), on the H-10 signal (singlet) of paclitaxel at 6.27 ppm, using a 2 ppm noise regions (centered around −1 ppm) for SNR calculations.
Quantitative 1H measurements were collected using the same zg pulse program with the following parameters: Pulse width of 9.9 μs, (90° tip angle), DS = 2 to achieve steady state, followed by acquisition of four scans of 64 K complex points and an AQ of 3.04 s (10766 Hz spectral width). Receiver gain (rg) values of 32/256 and relaxation delay of 60 s were used for all measurements.
Free induction decays were processed in XwinNMR 3.5 or Top-spin 1.3 as follows: Fourier transformation with exponential apodization of 0.30 Hz, followed by manual phase correction and autobaseline correction (fifth-order polynomial fit). Integration ranges where kept the same (30 Hz) wherever possible, by using ‘Define new region via dialogue’ option included in the ‘Interactive Integration’ menu in Topspin software.
Spin–lattice relaxation measurements were conducted using the standard inversion recovery pulse sequence (180°-τ-90°) from the acquisition software pulse library, and the data were processed with T1/T2 relaxation module of Topspin 1.3. Gradient selected DEPTQ, HSQC, multiplicity-edited HSQC and 1H-X HMBC pulse sequences supplied with Topspin pulse library were recorded on the AV900 spectrometer operating at 900.07 MHz 1H frequency, 226.31 MHz 13C frequency, and 91.20 MHz 15 N frequency. 1H-15N HMBC pulse sequence was modified to run on the spectrometer f3 channel, using pulse width of 45 μs (90° tip angle) and F1 spectral window of 5928 Hz (65 ppm). Adiabatic 180° inversion and refocusing pulses were used in place of the rectangular 180° pulses. Gradient selection in DEPTQ was set to detect all carbon signals.
Calculation of molar concentration of paclitaxel/residual DMSO-d5
The amount of residual DMSO-d5 and paclitaxel was obtained based on the following formula for quantitative analysis of the content of the unknown[20]:
| (1) |
where Ix and Istd correspond to the integrated signal of a selected resonance for the unknown and the standard, Mx and Mstd are the molecular weights of the unknown and standard, m and mstd the weights of unknown and the standard in a sample, Nx and Nstd the number of contributing nuclei of the signals of unknown and the standard applied.
Results and discussion
Series of 1H SNR measurements were collected over a range of receiver gain values for the three spectrometers (Figs 1–3 in Supporting Inforamtion) to establish mass (molar) sensitivity and reasonable detection limits for the available NMR hardware. In particular, we were interested in obtaining further sensitivity gains by switching to smaller diameter NMR tubes, especially on the 900 MHz system equipped with 5 mm carbon sensitive cryoprobe (CPTCI), and how these compared with the 600 MHz cryoplatform and 400 MHz room temperature hardware setups. An earlier pilot study established both the mass and molar concentration sensitivity in 10-fold higher concentration range.[32] Observed maximum SNR values on individual platforms and cross-platform comparisons are summarized in Table 1.
Table 1.
Measured SNR at three different NMR spectrometers and cross-platform relations observed for different sample tube diameters loaded with 200 μg of paclitaxel
| Tube diameter | AV900 | DRX600 | AV400 | AV900/AV400 | AV900/DRX600 | DRX600/AV400 |
|---|---|---|---|---|---|---|
| 5 mm | 101 | 99 | 7 | 14 | 1.0 | 14 |
| 5 mm Shigemi | 164 | 166 | 10 | 16 | 1.0 | 17 |
| 3 mm | 186 | 130 | 7 | 27 | 1.4 | 19 |
| 3 mm Shigemi | 323 | 269 | 14 | 23 | 1.2 | 19 |
| 1.7 mm capillary | 55 | 39 | - | - | 1.4 | - |
A combination of solvent matched restricted volume microcell assembly (3 mm Shigemi tube) and 900 MHz magnet with a cryogenically cooled probe (CPTCI) resulted in maximum (46-fold) gain in sensitivity, as compared with 400 MHz room temperature spectrometer and standard 5 mm tubes used as a reference. This corresponds to a reduction in data collection time by more than 2000-fold, for a sample of the same mass. The highest available field (900 MHz) offered only a modest increase of 1.2–1.4 in SNR over the 600 MHz NMR system with a TXI cryoprobe (CPTXI), using NMR tubes of reduced diameter. This gain was derived purely from the difference in magnetic field strength and possible (small) differences in probe construction (the 600 system cryoprobe was rebuilt in 2007, while the 900 probe was among the first ever built). When using 5 mm tubes, the 600 MHz platform appeared to be as sensitive as the 900 MHz system. We noticed this behavior with other dilute samples, whereas at higher concentrations SNR reverted back to following the expected trend.[32] Reduced sample diameter and volume had the positive effect of increasing the SNR in cryo-enabled systems primarily through reduction of thermal noise. Switching from a standard 5 mm NMR tube to a 3 mm Shigemi microcell assembly typically improved SNR threefold on both the 600 and 900 MHz systems, while 3 mm regular tubes yielded moderate gains of 50–80% (Table 1). With the room temperature probe, the filling factor dominated resulting in actual decrease in SNR, as observed for 3 mm tubes in 400 MHz room temperature system. As a result of this study, most our structure elucidation work is carried out using 3 mm Shigemi microcell assemblies with matched susceptibilities for various solvents on both 600/900 MHz cryoplatforms. The price of a Shigemi tube over a standard 5 mm tube may be a limiting factors for their everyday use. In our experience, however, savings in instrument time (= usage fees) offset the cost of purchase over time. Recently, Bruker 1.7 mm NMR capillary NMR tubes have become commercially available and use about one third of the solvent of a 3 mm Shigemi tube (~35 μl), further increasing the effective concentration in the observe coil volume. We examined its possible application with 5 mm cryoprobes. Although maximum sensitivity gains are clearly achieved when it is used on a 1.7 mm microcryo platform as reported by Martin et al.[33] Reduced fill factor associated with the 1.7 mm tube becomes predominant, thus resulting in poor performance in terms of SNR.[34]
Further studies on the 900 MHz platform focused on establishing the reasonable benchmark concentration necessary to obtain 1D/2D spectra with satisfactory signal-to-noise ratio. A typical sequence of NMR experiments used in structure elucidation consists of a COSY, TOCSY, HSQC, and HMBC experiment, or their variants. Direct 13C spectra may be collected, if concentration permits, to augment data gathered from the inverse experiments. Recently, a pure shift based HSQC experiment was proposed as an effective way to characterize low-abundant samples.[35]
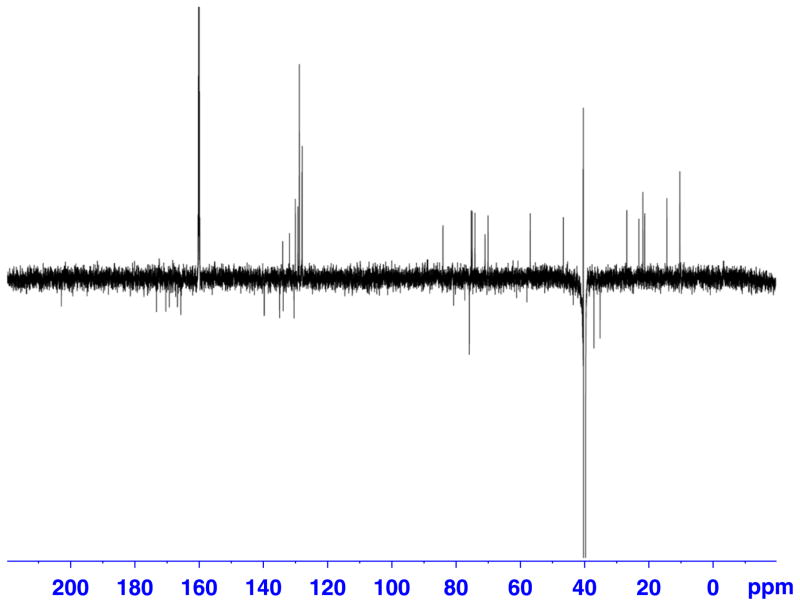
Paclitaxel was selected as a model compound, because of its molecular weight (MW = 854.3) residing in the middle of the molecular weight range typically encountered for cyanobacterial metabolites. DEPTQ[36,37] and selected examples of the collected 2D spectra with their corresponding 1D slices are shown (Figs 1–7) for a 50 μg sample of paclitaxel. Entire dataset (five experiments) for another sample containing 200 μg of paclitaxel was collected within 24 h. Sensitivity enhancement because of the polarization transfer present in the DEPT(Q) sequence is preferred over direct 13C experiment. Inverse detection of 15 N resonance via long-range couplings at natural abundance was not successful with the more concentrated sample (200 μg), even after 12 h of data collection.
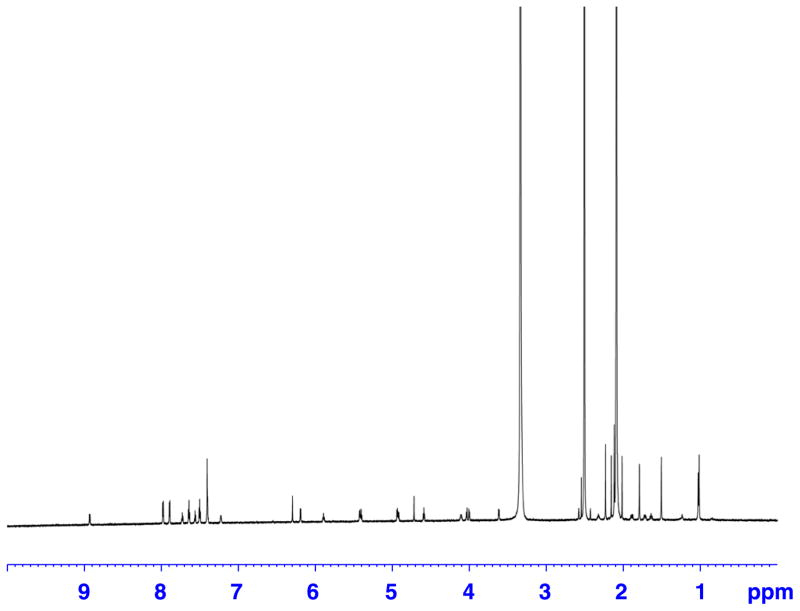
Figure 1.
Proton spectrum of a 50 μg (0.6 μl) sample of paclitaxel in 120 μl of DMSO-d6. Recorded on a Bruker Avance AV 900 spectrometer equipped with a 5 mm TCI triple resonance inverse cryoprobe using DMSO-matched 3 mm Shigemi microcell assembly.
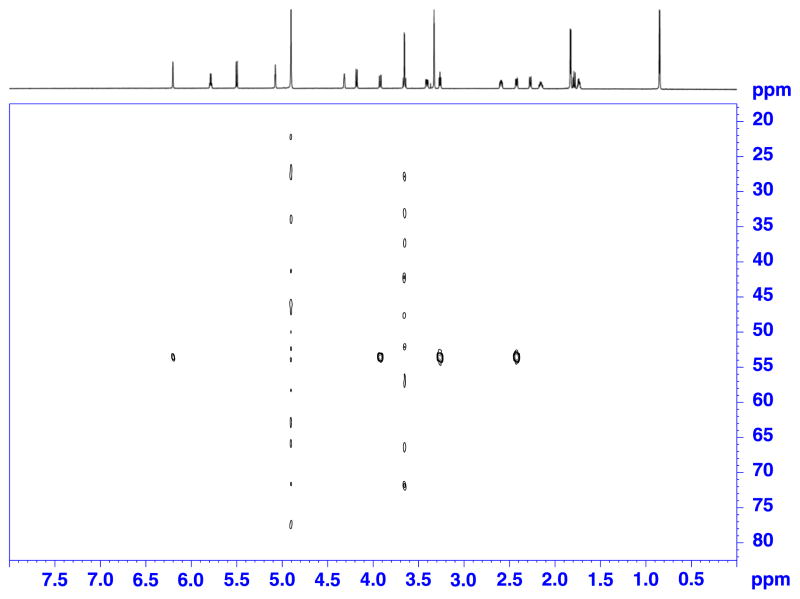
Figure 7.
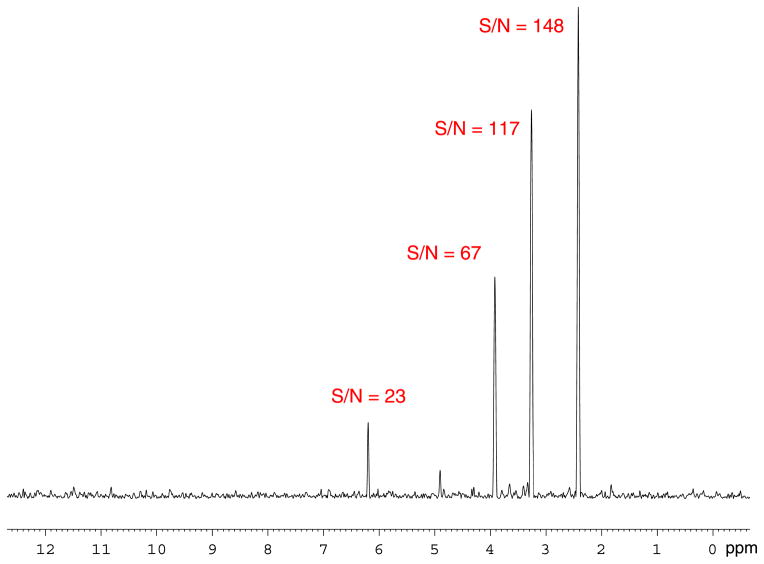
1H-15N HMBC spectrum of a 325 μg (9.25 μmol) sample of retrorsine in 120 μl of MeOD-d4. Recorded on a Bruker Avance AV 900 spectrometer equipped with a 5 mm TCI triple resonance inverse cryoprobe using DMSO-matched 3 mm Shigemi microcell assembly, with following parameters: hmbcgpndqf pulse program, NS = 256, DS = 16, D6 = 83.3 ms (long range J = 6 Hz), SW F2 = 13.37 ppm (12019 Hz), SW F1 = 65.00 ppm (5928 Hz), TD F2 = 2 K, SI F2 = 4 k, TD F1 = 64, SI F1 = 256, EXPT = 12 h 24′. Data were linear predicted in the second frequency domain to 128 points.
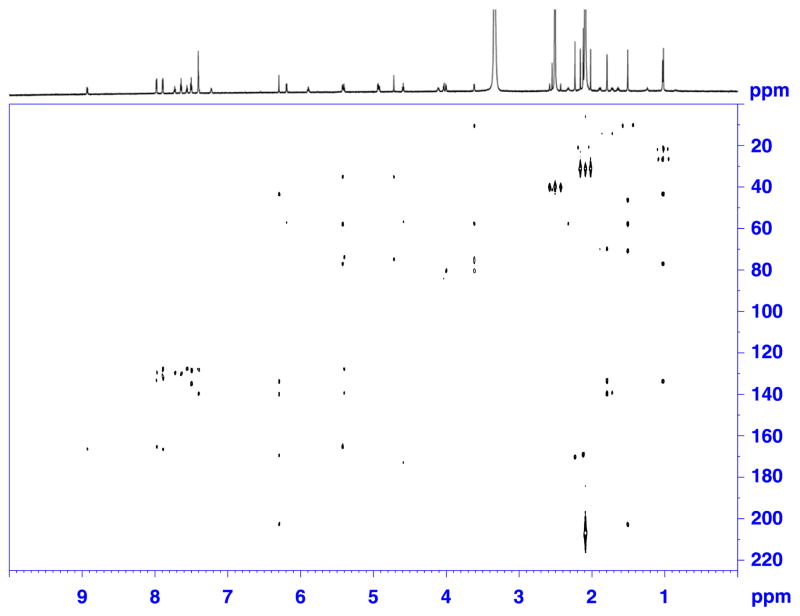
With the 50 μg sample of paclitaxel in 3 mm Shigemi microcell assembly matched for DMSO, we were able to obtain 1H-13C HMBC spectrum in 24 h (Figs 3 and 4). Direct 13C data, for this particular sample, were possible to obtain in ~ 25 h when DEPTQ experiment was applied (Fig. 2).
Figure 3.
1H-13C HMBC spectrum of a 50 μg (0.6 μmol) sample of paclitaxel in 120 μl of DMSO-d6. Recorded on a Bruker Avance AV 900 spectrometer equipped with a 5 mm TCI triple resonance inverse cryoprobe using DMSO-matched 3 mm Shigemi microcell assembly, with following parameters: hmbcgplpndqf pulse program, NS = 550, DS = 16, D1 = 1.0 s, SW F2 = 11.97 ppm (10 776 Hz), SW F1 = 223.13 ppm (50 505 Hz), TD F2 = 4 k, TD F1 = 128, SI F2 = 8 k, SI F1 = 1 k, EXPT = 1d 0 h 30′. Data were linear predicted in the second frequency domain to 512 points.
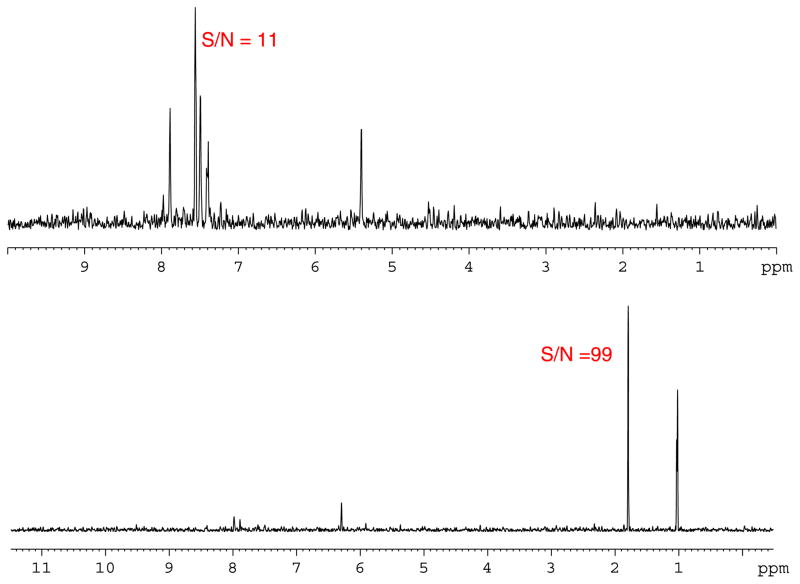
Figure 4.
1D F2 slices of the 1H-13C HMBC spectrum in Fig. 3, with SNR values for selected signals at 5.39 ppm (top) and 1.80 ppm (bottom). Noise region was set to 2 ppm.
Figure 2.
DEPTQ spectrum of a 50 μg (0.6 μmol) sample of paclitaxel in 120 μl of DMSO-d6. Recorded on a Bruker Avance AV 900 spectrometer equipped with a 5 mm TCI triple resonance inverse cryoprobe using DMSO-matched 3 mm Shigemi microcell assembly, with following parameters: deptqgpsp pulse program, SW = 239.50 ppm (54200 Hz), TD = 32 K, LB = 1 Hz, SI = 256 K, D1 = 1.5 s, NS = 48000, DS = 8, EXPT = 24 h 43′.
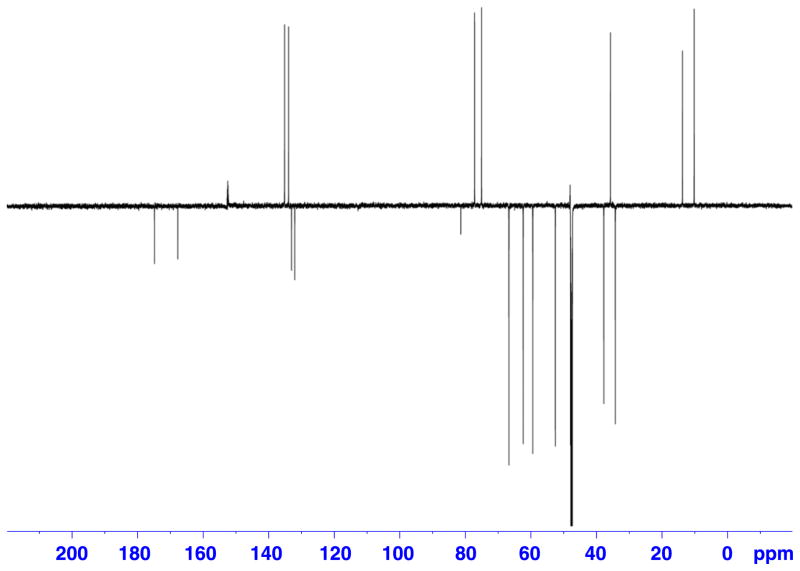
In the course of this study we found that the level of material required to produce acceptable DEPTQ spectrum in about 2 h of data collection, was 325 μg of a small molecule with MW <400 (refer to Supporting Information for retrorsine, 2, Fig. 11) in 3 mm Shigemi microcell assembly. For the same sample, 1H-15N HMBC experiment was accomplished as well in about 12.5 h (Figs 7 and 8).
Figure 8.
1D F2 slices of the 1H-15N HMBC spectrum in Fig. 7, with SNR values for selected signals at 6.20, 3.92, 3.27, and 2.42 ppm.
The majority of the isolated samples we encountered in our research were soluble in DMSO and hence could be analyzed using DMSO-d6. DMSO is a versatile solvent not only for the purposes of recording NMR spectra but also for various well-plate bioassays kits. At the same time, DMSO is a hygroscopic solvent but does not readily undergo D/H exchange. As only 100–120 μl of solvent is required per sample, we were able to use solvent with 100% (99.96%) level of deuteration, for low-microgram level samples. The use of 0.25 ml ampules, in our case, minimized the overall amount of water residue introduced in the samples. Residual solvent peak was reduced twofold to threefold compared with 99.9% D solvent, reducing potential dynamic range problem. The solvent peak still dominated the spectrum and with proper shimming 13C-satellites were well distinguished from the baseline. However, we decided to exclude them in the process of peak integration. Due to spectral complexity of the molecules encountered in the course of our research and instrument limitations (decoupling power that can be applied to cryoprobe, as well as general hardware and software limitations), we have decided not to employ GARP decoupling/pure shift HSQC approach to collapse the 13C satellites, as previously suggested.[15,24,35]
The quantity of DMSO-d5 is dependent on the isotopic enrichment having a profound effect on the amount of DMSO-d5 present. This translated into a need to determine the exact concentration of DMSO-d5 in each batch of solvent used for qNMR determinations. The concentration of DMSO-d5 in DMSO-d6 was determined by construction of a calibration curve using a known standard. Commercially available pyrimidine was used as internal standard for this purpose. As a liquid miscible with DMSO, it was easily transferred via an automatic pipette into an NMR tube. The signal of choice (H-2, singlet), appeared in a less crowded region of the spectrum, therefore permitting more accurate integration. In addition, measured T1 relaxation time for its H-2 resonance at 9.0 ppm closely matched the relaxation time of DMSO (9.2 s vs 11.7 s).
Plot of integrals measured using the paclitaxel calibration solutions (on methyl group H3-19 signal at 1.511 ppm) spiked with pyrimidine are shown in Fig. 9 (Table 2). A linear response was obtained for the concentration range between 10−3 and 1 mg, without any concentration effects. Using the integral values of the residual DMSO-d5 resulted in a similar linear response curve (Fig. 9). Subsequent quantitations were carried after the DMSO batches had been calibrated with pyrimidine solution. This reduced the dynamic range problems introduced by large pyrimidine signals in dilute sample solutions. The method can be used for concentration measurements spanning 3 orders of magnitude.
Figure 9.
NMR detector response recorded for a range of concentrations of paclitaxel standards solutions in DMSO-d6 with pyrimidine as internal standard, prepared in 3 mm NMR tubes.
Table 2.
Integral ratio values and standard deviations for data points measured for paclitaxel calibration solutions in DMSO-d6; calibration curve shown in Figure 9
| c(mg/200 μl) | Average int ration (taxol/dmso) | SD | Average int ratio (taxol/pyrimidine) | SD |
|---|---|---|---|---|
| 0.960 | 0.2472 | 0.0039 | 0.2029 | 0.0085 |
| 0.500 | 0.1404 | 0.0006 | 0.1148 | 0.0020 |
| 0.280 | 0.0603 | 0.0038 | 0.0848 | 0.0103 |
| 0.028 | 0.0060 | 0.0010 | 0.0060 | 0.0003 |
| 0.007 | 0.0010 | 0.0003 | 0.0014 | 0.0003 |
Accuracy of the NMR-based quantification method was evaluated by comparing the quantification results on a low-microgram sample of paclitaxel with those obtained by UV/VIS spectroscopy. At the same time, this sample was used to investigate the lower limit of detection on the 900 MHz cryoplatform. Both limit of detection and limit of quantitation are functions of the magnetic field, as the shape and the sharpness of the peaks greatly affect the quality of the integral measurement; i.e. the higher the resolution of the spectrometer, the lower the limits of detection and quantitation Table 3.
Table 3.
Quantitation results for paclitaxel standard in 3 mm Shigemi microcell assembly matched for DMSO under varying sample heights
| Sample Height (mm) | Integral dmso:taxol | Internal standard | Integral pyr:taxol | Average integral | Standard dev | Calculated weight (μg) |
|---|---|---|---|---|---|---|
| 20 | 0.1259 | NO | 0.1256 | 0.0004 | 145 | |
| 0.1257 | NO | |||||
| 0.1251 | NO | |||||
| 22 | 0.1264 | NO | 0.1262 | 0.0004 | 146 | |
| 0.1265 | NO | |||||
| 0.1257 | NO | |||||
| 20 | YES | 0.0518 | 0.0510 | 0.0009 | 143 | |
| YES | 0.0501 | |||||
| YES | 0.0511 |
Calculations shown are based on either residual DMSO-d5 signal or that of primary standard-pyrimidine.
Due to their separation from other signals in the spectrum and strong signal intensity the following methyl singlets were selected for quantitation of the paclitaxel sample (Table 4 and Fig. S4): methyl group H3-18 (1.796 ppm, br s, 3H), methyl group H3-19 (1.511 ppm, s, 3H), and acetyl methyl group H3-10-OAc (2.235 ppm, s, 3H). We determined the T1 relaxation times for all methyl groups selected in order to evaluate potential impact on the integral values measured. Besides relaxation, integration procedure has crucial influence on the method’s accuracy for these low-concentration samples. We removed inaccuracies usually introduced by manual integration by using the built-in integration routine.
Table 4.
Comparison of UV/VIS and 1H qNMR quantitation data obtained on the same dilute sample of paclitaxel
| Proton signal | Integral | T1(s) | d1(s) | Calculated weight (μg) | UV/VIS calculated weight (μg) |
|---|---|---|---|---|---|
| H3-19 | 0.0029 | 0.6 | 60 | 3.85 | 4.14 |
| H3-18 | 0.0030 | 2.5 | 60 | 3.98 | |
| H3-22 | 0.0029 | 4.0 | 60 | 3.85 |
All measured integral values were found to be consistent and provided values in close agreement with the quantitation data obtained through UV/VIS measurement. Sample loss during recovery and transfer into Shigemi microcell assembly may explain the difference between these two methods.
We further investigated the method robustness by introducing small changes in sample height with 3 mm Shigemi microcell assembly. The sample length dictated by the coil length was 21 mm; thus, the plunger was held in place by Teflon tape. Changes in positioning of the plunger can be introduced while handling the assembly, even unknowingly. Minor changes of ±1 mm (5% of the sample height) in the position of the plunger may go undetected; however, they could influence accuracy of the method. Results in Table 3 suggest that this level of deviation in the sample height does not lead to significant discrepancies in resonance integrals (~2% difference) and calculated amounts of quantified material.
Reproducibility of the method was assessed by performing measurements in triplicate for all of the calibration samples (Table 2). Switching from a regular NMR tube to a Shigemi microcell assembly did not to affect the reproducibility (Table 3).
Conclusions
The combination of ultrahigh-field NMR cryoplatform and reduced diameter/observed volume NMR tubes provided optimal sensitivity for recording NMR data of low-abundant samples of natural products, including direct-detected carbon spectra on submilligram quantities. A method for 1H qNMR measurements was developed based on the residual protic solvent as internal standard in the same reduced diameter NMR tube(s). The method was able to accurately detect low-microgram quantities of DMSO-soluble material, with potential to expand to other solvent-matched Shigemi microcell assemblies. Accurate quantification of samples of isolated natural products can be used as an early selection tool prior to pursuing full data acquisition on the 900 MHz platform.
Supplementary Material
Figure 5.
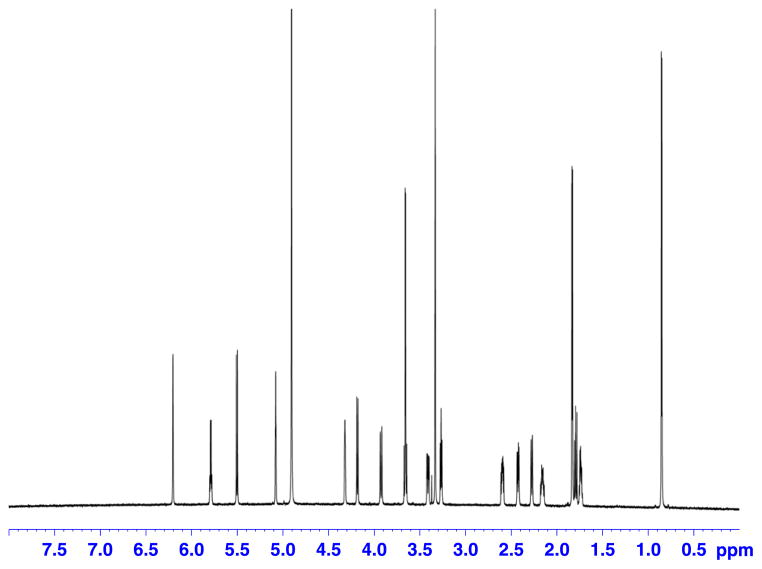
Proton spectrum of a 325 μg (9.25 μmol) sample of retrorsine in 120 μl of DMSO-d6. Recorded on a Bruker Avance AV 900 spectrometer equipped with a 5 mm TCI triple resonance inverse cryoprobe using DMSO-matched 3 mm Shigemi microcell assembly.
Figure 6.
DEPTQ spectrum of a 325 μg (9.25 μmol) sample of retrorsine in 120 μl of DMSO-d6. Recorded on a Bruker Avance AV 900 spectrometer equipped with a 5 mm TCI triple resonance inverse cryoprobe using DMSO-matched 3 mm Shigemi microcell assembly, with following parameters: deptqgpsp pulse program, SW = 239.50 ppm (54 200 Hz), TD = 64 K, LB = 3 Hz, SI = 256 K, D1 = 1.5 s, NS = 4 k, DS = 8, EXPT = 2 h 28′. SNR measured for quaternary signal at 175 ppm = 31. For protonated carbons SNR is between 100 and 140.
Acknowledgments
The authors would like to extend our thanks to Dr Benjamin Ramirez Director of the Center for Structural Biology NMR Facility at the University of Illinois at Chicago for generous access to the instrumentation. Support for the ultra-high field NMR Facility comes from NIH P41 grant GM68944 (Dr Peter G. W. Gettins). This research project is supported by NIH grants RO1GM075856 and PO1CA125066.
Footnotes
Additional supporting information may be found in the online version of this article at the publisher’s web site.
References
- 1.Newman DJ, Cragg GM. J Nat Prod. 2012;75:311. doi: 10.1021/np200906s. [DOI] [PMC free article] [PubMed] [Google Scholar]
- 2.Muelller-Warmuth W, Meise-Gresch K. Adv Magn Reson. 1983;11:1. [Google Scholar]
- 3.Dorn HC, Gu J, Bethune DS, Johnson RD, Yannoni CS. Chem Phys Lett. 1993;203:549. [Google Scholar]
- 4.Crouch RC, Martin GE. J Nat Prod. 1992;55:1343. [Google Scholar]
- 5.Brey WW, Edison AS, Nast RE, Rocca JR, Saha S, Withers RS. J Magn Reson. 2006;179:290. doi: 10.1016/j.jmr.2005.12.008. [DOI] [PubMed] [Google Scholar]
- 6.Shoolery JN. Top Carbon-13 NMR Spectrosc. 1979;3:28. [Google Scholar]
- 7.Crouch RC, Martin GE, Musser SM, Grenade HR, Dickey RW. Tetrahedron Lett. 1995;36:6827. [Google Scholar]
- 8.Hilton BD, Martin GE. J Nat Prod. 2010;73:1465. doi: 10.1021/np100481m. [DOI] [PubMed] [Google Scholar]
- 9.Styles P, Soffe NF, Scott CA, Crag DA, Row F, White DJ, White PCJ. J Magn Reson (1969) 1984;60:397. doi: 10.1016/j.jmr.2011.09.002. [DOI] [PubMed] [Google Scholar]
- 10.Kovacs H, Moskau D, Spraul M. Prog Nucl Magn Reson Spectrosc. 2005;46:131. [Google Scholar]
- 11.Webb AG. Prog Nucl Magn Reson Spectrosc. 1997;31:1. doi: 10.1016/j.pnmrs.2014.09.003. [DOI] [PubMed] [Google Scholar]
- 12.Olson DL, Lacey ME, Sweedler JV. Anal Chem. 1998;70:257A. doi: 10.1021/ac9818071. [DOI] [PubMed] [Google Scholar]
- 13.Martin GE, Hilton BD, Moskau D, Freytag N, Kessler K, Colson K. Magn Reson Chem. 2010;48:935. doi: 10.1002/mrc.2691. [DOI] [PubMed] [Google Scholar]
- 14.Martin GE, Hadden CE. Magn Reson Chem. 1999;37:721. [Google Scholar]
- 15.Pauli GF, Jaki BU, Lankin DC. J Nat Prod. 2005;68:133. doi: 10.1021/np0497301. [DOI] [PubMed] [Google Scholar]
- 16.Ernst RR, Bodenhausen G, Wokaun A. Principles of Nuclear Magnetic Resonance in One and Two Dimensions. Oxford University Press; Oxford: 1987. [Google Scholar]
- 17.Rabenstein DL, Keire DA. In: Modern NMR Techniques and Their Application in Chemistry. Popov AI, Hallenga K, editors. Vol. 11. Marcel Dekker, Inc; New York: 1991. p. 323. [Google Scholar]
- 18.Tofts PS, Wray S. NMR Biomed. 1988;1:1. doi: 10.1002/nbm.1940010103. [DOI] [PubMed] [Google Scholar]
- 19.O’Neill IK, Pringuer MA, Prosser HJ. J Pharm Pharmacol. 1975;27:222. doi: 10.1111/j.2042-7158.1975.tb10690.x. [DOI] [PubMed] [Google Scholar]
- 20.Malz F, Jancke H. J Pharm Biomed Anal. 2005;38:813. doi: 10.1016/j.jpba.2005.01.043. [DOI] [PubMed] [Google Scholar]
- 21.Mo H, Raftery D. Anal Chem. 2008;80:9835. doi: 10.1021/ac801938j. [DOI] [PMC free article] [PubMed] [Google Scholar]
- 22.Barantin L, Pape AL, Akoka S. Magn Reson Med. 1997;38:179. doi: 10.1002/mrm.1910380203. [DOI] [PubMed] [Google Scholar]
- 23.Farrant RD, Hollerton JC, Lynn SM, Provera S, Sidebottom PJ, Upton RJ. Magn Reson Chem. 2010;48:753. doi: 10.1002/mrc.2647. [DOI] [PubMed] [Google Scholar]
- 24.Dalisay DS, Molinski TF. J Nat Prod. 2009;72:739. doi: 10.1021/np900009b. [DOI] [PMC free article] [PubMed] [Google Scholar]
- 25.Mo SY, Krunic A, Santarsiero BD, Franzblau SG, Orjala J. Phytochemistry. 2010;71:2116. doi: 10.1016/j.phytochem.2010.09.004. [DOI] [PMC free article] [PubMed] [Google Scholar]
- 26.Kim H, Lantvit D, Hwang CH, Kroll DJ, Swanson SM, Franzblau SG, Orjala J. Bioorg Med Chem. 2012;20:5290. doi: 10.1016/j.bmc.2012.06.030. [DOI] [PMC free article] [PubMed] [Google Scholar]
- 27.The Board of Trustees of The University of Illinois. 2012 Oct 29; http://www.uic.edu/orgs/ctrstbio/
- 28.Krunic A, Vallat A, Mo SY, Lantvit DD, Swanson SM, Orjala J. J Nat Prod. 2010;73:1927. doi: 10.1021/np100600z. [DOI] [PMC free article] [PubMed] [Google Scholar]
- 29.Chlipala GE, Tri PH, Hung NV, Krunic A, Shim SH, Soejarto DD, Orjala J. J Nat Prod. 2010;73:784. doi: 10.1021/np100002q. [DOI] [PMC free article] [PubMed] [Google Scholar]
- 30.Wani MC, Taylor HL, Wall ME, Coggon P, McPhail AT. J Am Chem Soc. 1971;93:2325. doi: 10.1021/ja00738a045. [DOI] [PubMed] [Google Scholar]
- 31.Hwang TL, Shaka AJ. J Magn Reson, Ser A. 1995;112:275. [Google Scholar]
- 32.Krunic A, Mo SY, Orjala J. SMASH NMR Conference; Santa Fe, NM. September 7–10; Poster no. 37. [Google Scholar]
- 33.Martin GE, Hilton BD, Blinov KA. Magn Reson Chem. 2011;49:248. doi: 10.1002/mrc.2743. [DOI] [PubMed] [Google Scholar]
- 34.Martin GE. In: Annual Reports on NMR Spectroscopy. Webb GA, editor. Vol. 56. Academic Press; London: 2005. p. 1. [Google Scholar]
- 35.Liu Y, Green MD, Marques R, Pereira T, Helmy R, Thomas Williamson R, Bermel W, Martin GE. Tetrahedron Lett. 2014;55:5450. [Google Scholar]
- 36.Bigler P, Kummerle R, Bermel W. Magn Reson Chem. 2007;45:469. doi: 10.1002/mrc.1993. [DOI] [PubMed] [Google Scholar]
- 37.Burger R, Bigler P. J Magn Reson. 1998;135:529. doi: 10.1006/jmre.1998.1595. [DOI] [PubMed] [Google Scholar]
Associated Data
This section collects any data citations, data availability statements, or supplementary materials included in this article.


