Abstract
We construct a mean-field variational model to study how the dependence of dielectric coefficient (i.e., relative permittivity) on local ionic concentrations affects the electrostatic interaction in an ionic solution near a charged surface. The electrostatic free-energy functional of ionic concentrations, which is the key object in our model, consists mainly of the electrostatic potential energy and the ionic ideal-gas entropy. The electrostatic potential is determined by Poisson’s equation in which the dielectric coefficient depends on the sum of concentrations of individual ionic species. This dependence is assumed to be qualitatively the same as that on the salt concentration for which experimental data are available and analytical forms can be obtained by the data fitting. We derive the first and second variations of the free-energy functional, obtain the generalized Boltzmann distributions, and show that the free-energy functional is in general nonconvex. To validate our mathematical analysis, we numerically minimize our electrostatic free-energy functional for a radially symmetric charged system. Our extensive computations reveal several features that are significantly different from a system modeled with a dielectric coefficient independent of ionic concentration. These include the non-monotonicity of ionic concentrations, the ionic depletion near a charged surface that has been previously predicted by a one-dimensional model, and the enhancement of such depletion due to the increase of surface charges or bulk ionic concentrations.
Keywords: Electrostatic interactions, concentration-dependent dielectrics, mean-field models, Poisson–Boltzmann theory, generalized Boltzmann distributions, nonconvex free-energy functional, variational analysis, numerical computation
1. Introduction
Electrostatic interactions among charged solutes, mobile ions, and polarized solvent play an important role in the stability and dynamics of biological molecules in aqueous solution [4, 13, 16, 28, 29, 42–44, 53, 54]. Poisson’s equation and Poisson–Boltzmann (PB) equations are efficient mathematical descriptions of such interactions [3, 11, 13, 14, 19, 21, 24, 25, 36, 45, 53]. A basic hypothesis in such descriptions is that an underlying charged molecular system can be treated as a dielectric medium characterized by its dielectric coefficient that can vary spatially. Under normal conditions, the dielectric coefficient for water is close to 80, while that for proteins can be as low as 1 – 4 [26, 27]. Experiment and molecular dynamics (MD) simulations have indicated that the dielectric coefficient can depend on the local ionic concentrations [9, 10, 17, 26, 27, 31, 33, 40, 47, 50–52, 57, 58]. In this work, we use a mean-field variational approach to study how such dependence affects the equilibrium properties of electrostatic interactions in an ionic solution.
Consider an ionic solution near a charged surface. Assume there are M ionic species in the solution. (Typically 1 ≤ M ≤ 4.) Denote by ci = ci(x) the local ionic concentration of the ith species at a spatial point x. Our key modeling assumption is that the dielectric coefficient ε depends on the sum of local ionic concentrations of all individual ionic (either cationic or anionic) species: , where . This dependence is qualitatively the same as that on the salt concentration. The latter can be constructed by fitting experimental or MD simulations data. Figure 1.1 shows the dependence of the dielectric coefficient on the concentration of NaCl [27, 40] and the fitted analytic form of such dependence. In general, we assume that the function is monotonically decreasing, convex, and is bounded below by a positive constant. Examples of such a function are
Fig. 1.1.
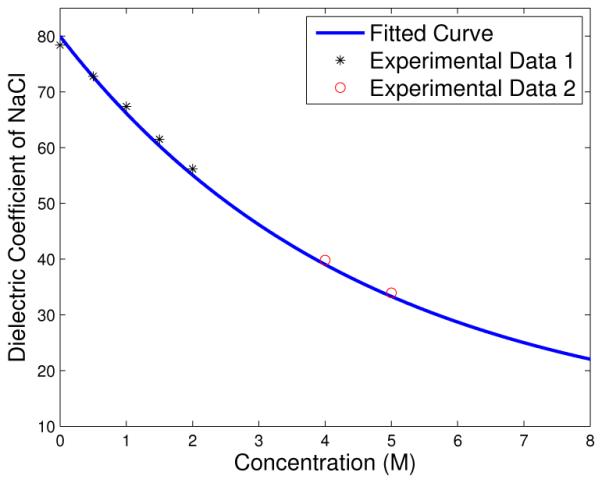
The dielectric coefficient for NaCl solution. The experimental data 1 and 2 are taken from [27] and [40], respectively. The fitted form is . The maximum relative error at data points is 2%.
where all α0, α1, and ξ are constant parameters fitting experimental or MD simulations data with α0 > α1 > 0. Note that ε(0) = α0 and ε(∞) = α1. We remark that the choice of instead of salt concentration reflects our attempt in understanding the contribution of each individual ionic species through its concentration to the dielectric environment, as biological properties are often ion specific (e.g., the ion selectivity in ion channels). Using allows us to input the concentration of each individual ionic species, and also to determine the variation of the free energy with respect to such individual ionic species.
The dielectric coefficient measures the polarizability of a material exposed to an external electric field. Due to their asymmetric structures, water molecules form permanent dipoles. They orient randomly in the bulk due to thermal fluctuations. Such orientational polarization makes the bulk water a strong dielectric medium. In the proximity of charged particles such as ions (cations or anions), however, water molecules are attracted by the charges, forming a hydration shell. These dipolar water molecules in the shell are aligned to the local electric field. Such saturation of local orientational polarizability leads to a weaker dielectric response of water near charges to the external electric field. Consequently, the dielectric coefficient in a region of high ionic concentrations is expected to be smaller than that in a region of lower ionic concentrations [7,15,22,27,57]. This dielectric decrement is one of the main properties of electrostatic interactions that we study here.
We now let the ionic solution occupy a bounded domain Ω in ℝ3 with a smooth boundary ∂Ω. We assume that the boundary ∂Ω of Ω is divided into two nonempty, disjoint, and smooth parts ΓD (D for Dirichlet) and ΓN (N for Neumann); cf. Figure 1.2. (The case that ΓD = ∅, i.e., Γ = ΓN, can be treated similarly.) We also assume that we are given a fixed charged density ρf : Ω → ℝ, a surface charge density σ : ΓN → ℝ, and a boundary value of the electrostatic potential ψ∞ : ΓD → ℝ. We consider minimizing the following mean-field electrostatic free-energy functional of the ionic concentrations c = (c1,…,cM) [12, 20, 36, 48, 49]:
Fig. 1.2.
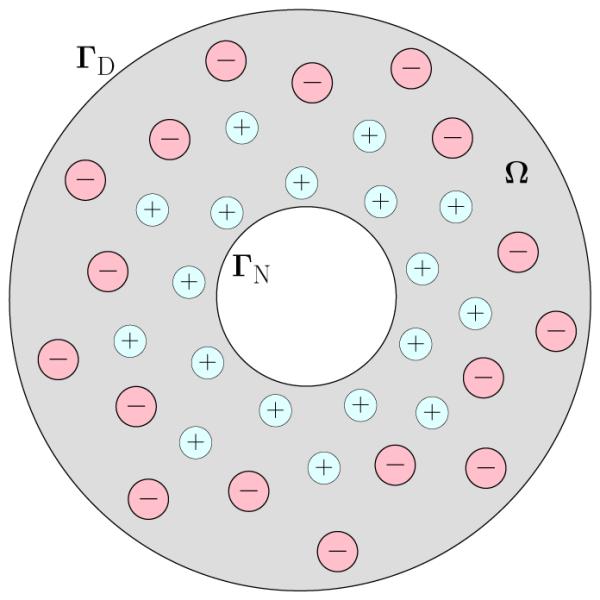
A schematic view of an ionic solution. The solvent occupies the grey region Ω. Small circles with plus and minus signs represent cations (positively charged ions) and anions (negatively charged ions), respectively.
| (1.1) |
Here, the first two terms together represent the electrostatic potential energy. In these terms, ρ(c) is the total charge density, defined by
| (1.2) |
where qi = Zie with Zi the valence of the ith ionic species and e the elementary charge, and ψ = ψ(c) is the electrostatic potential determined as the solution to the boundary-value problem of Poisson’s equation [7, 30, 32]
| (1.3) |
where ε0 is the vacuum permittivity and ∂ψ/∂n denotes the normal derivative at Γ with n the exterior unit normal. The third term in (1.1) represents the ionic ideal-gas entropy, where β−1 = kBT with kB the Boltzmann constant and T the absolute temperature, log denotes the natural logarithm, and Λ is the thermal de Broglie wavelength. The last term in (1.1), in which µi is the chemical potential for the ith ionic species, represents the chemical potential of the system that results from the constraint of total number of ions in each species.
Our main contributions are as follows:
- (1) We derive the first and second variations of the electrostatic free-energy functional (1.1). Setting the first variation to zero, we obtain the following generalized Boltzmann distributions that relate the equilibrium concentrations c1,…,cM to the corresponding electrostatic potential ψ :
where is the bulk concentration of the ith ionic species that is determined by the parameters Λ and µi. Here we assume ψ∞ = 0. A more general formula is given in Subsection 2.2. This formula was obtained in [7] for a one-dimensional system and a linear . Note that if ε does not depend on the concentrations then , and we recover the classical Boltzmann distributions. If is linear in as assumed in [7, 27], then does not depend on and the equilibrium concentrations are uniquely determined by the potential ψ. In the general case, where is nonlinear in , the equilibrium concentrations are only defined implicitly by (1.4) through the potential ψ.(1.4) (2) We show by numerical calculations that there are possibly multiple values of concentrations c = (c1,…,cM) that can depend on the same potential ψ through the generalized Boltzmann distributions. We also construct some examples to prove that the free-energy functional can be indeed nonconvex.
(3) We minimize numerically our electrostatic free-energy functional for a radially symmetric system of both counterions and coions. By our extensive numerical computations, we find several interesting properties of the electrostatic interactions attributed to the dependence of dielectric on ionic concentrations. These include the depletion of ions near a charged surface that has been previously described by a one-dimensional model with a linear [7], the non-monotonicity of ionic concentrations near such a surface, and the shift of peaks of the ionic concentration profiles due to the increase of surface charges or bulk concentrations.
Our free-energy functional (1.1) extends those in [12, 20, 36, 49], where the dielectric coefficient is independent of concentrations, and that in [7], where the dielectric coefficient depends linearly on the concentrations. A nonlinear dependence of dielectric coefficient on concentrations is significant, as it can lead to the existence of multiple equilibrium concentrations. Our numerical results show interesting phenomena, extending those found in [5, 7, 22, 31, 34]. We notice that several authors have studied the dielectric decrement and related issues through the polarization of solvent molecules and ions [1, 5, 6, 22, 46].
We organize the rest of the paper as follows: In Section 2, we derive the first variations of the free-energy functional and the generalized Boltzmann distributions. In Section 3, we derive the second variations of the free-energy functional. In Section 4, we show by numerical calculations that the generalized Boltzmann distributions can lead to multiple values of concentrations. We also show by examples that the free-energy functional is in general nonconvex. In Section 5, we minimize numerically the mean-field electrostatic free-energy functional for a radially symmetric system. Finally, in Section 6, we draw our conclusions.
2. First Variations and Generalized Boltzmann Distributions
Unless otherwise stated, we assume the following throughout the rest of the paper:
- (A1) The dielectric coefficient function ε ∈ C1([0,∞)). It decreases monotonically and is convex. Moreover, there are two positive numbers εmin and εmax such that
(2.1) (A2) The set Ω ⊂ ℝ3 is bounded, open, and connected with a smooth boundary Γ = ∂Ω (e.g., Γ is in the class C2). The boundary ∂Ω is divided into two disjoint, nonempty, and smooth (e.g., in the class of C2) parts ΓD and ΓN;
(A3) The functions ρf : Ω → ℝ, σ : ΓN → ℝ, and ψ∞ : ΓD → ℝ are all given. Moreover, ρf ∈ L∞(Ω), σ is the restriction of a W 1,∞(Ω)-function (also denoted by σ) on ΓN, and ψ∞ is the restriction of a W 1,∞(Ω)-function (also denoted by ψ∞) on ΓD.
Note that we use standard notion for Sobolev spaces [2, 18, 23].
We denote
Let u ∈ L1(Ω). Suppose
Since is dense in , we can identify u as an element in , the dual space of , and write . We denote
Let c ∈ X. It follows from the Lax–Milgram Lemma and the Poincaré inequality for functions in [18, 23] that the boundary-value problem of Poisson’s equation (1.3) has a unique weak solution ψ = ψ(c), defined by and
| (2.2) |
Similarly, we define to be the unique weak solution to
| (2.3) |
defined by and
| (2.4) |
2.1. First variations
Let c = (c1,…,cM) ∈ X and d = (d1,…,dM) ∈ X. We define
| (2.5) |
if c + td ∈ X for |t| « 1 and the limit exists, and call it the first variation of F [·] at c ∈ X in the direction d.
Theorem 2.1
Let c = (c1,…,cM) ∈ X. Assume there exist positive numbers δ1 and δ2 such that δ1 ≤ ci(x) ≤ δ2 for a.e. x ∈ Ω and i = 1,…,M . Assume also that . Then
where for each i (1 ≤ i ≤ M) the function δiF [c] : Ω → R is given by
| (2.6) |
We shall identify δiF [c] defined in (2.6) as the the first variation of F at c in the ith coordinate direction. We note that our assumptions on ci(x) (i = 1,…,M,x ∈ Ω) are expected to hold true for a local minimizer c = (c1,…,cM). This can be argued using the same analysis in [35, 36], where perturbed, lower energy concentrations are constructed for the usual PB free-energy functional, based on the observation that the entropic change is larger than the potential change. To prove the theorem, we first prove the following:
Lemma 2.2
Under the assumption of Theorem 2.1, we have
Proof
Denote . By the weak formulations for ψ(c + td) and ψ(c) (cf. (2.2)), and the definition of ρ(c) (cf. (1.2)), we have for that
Setting , we then have by (2.1) that
Since , we conclude by the Poincaré inequality applied to φt that there exists a constant C > 0 independent of t with |t| « 1 such that
This proves that . The proof of the convergence is similar and simpler.
Proof
[Proof of Theorem 2.1] Let us write F [c] = Fpot[c] + Fent[c], where
| (2.7) |
| (2.8) |
By routine calculations (cf. [12, 35, 36]), we have
| (2.9) |
Now we have by (1.2) that for |t| « 1
| (2.10) |
By Lemma 2.2, we have
| (2.11) |
For the remaining two terms in (2.10), we have by the weak formulation (2.2) for ψ(c) and (2.4) for ψD(c) with φ = [ψ(c + td) − ψ(c)]/t that
| (2.12) |
It now follows from the weak formulations for ψ(c + td) and ψ(c) (cf. (2.2)) with φ = ψ(c) − ψD(c), and Lemma 2.2 that
This and (2.10)–(2.12) lead to
| (2.13) |
We finally combine (2.9) and (2.13) to obtain the desired first variation.
2.2. Generalized Boltzmann distributions
We call c = (c1,…,cM) ∈ X an equilibrium if the first variation δF [c][d] defined by (2.5) exists and is equal to 0 for any d ∈ L∞(Ω,RM). If c = (c1,…,cM) ∈ X satisfies the assumption in Theorem 2.1 and is an equilibrium, then δiF [c] = 0 (i = 1,…,M) by Theorem 2.1. Straightforward calculations then lead to
| (2.14) |
where . We call these the generalized Boltzmann distributions, as they generalize the classical Boltzmann distributions if ε does not depend on c, and ψ∞ = 0 which implies ψD = 0. The effect of the boundary data was noted in [35, 36]. Note that in general and hence (2.14) does not explicitly determine how the concentrations ci (i = 1,…,M) depend on the potential ψ.
3. Second Variations
Let a,b,c ∈ X. We define
if the quotient is defined when |t| « 1 and the limit exists, and call it the second variation of the free-energy functional F at c in the directions a and b.
For c ∈ X and a = (a1,…,aM) ∈ X, let us denote by Ψ(c,a) the unique weak solution to the boundary-value problem
defined by and
| (3.1) |
Similarly, let us denote by ΨD(c,a) the unique weak solution of the boundary-value problem
defined by and
| (3.2) |
The existence and uniqueness of each of these weak solutions is guaranteed by the Lax–Milgram Lemma. Note that Ψ(c,a) and ΨD(c,a) are linear in a.
Theorem 3.1
Let ε ∈ C2([0,∞)). Let c = (c1,…,cM) ∈ X. Assume there exist positive numbers δ1 and δ2 such that δ1 ≤ ci(x) ≤ δ2 for a.e. x ∈ Ω and i = 1,…,M . Let a = (a1,…,aM), b = (b1,…,bM) ∈ L∞(Ω,RM). We have
Note that δ2F [c][a,b] is symmetric and bilinear in (a,b). To prove this theorem, let us denote for |t| « 1
| (3.3) |
where and ψD(c + ta) are defined by (2.2) and (2.4), respectively, with c replaced by c + ta. We first prove the following:
Lemma 3.2
Under the assumption of Theorem 3.1, we have Ψ(c,a;t) → Ψ(c,a) and ΨD(c,a;t) → ΨD(c,a) in H1(Ω) as t → 0.
Proof
Consider |t| « 1. By the weak formulations for ψ(c + ta) and ψ(c) (cf. (2.2)) and the definition of ρ(c + ta) and ρ(c) (cf. (1.2)), we have for any that
With our notation Ψ(c,a) and Ψ(c,a;t), and the weak formulation for Ψ(c,a) (cf. (3.1)), this leads to
Setting , we then obtain
Since is bounded in Ω and in Ω, we thus have by the assumption on , the Cauchy–Schwarz inequality, and Lemma 2.2 that
This and the Poincaré inequality for functions in imply the convergence Ψ(c,a;t) → Ψ(c,a) in H1(Ω) as t → 0. The convergence ΨD(c,a;t) → ΨD(c,a) in H1(Ω) as t → 0 can be proved similarly.
Proof
[Proof of Theorem 3.1] We first consider Fent[c] defined in (2.8). By the boundedness of all a, b, and c, and Lebesgue’s Dominated Convergence Theorem, we have by (2.9) that
| (3.4) |
We now consider Fpot[c] defined in (2.7). By (2.13) and using our notation Ψ(c,a;t) and ΨD(c,a;t) (cf. (3.3)), we have
Consequently, since
we have by Lemma 2.2 and Lemma 3.2, and by rearranging terms, that
By the weak formulation for Ψ(c,b) (cf. (3.1) with b replacing a) with φ = Ψ(c,a), the weak formulation for Ψ(c,b) (cf. (3.1) with b replacing a) with φ = ΨD(c,a), and the weak formulation for ΨD(c,b) (cf. (3.2) with b replacing a) with φ = Ψ(c,a), we therefore obtain
This and (3.4) imply the desired second variation.
4. Non-Convexity of the Free-Energy Functional
By Theorem 3.1, the second variation δ2F [c] is not necessarily positive definite, i.e., δ2F [c][a,a] may not be positive, as by our assumption that is based on experimental data. This indicates that the free-energy functional (1.1) may be nonconvex. We investigate this non-convexity by examining the generalized Boltzmann distributions. If we assume ψ∞ = 0 on ΓD, then ψD = 0 in Ω, cf. (2.4), and hence the generalized Boltzmann distributions (2.14) become
| (4.1) |
where ψ = ψ(c). Summing over all i and using the notation , we obtain
Based on these considerations, we define for any given s ∈ ℝ and v ≥ 0
Notice that if c = (c1,…,cM) satisfies the generalized Boltzmann distributions (4.1), s = ψ(c), and v = |∇ψ(c)|, then .
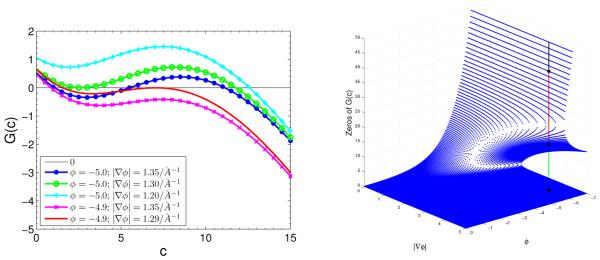
We now consider an ionic solution occupying the annulus region 10 < r = |x| < 60 (in Å) with the charge density σ = −0.02 e/Å2 on r = 10. We assume there are two ionic species in the solution with Z1 = 1, Z2 = −1, , and . We choose which we used to fit experimental data, cf. Figure 1.1. From our numerical computational results (cf. Section 5 for details), we fix a few selected values of ψ and |∇ψ| near the charged surface r = 10, and then plot in Figure 4.1 (Left) the graph of function , where we use c instead of instead of ψ. We observe that there are multiple solutions to the equation G(c) = 0 for some values of φ and |∇φ|, indicating that the generalized Boltzmann distributions may not determine uniquely the concentrations through the electrostatic potential. In Figur 4.1 (Right), we plot zeros of G(c) = 0 vs. c. We see that there are three zeros when the electrostatic potential is large in magnitude.
Fig. 4.1.
Left: G(c) vs. c for different values of φ and |∇φ|. Right: Zeros of G(c) vs. φ and |∇φ|. The three dots on the vertical line indicate the three zeros of G(c).
We now construct two examples to show that the free-energy functional (1.1) is in general nonconvex. For simplicity, we take ε0 to be the unity.
Example 1
Let σ, β, λ, µ ∈ R with β > 0 and λ > 0. We consider the functional
| (4.2) |
for functions c = c(x) ≥ 0 with x ∈ (0,1), where the potential ψ = ψ(x) is determined by
Here, ε(c) = 70e−0.22c + 10, which was used to fit experimental data in Figure 1.1. This model can be viewed as reduced from a three-dimensional model with the ionic concentration and electrostatic potential only varying in the x-coordinate direction.
If c is a constant function, then we have by simple calculations that
| (4.3) |
where c∞ = λ−1eβµ. The function F [c], with σ = −0.04, β−1 = 1, and c∞ = 0.1, is plotted in Figure 4.2. We find that it has two local minima at c = 0 and c ≈ 48.4, and that it is nonconvex. Hence, the functional F [c] defined in (4.2) is not convex in general.
Fig. 4.2.
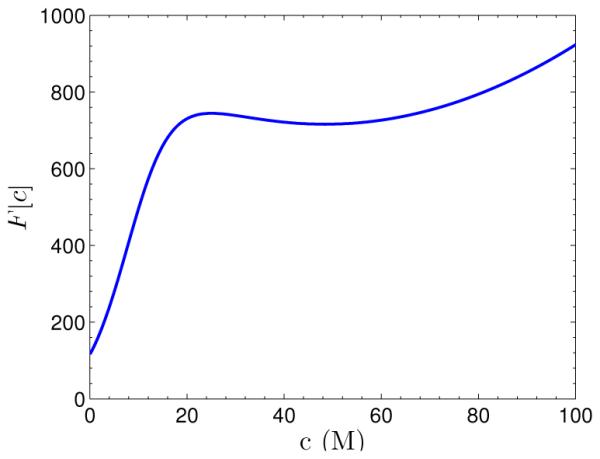
Graph of the function F [c] defined in (4.3).
Example 2
We consider the free-energy functional
| (4.4) |
for functions c = c(x) ≥ 0 with x ∈ (0,1), where the potential ψ = ψ(x) is determined by
The function ε = ε(c) is defined by
| (4.5) |
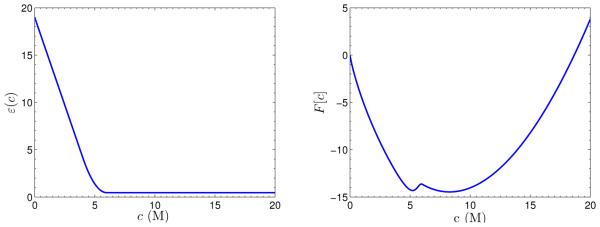
It can be verified that this is a C1-function, monotonically decreasing, convex, and bounded above and below by positive constants. See Figure 4.3 (Left) for a plot of this function.
Fig. 4.3.
Left: Graph of the function ε = ε(c) defined in (4.5). Right: Graph of the function F [c] defined in (4.6).
For constant functions c, we have
| (4.6) |
Figure 4.3 (Right) is a plot of the function F [c] defined in (4.6). We see clearly that this function F [c] is not convex. Hence the functional F [c] defined in (4.4) is not convex.
5. Numerical Study of a Model System
We minimize numerically the free-energy functional (1.1) and (1.3) with
where RD and RN are two given positive numbers such that RD < RN. We assume that ρf = ρf (r) is a function of r = |x|, ψ∞ is a constant, and σ is also a constant. By the radial symmetry, we assume the concentrations and potential are functions of r = |x| and write c = c(r) and ψ = ψ(r). The free-energy functional (1.1) and the boundary-value problem of Poisson’s equation (1.3) become now
| (5.1) |
| (5.2) |
Here we use instead of µi (i = 1,…,M) as input parameters. We have (i = 1,…,M). With our radially symmetric setting, we can easily observe and verify that the solution ψD to the boundary-value problem (2.3) is ψD = ψ∞, a constant. By Theorem 2.1, the first variations of the free-energy functional (5.1) in the coordinate directions are then given by
| (5.3) |
We employ a steepest descent method to minimize the free-energy functional (5.1). After initializing the concentrations c = (c1,…,cM), we follow these steps:
(1) Solve Poisson’s equation (5.2) to update the potential ψ.
(2) Compute the first variations δiF [c] (i = 1,…,M) by (5.3).
(3) Update the concentrations: ci ← ci − γdi (i = 1,…,M), where γ > 0 is a pre-chosen parameter.
(4) Check if with a pre-chosen tolerance εtol. If not, go back to (1).
We choose the parameter γ in Step (3) to be very small to ensure that all ci > 0 in each iteration. In case ci < 0 for some i, we can change γ to a smaller value to update ci. Note that we only find numerically local minimizers that are sometimes more interesting in terms of physical properties than global minimizers.
We now fix RN = 10 Å and RD = 60 Å, and vary the surface charge density σ from −0.005 to −0.025 e/Å2. As surface charges generally represent the main part of fixed charges, we set ρf = 0. Moreover, since we are mainly interested in the counterion concentrations and electrostatic potentials near the charged surface, we set ψ∞ = 0. We use kBT as units of energy. We consider two systems.
System I: M = 2, Z1 = 1, Z2 = −1, , and .
System II: M = 3, Z1 = 2, Z2 = 1, Z3 = −2, , , .
In each of our numerical computations, we observe the decay of the free energy and the convergence of concentrations in our iterations. This indicates that our numerical method is reliable.
5.1. Comparison of different dielectric relations: Counterion depletion
We compare equilibrium concentrations and electrostatic potentials corresponding to the following four different dielectric coefficient functions :
| (5.4) |
Note that all these functions are convex and monotonically decreasing with the maximum value 80 at . In addition ε3(∞) = 0 and ε4(∞) = 10. The linear dependence is used in [7]. The form is proposed in [31]. We used to fit the experiment data in Figure 1.1.
We consider System I with the surface charge density σ = −0.005 e/Å2. In Figure 5.1, we plot profiles of the equilibrium concentrations for both counterion and coion species for the four different dielectric coefficient defined in (5.4). The four concentration profiles for the species of coions nearly overlap and become one. It is the curve below all the other four for the counterion concentrations. The inset shows the graph of (1 ≤ i ≤ 4) as a function of the radial variable r. We observe differences of the counterion concentrations in the vicinity of the charged surface, even at such a relatively low surface charge density. The counterion concentrations corresponding to , , and are smaller than that predicted by the classical PB theory that corresponds to . Such counterion depletion is expected as explained in Introduction and as found in [7].
Fig. 5.1.
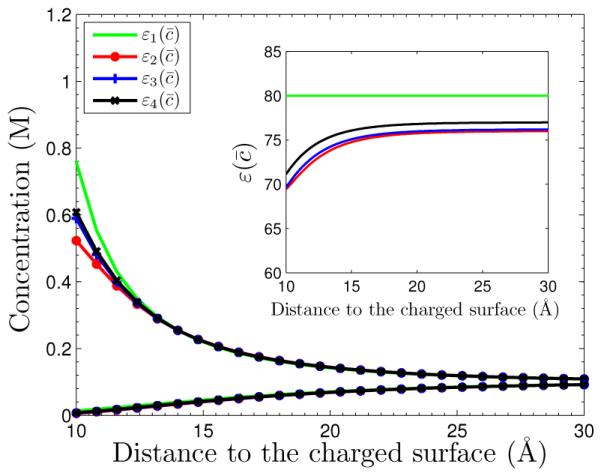
The concentrations vs. radial distance to the charged surface for System I with the surface charge density σ = −0.005 e/Å2. The four curves with indicated symbols are the counterion concentration profiles. The four coion concentration profiles nearly overlap and become one curve which is the lowest curve. Inset: the graph of function for i = 1, … , 4.
We now still consider System I but increase the surface charge density to σ = −0.012 e/Å . In Figure 5.2, we plot concentrations and potential similar to those in Figure 5.1. We see clearly that the counterion depletion near the charged surface is enhanced for the concentration-dependent dielectric coefficient (i = 2,3,4). This is because that the increase of the surface charge leads to the increase of the electric field, which in turn decreases more the concentration by the factor in the generalized Boltzmann distributions, since is larger. We find that, for the case of linear dependence , our numerical solution is quite sensitive. As the concentration becomes large, the dielectric coefficient can be very close to zero and even negative, leading to an unphysical situation that corresponds to the loss of ellipticity mathematically.
Fig. 5.2.
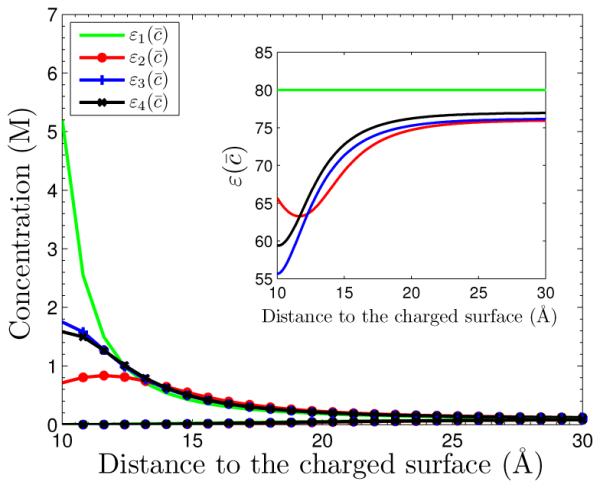
The concentrations vs. radial distance to the charged surface for System I with the surface charge density σ = −0.012 e/Å2. The four curves with indicated symbols are the counterion concentration profiles. The four coion concentration profiles nearly overlap and become one curve which is the lowest curve. Inset: the graph of function for i = 1, … , 4.
5.2. Effect of surface charges and bulk concentrations: Non-monotonicity of counterion concentrations
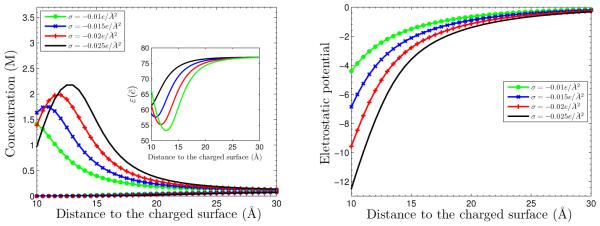
We now consider System I with defined in (5.4). We compute the equilibrium concentration and electrostatic potential with the surface charge densities σ = −0.01 e/Å2, −0.015 e/Å2, −0.02 e/Å2, and −0.025 e/Å2, respectively, and plot our numerical results in Figure 5.3. We observe that the counterion concentration is non-monotonic for a large surface charge density. The dielectric function is also non-monotonic. Moreover, for large surface charge densities, as the surface charge increases, the counterion concentration at the surface (i.e., at r = RN = 10 Å) decreases, and the peak of the counterion concentration profile gets higher and moves further away from the surface. All these result from the competition between the surface-counterion attraction and the counterion depletion near the surface.
Fig. 5.3.
System I with . Left: The ionic concentrations vs. the radial distance to the charged surface. The four counterion concentration profiles for the four different values of the surface charge density are indicated by the symbols. The four corresponding coion concentrations overlap and become one curve which is the lowest one. Right: The electrostatic potentials vs. the radial distance to the charged surface for different values of the surface charge density.
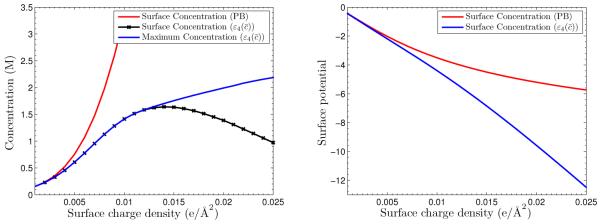
In Figure 5.4, we plot the counterion concentration at the charged surface and the maximum value of counterion concentration as functions of the surface charge density. For comparison, we also plot the results predicted by the classical PB theory. We observe that the differences are significant for large surface charges: the counterion concentration at the charged surface predicted using decreases but that predicted by the classical PB equation increases. Moreover, the maximum value of counterion concentration predicted with increases as the surface charge density increases. We also plot the electrostatic potential at the charged surface in Figure 5.4 (Right). As the surface charge density increases, the electrostatic potentials at the charged surface predicted by the classical PB are weaker than those predicted with . This is because that the screening effect with the ionic decrement is weaker.
Fig. 5.4.
Left: The Counterion concentration at the charged surface and the maximum value of counterion concentration vs. the surface charge density. Right: The electrostatic potential at the charged surface vs. the surface charge density.
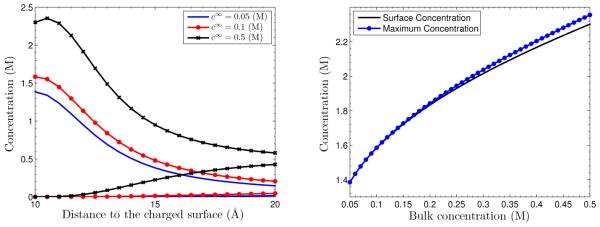
We now fix the surface charge density σ = −0.012 e/Å2 and vary the bulk concentrations (i = 1,2). From Figure 5.5 (Left), we observe that larger bulk concentrations lead to the stronger depletion effect. From Figure 5.5 (Right), we see that the counterion distribution is monotonic for low bulk concentrations and is non-monotonic after bulk concentrations exceed 0.2 M. Their differences increase as the bulk concentrations increase.
Fig. 5.5.
Left: Concentrations vs. radial distance to the charged surface with different ionic concentrations. Right: The counterion concentration at the charged surface and the maximal value of counterion concentration vs. bulk ionic concentration.
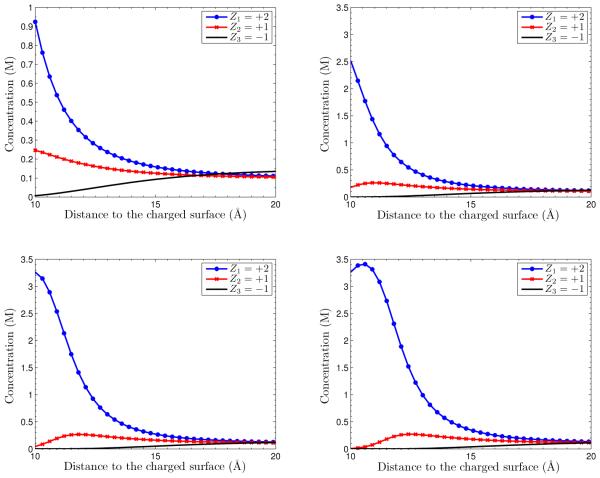
We now consider System II in which there are two species of counterions and one species of coions. In Figure 5.6, we plot concentration profiles for different values of surface charge density. We can again observe the ionic depletion for high surface charges.
Fig. 5.6.
Ionic concentrations vs. radial distance to the charge surface with different values of surface charge density σ. Upper left: σ = −0.005e/Å2. Upper right: σ = −0.01e/Å2. Lower left: σ = −0.015e/Å2. Lower right: σ = −0.02e/Å2.
6. Conclusions
We have studied a variational problem of minimizing a mean-field electrostatic free-energy functional to investigate how the ionic concentration dependent dielectric response can affect the equilibrium properties of electrostatic interactions of an ionic solution near a charged surface. Our basic modeling assumption is that the dependence of the dielectric coefficient on the sum of individual ionic concentrations is qualitatively the same as that on the salt concentrations for which experimental data are available. Such dependence is expressed mathematically as a continuous, monotonically decreasing, and convex function.
We have rigorously derived the first and second variations of the free-energy functional. Analytic formulas of such variations are useful in understanding the behavior of such a functional and in numerical computations. From the generalized Boltzmann distributions, we see that the ionic depletion can occur due to the high concentration low permittivity relation. The formula of the second variation of the functional indicates the functional can be nonconvex. We indeed show that it is so for some model systems.
We have also developed a numerical method and performed computations with a three-dimensional, radially symmetric geometry for a system with a single counterion species or a system with two multi-valence counterion species. Our computational results show the ionic depletion near a charged surface with both low and high surface charges. Moreover, we have demonstrated that the increase of the surface charge density will lead to the non-monotonicity of concentration profiles. These results confirm experimental findings and also indicate that the classical PB theory does not capture the ionic depletion and other properties. One of the key points is that the counterions are attracted to the charged surface but in the meantime crowded counterions decreases the permittivity of the solution. With our efficient mean-field variational model, we have confirmed this.
It should be noted that a linear dependence (cf. (5.4)) leads to the illposedness of Poisson’s equation (cf. (1.3)). The nonlinear dependence of the dielectric coefficient on the ionic concentrations, however, leads to the lack of compactness needed in proving the existence of a minimizer by the usual argument of direct methods in the calculus of variations. To prove the existence, we will then need to construct carefully a free-energy-minimizing sequence that is weakly compact. The nonconvexity of the functional is different from that for the classical PB functional. It will be interesting to understand if such nonconvexity can be used to model the transition from weak to strong interactions in an ionic solution.
Our numerical algorithm is fairly general. The key of our algorithm is the self-consistency: In each step of relaxing the free-energy functional, we solve Poisson’s equation with the concentration dependent dielectric coefficient. We update the concentrations and electrostatic potential alternatively. If one simply uses the classical Boltzmann distributions for ci’s in , one may not be able to capture the ionic depletion as shown in the recent work [38].
One of the ion-specific properties is the ionic size effect. In recent years, the PB-like mean-field models that account for ionic size effects have been developed [5, 7, 8, 22, 35–37, 39, 55, 59, 61]. Our experience is that a large (in terms of magnitude) surface charge density is needed to capture the ionic size effect in such models, while only a small charge density is needed to capture the ionic decrement near a charged surface. It will be therefore interesting to see the transition characterized by the surface charge density. Another important issue that we have not addressed here is the Born solvation energy of ions [41, 56, 60]. Additional equations may be needed to describe such energy. It is interesting to understand whether the inclusion of the Born solvation energy will also lead to the correction term in the generalized Boltzmann distributions. Finally, in terms of applications, how to apply our results to modeling charged macromolecules, such as proteins, in an aqueous environment is of great interest.
Acknowledgments
The authors thank Dr. Joachim Dzubiella, Dr. Zhenli Xu, Dr. Zhongming Wang, and Dr. Yanxiang Zhao for many helpful discussions. The authors also thank the anonymous referees for their helpful comments and suggestions.
Footnotes
This work was supported by the US National Science Foundation (NSF) through the grant DMS-131973, the NSF Center for Theoretical Biological Physics through the grant PHY-0822283, the US National Institutes of Health through the grant R01GM096188, and a UCSD Chancellor’s Interdisciplinary Collaboratories grant.
REFERENCES
- [1].Abrashkin A, Andelman D, Orland H. Dipolar Poisson–Boltzmann equation: Ions and dipoles close to charge interfaces. Phys. Rev. Lett. 2007;99:077801. doi: 10.1103/PhysRevLett.99.077801. [DOI] [PubMed] [Google Scholar]
- [2].Adams R. Sobolev Spaces. Academic Press; New York: 1975. [Google Scholar]
- [3].Andelman D. In: Electrostatic properties of membranes: The Poisson–Boltzmann theory. Lipowsky R, Sackmann E, editors. Vol. 1. Handbook of Biological Physics; Elsevier: 1995. pp. 603–642. [Google Scholar]
- [4].Andelman D. Introduction to electrostatics in soft and biological matter. In: Poon W, Andelman D, editors. Proceedings of the Nato ASI & SUSSP on “Soft condensed matter physics in molecular and cell biology” (2005) Taylor & Francis; New York: 2006. pp. 97–122. [Google Scholar]
- [5].Ben-Yaakov D, Andelman D, Harries D, Podgornik R. Beyond standard Poisson–Boltzmann theory: Ion-specific interactions in aqueous solutions. J. Phys.: Condens. Matter. 2009;21:424106. doi: 10.1088/0953-8984/21/42/424106. [DOI] [PubMed] [Google Scholar]
- [6].Ben-Yaakov D, Andelman D, Harries D, Podgornik R. Ions in mixed dielectric solvents: Density profiles and osmotic pressure between charged interfaces. J. Phys. Chem. B. 2009;113:6001–6011. doi: 10.1021/jp9003533. [DOI] [PubMed] [Google Scholar]
- [7].Ben-Yaakov D, Andelman D, Podgornik R. Dielectric decrement as a source of ion-specific effects. J. Chem. Phys. 2011;134:074705. doi: 10.1063/1.3549915. [DOI] [PubMed] [Google Scholar]
- [8].Borukhov I, Andelman D, Orland H. Steric effects in electrolytes: A modified Poisson–Boltzmann equation. Phys. Rev. Lett. 1997;79:435–438. [Google Scholar]
- [9].Buchner R, Hefter GT, Barthel J. Dielectric relaxation of aqueous NaF and KF solutions. J. Chem. Soc. Faraday Trans. 1994;90:2475–2479. [Google Scholar]
- [10].Buchner R, Hefter GT, May PM. Dielectric relaxation of aqueous NaCl solutions. J. Phys. Chem. A. 1999;103:1–9. [Google Scholar]
- [11].Chapman DL. A contribution to the theory of electrocapillarity. Philos. Mag. 1913;25:475–481. [Google Scholar]
- [12].Che J, Dzubiella J, Li B, McCammon JA. Electrostatic free energy and its variations in implicit solvent models. J. Phys. Chem. B. 2008;112:3058–3069. doi: 10.1021/jp7101012. [DOI] [PubMed] [Google Scholar]
- [13].Davis ME, McCammon JA. Electrostatics in biomolecular structure and dynamics. Chem. Rev. 1990;90:509–521. [Google Scholar]
- [14].Debye P, Hückel E. Zur Theorie der Elektrolyte. Physik. Zeitschr. 1923;24:185–206. [Google Scholar]
- [15].Démery V, Dean DS, Podgornik R. Electrostatic interactions mediated by polarizable counterions: Weak and strong coupling limits. J. Chem. Phys. 2012;137:174903. doi: 10.1063/1.4763986. [DOI] [PubMed] [Google Scholar]
- [16].Dill KA. Dominant forces in protein folding. Biochemistry. 1990;29:7133–7155. doi: 10.1021/bi00483a001. [DOI] [PubMed] [Google Scholar]
- [17].Drude P, Nernst W. Über Elektrostriktion durch freie Ionen. Z. Phys. Chem. 1984;15:79–85. [Google Scholar]
- [18].Evans LC. Partial Differential Equations, volume 19 of Graduate Studies in Mathematics. Amer. Math. Soc. (2nd) 2010 [Google Scholar]
- [19].Fixman F. The Poisson–Boltzmann equation and its application to polyelecrolytes. J. Chem. Phys. 1979;70:4995–5005. [Google Scholar]
- [20].Fogolari F, Briggs JM. On the variational approach to Poisson–Boltzmann free energies. Chem. Phys. Lett. 1997;281:135–139. [Google Scholar]
- [21].Fogolari F, Brigo A, Molinari H. The Poisson–Boltzmann equation for biomolecular electrostatics: a tool for structural biology. J. Mol. Recognit. 2002;15:377–392. doi: 10.1002/jmr.577. [DOI] [PubMed] [Google Scholar]
- [22].Frydel D. Polarizable Poisson–Boltzmann equation: The study of polarizability effects on the structure of a double layer. J. Chem. Phys. 2011;134:234704. doi: 10.1063/1.3598476. [DOI] [PubMed] [Google Scholar]
- [23].Gilbarg D, Trudinger NS. Elliptic Partial Differential Equations of Second Order. 2nd Springer-Verlag; 1998. [Google Scholar]
- [24].Gouy M. Sur la constitution de la charge électrique a la surface d’un électrolyte. J. Phys. Théor. Appl. 1910;9:457–468. [Google Scholar]
- [25].Grochowski P, Trylska J. Continuum molecular electrostatics, salt effects and counterion binding—A review of the Poisson–Boltzmann model and its modifications. Biopolymers. 2008;89:93–113. doi: 10.1002/bip.20877. [DOI] [PubMed] [Google Scholar]
- [26].Hasted JB. Aqueous Dielectrics. Chapman and Hall; London: 1973. [Google Scholar]
- [27].Hasted JB, Riston M, Collie CH. Dielectric properties of aqueous ionic solutions. Parts I and II. J. Chem. Phys. 1948;16:1–21. [Google Scholar]
- [28].Hille B. Ion Channels of Excitable Membranes. 3rd Sinauer Associates; 2001. [Google Scholar]
- [29].Honig B, Nicholls A. Classical electrostatics in biology and chemistry. Science. 1995;268:1144–1149. doi: 10.1126/science.7761829. [DOI] [PubMed] [Google Scholar]
- [30].Jackson JD. Classical Electrodynamics. 3rd Wiley; New York: 1999. [Google Scholar]
- [31].Kalcher I, Dzubiella J. Structure-thermodynamics relation of electrolyte solutions. J. Chem. Phys. 2009;130:134507. doi: 10.1063/1.3097530. [DOI] [PubMed] [Google Scholar]
- [32].Landau LD, Lifshitz EM, Pitaevski LP. Electrodynamics of Continuous Media. 2nd Butterwort–Heinemann; 1993. [Google Scholar]
- [33].Lattey RT. The dielectric constants of electrolytic solutions. Philos. Mag. 1921;41:829–848. [Google Scholar]
- [34].Levy A, Andelman D, Orland H. Dielectric constant of ionic solutions: A field-theory approach. Phys. Rev. Lett. 2012;108:227801. doi: 10.1103/PhysRevLett.108.227801. [DOI] [PubMed] [Google Scholar]
- [35].Li B. Continuum electrostatics for ionic solutions with nonuniform ionic sizes. Nonlinearity. 2009;22:811–833. [Google Scholar]
- [36].Li B. Minimization of electrostatic free energy and the Poisson–Boltzmann equation for molecular solvation with implicit solvent. SIAM J. Math. Anal. 2009;40:2536–2566. [Google Scholar]
- [37].Li B, Liu P, Xu Z, Zhou S. Ionic size effects: generalized boltzmann distributions, counterion stratification, and modified debye length. Nonlinearity. 2013;26:2899–2922. doi: 10.1088/0951-7715/26/10/2899. [DOI] [PMC free article] [PubMed] [Google Scholar]
- [38].Li H, Lu B. An ionic concentration and size dependent dielectric permittivity Poisson–Boltzmann model for biomolecular solvation studies. J. Chem. Phys. 2014;141:024115. doi: 10.1063/1.4887342. [DOI] [PubMed] [Google Scholar]
- [39].Lu BZ, Zhou YC. Poisson–Nernst–Planck equations for simulating biomolecular diffusion-reaction processes II: Size effects on ionic distributions and diffusion-reaction rates. Biophys J. 2011;100:2475–2485. doi: 10.1016/j.bpj.2011.03.059. [DOI] [PMC free article] [PubMed] [Google Scholar]
- [40].Lyashchenko AK, Zasetsky A. Yu. Complex dielectric permittivity and relaxation parameters of concentrated aqueous electrolyte solutions in millimeter and centimeter wavelength ranges. J. Molecular Liquids. 1998;77:61–75. [Google Scholar]
- [41].Ma M, Xu Z. Self-consistent field model for strong electrostatic correlations and inhomogeneous dielectric media. J. Chem. Phys. 2014;141:244903. doi: 10.1063/1.4904728. [DOI] [PubMed] [Google Scholar]
- [42].McCammon JA. Darwinian biophysics: Electrostatics and evolution in the kinetics of molecular binding. Proc. Nat. Acad. Sci. USA. 2009;106:7683–7684. doi: 10.1073/pnas.0902767106. [DOI] [PMC free article] [PubMed] [Google Scholar]
- [43].McLaughlin S. The electrostatic properties of membranes. Annu. Rev. Biophys. Biophys. Chem. 1989;18:113–136. doi: 10.1146/annurev.bb.18.060189.000553. [DOI] [PubMed] [Google Scholar]
- [44].Messina R. Electrostatics in soft matter. J. Phys.: Condens. Matter. 2009;21:113102. doi: 10.1088/0953-8984/21/11/113102. [DOI] [PubMed] [Google Scholar]
- [45].Naji A, Kandu M, Forsman J, Podgornik R. Perspective: Coulomb fluidsweak coupling, strong coupling, in between and beyond. J. Chem. Phys. 2013;139:150901. doi: 10.1063/1.4824681. [DOI] [PubMed] [Google Scholar]
- [46].Nakamura I, Shi A-C, Wang Z-G. Ion solvation in liquid mixtures: Effects of solvent reorganization. Phys. Rev. Lett. 2012;109:257802. doi: 10.1103/PhysRevLett.109.257802. [DOI] [PubMed] [Google Scholar]
- [47].Nörtemann K, Hilland J, Kaatze U. Dielectric properties of aqueous NaCl solutions at microwave frequencies. J. Phys. Chem. A. 1997;101:6864–6869. [Google Scholar]
- [48].Obolensky OI, Doerr TP, Ray R, Yu Y-K. Rigorous treatment of electrostatics for spatially varying dielectrics based on energy minimization. Phys. Rev. E. 2009;79:041907. doi: 10.1103/PhysRevE.79.041907. [DOI] [PMC free article] [PubMed] [Google Scholar]
- [49].Reiner ES, Radke CJ. Variational approach to the electrostatic free energy in charged colloidal suspensions: general theory for open systems. J. Chem. Soc. Faraday Trans. 1990;86:3901–3912. [Google Scholar]
- [50].Renou R, Ding M, Zhu H, Szymczyk A, Malfreyt P, Ghoufi A. Concentration dependence of the dielectric permittivity, structure, and dynamics of aqueous NaCl solutions: Comparison between the Drude oscillator and electronic continuum models. J. Phys. Chem. B. 2014;118:3931–3940. doi: 10.1021/jp4118419. [DOI] [PubMed] [Google Scholar]
- [51].Sala J, Guádia E, Marti J. Effects of concentration on structure, dielectric, and dynamic properties of aqueous NaCl solutions using a polarizable model. J. Chem. Phys. 2010;132:214505. doi: 10.1063/1.3429253. [DOI] [PubMed] [Google Scholar]
- [52].Schmidt CC. The dielectric constants of four electrolytes as given by the Carman electrometer method. Phys. Rev. 1927;30:925–930. [Google Scholar]
- [53].Sharp KA, Honig B. Electrostatic interactions in macromolecules: Theory and applications. Annu. Rev. Biophys. Biophys. Chem. 1990;19:301–332. doi: 10.1146/annurev.bb.19.060190.001505. [DOI] [PubMed] [Google Scholar]
- [54].Sheinerman FB, Norel R, Honig B. Electrostatic aspects of protein-protein interactions. Curr. Opin. Struct. Biology. 2000;10:153–159. doi: 10.1016/s0959-440x(00)00065-8. [DOI] [PubMed] [Google Scholar]
- [55].Tresset G. Generalized Poisson–Fermi formalism for investigating size correlation effects with multiple ions. Phys. Rev. E. 2008;78:061506. doi: 10.1103/PhysRevE.78.061506. [DOI] [PubMed] [Google Scholar]
- [56].Wang Z-G. Fluctuation in electrolyte solutions: The self energy. Phys. Rev. E. 2010;81:021501. doi: 10.1103/PhysRevE.81.021501. [DOI] [PubMed] [Google Scholar]
- [57].Wei Y, Sridhar S. Dielectric spectroscopy up to 20 GHz of LiCl/H2O solutions. J. Chem. Phys. 1990;92:923–926. [Google Scholar]
- [58].Wei Y-Z, Chiang P, Sridhar S. Ion size effects on the dynamic and static dielectric properties of aqueous alkali solutions. J. Chem. Phys. 1992;96:4569–4573. [Google Scholar]
- [59].Wen J, Zhou S, Xu Z, Li B. Competitive adsorption and ordered packing of counterions near highly charged surfaces: From mean-field theory to Monte Carlo simulations. Phys. Rev. E. 2012;85:041406. doi: 10.1103/PhysRevE.85.041406. [DOI] [PMC free article] [PubMed] [Google Scholar]
- [60].Xu Z, Ma M, Liu P. Self-energy modified Poisson–Nernst–Planck equations: WKB approximation and finite-difference approaches. Phys. Rev. E. 2014;90:013307. doi: 10.1103/PhysRevE.90.013307. [DOI] [PubMed] [Google Scholar]
- [61].Zhou S, Wang Z, Li B. Mean-field description of ionic size effects with non-uniform ionic sizes: A numerical approach. Phys. Rev. E. 2011;84:021901. doi: 10.1103/PhysRevE.84.021901. [DOI] [PMC free article] [PubMed] [Google Scholar]


