

Abstract
Background
Anaerobic RBC storage reduces oxidative damage, maintains ATP & 2,3-diphosphoglycerate (DPG) levels and has superior 24hr recovery at 6weeks compared to standard storage. This study will determine if removal of CO2 during O2 depletion by gas exchange may affect RBC during anaerobic storage.
Methods
This is a matched 3 arm study (n=14): control, O2&CO2 depleted with Ar (AN), O2 depleted with 95%Ar/5%CO2 (AN[CO2]). RBC in additives AS-3 or OFAS3 were evenly divided into 3 bags, and anaerobic conditions were established by gas exchange. Bags were stored 1-6°C in closed chambers under anaerobic conditions or ambient air, sampled weekly for up to 9weeks for a panel of in vitro tests. A full metabolomics screening was conducted for the first 4 weeks of storage.
Results
Purging with Ar (AN) results in alkalization of the RBC and increased glucose consumption. The addition of 5%CO2 to the purging gas prevented CO2 loss with an equivalent starting and final pH and lactate to control bags (p>0.5, days0-21). ATP levels are higher in AN[CO2] (p<0.0001). DPG was maintained beyond 2 weeks in the AN arm (p<0.0001). Surprisingly, DPG was lost at the same rate in both control and AN[CO2] arms (p=0.6).
Conclusion
Maintenance of ATP in the AN[CO2] arm demonstrates that ATP production is not solely a function of the pH effect on glycolysis. CO2 in anaerobic storage prevented the maintenance of DPG, and DPG production appears to be pH dependent. CO2 as well as O2 depletion provides metabolic advantage for stored RBC.
Keywords: red blood cell storage, anaerobic storage, 2, 3-diphosphoglycerate, ATP, metabolomics
Introduction
Anaerobic storage of red blood cells has been shown to enhance the metabolic status of red blood cells (RBC), and an increase in the potential storage time can be achieved using a variety of additive solutions. 1 When combining an alkaline additive solution with anaerobic storage, we observed that storage under anaerobic conditions yields insignificant benefits in terms of adenosine triphosphate (ATP) levels.2 However, when the RBC additive pH was lowered from 8.1 to 6.5, significant improvement in metabolic parameters and in vivo recovery kinetics were observed under anaerobic conditions.2, 3 The methods used for oxygen depletion in these studies concomitantly removed CO2 and caused an increase in pH. The pH increase is expected to boost the glycolytic rate in the RBC through the pH effect on phosphofructokinase (PFK),4 a rate limiting enzyme in glycolysis. This in turn could lead to better maintenance of ATP in the RBC over storage, protection against hemolysis, and improved in vivo recovery kinetics.5 Recent observations through omics technologies have provided further evidence about the beneficial role of anaerobic storage of packed RBC, such as improved energy metabolism,6 decreased vesiculation and improved morphology-related parameters (e.g. lower levels of non-reversible morphological lesions by the end of the storage period), decreased osmotic fragility, protein fragmentation and vesiculation (as gleaned by 2-dimensional gel electrophoresis), and decreased levels of membrane non-reducible peroxiredoxin 2 in comparison to normoxic controls.7,8
While the studies published so far employed deoxygenation of RBC units through gas exchange with noble gases (either argon3 or helium8), the direct effects of CO2 depletion/supplementation on RBC quality and storage have not been demonstrated. The purpose of the present study is to ascertain whether removal or supplementation of CO2 during oxygen depletion by gas exchange procedures affects RBC ATP, 2,3-diphosphoglycerate (DPG) levels and hemolysis during anaerobic storage for up to 9 weeks. A classic biochemical test panel was complemented with mass spectrometry-based metabolomics analyses, an approach that has been recently successfully adopted to monitor metabolic lesions of RBC stored in different additive solutions, including AS-19, AS-310–12, AS513, SAGM14, MAP15, and PAGGGM16.
Methods
This is a matched, 3-arm, split unit study: Standard aerobic, normocapnic storage conditions (control); oxygen and CO2 depleted anaerobic, hypocapnic storage conditions (AN); and oxygen depleted and CO2 replete anaerobic, hypercapnic storage conditions (initial normocapnic condition; AN[CO2]). The study was conducted at Dartmouth-Hitchcock Medical Center with the authorization of the Committee for the Protection of Human Subjects. Written informed consent was obtained from 14 normal, healthy subjects meeting FDA and AABB donation criteria. Whole blood (500±50mL) was collected into CP2D anticoagulant (Leukotrap RC, Pall Corp., Port Washington, NY), held at room temperature for 30 minutes, centrifuged (2000xG 3 min), and the platelet-rich plasma supernatant expressed into the attached satellite bag and discarded. Additive solution (100mL AS-3 [Nutricel, Pall Medical, Covina CA] or 200mL OFAS3 [University of Iowa School of Pharmacy, Iowa City, Iowa])3 was added to the unit of packed red blood cells, then leukocyte-reduced by filtration with the integral RC2D filter. The unit was divided equally into three 600mL DEHP-PVC bags (Baxter Healthcare, Round Lake, IL). The control bag was mixed for 70 min on an agitator at room temperature then transferred to a 150 mL DEHP PVC bag (Baxter). The anaerobic environments were established for the test units using six cycles of gas exchange with ultra-pure argon (AN) or 95% ultra-pure argon/5% CO2 (AN[CO2]) through a sterilely connected 0.22 μm filter. The blood was transferred to a 150 mL DEHP PVC bag (Baxter) for storage in an anaerobic chamber (Difco BBL, Detroit, MI) that was filled with either 10% hydrogen / 90% argon (AN) or 10% hydrogen / 5% CO2 / 85% Ar (AN[CO2]) at 5-10 psi in the presence of a palladium catalyst to prevent re-oxygenation and to further deplete oxygen during storage. All units were thoroughly mixed, sampled and the chamber was recharged weekly for up to 9 weeks of storage. All units were stored at 1-6° C in a monitored refrigerator (Figure 1).
Figure 1. RBC Processing Scheme.
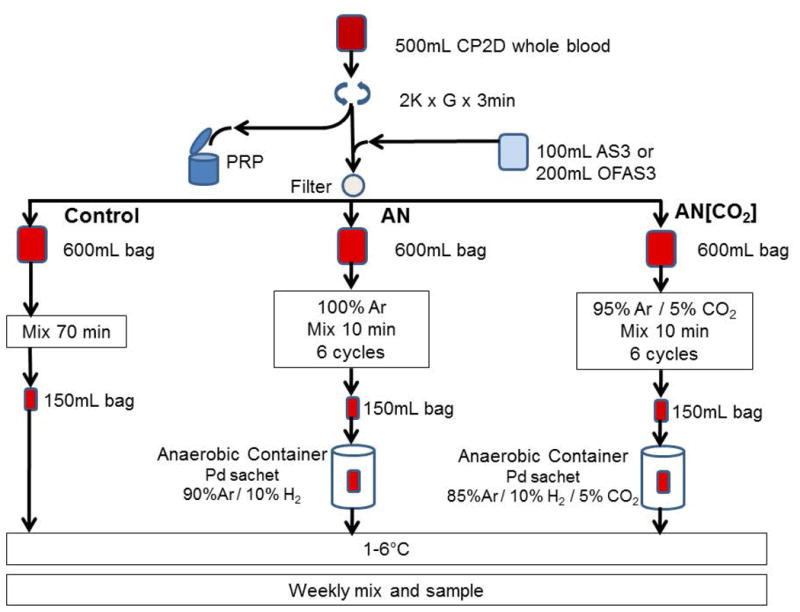
Each unit of CP2D whole blood (n=14) was divided into 3 treatment arms, conditioned and stored for up to 9 weeks. Six (6) units were suspended in 100mL AS-3 and 8 in 200mL OFAS-3. Control= replete with O2 & CO2; AN= depleted of O2 & CO2; AN[CO2] O2 depleted CO2 replete
An evaluation of RBC function was conducted on the day of collection and weekly using a standard panel of in vitro assessments. Automated hematology testing was performed on a hematology analyzer (Sysmex XE2100, Sysmex Corp, Kobe). Spun hematocrits were tested using the Hettich Mikro 20 microhematocrit centrifuge (Hettich, Tuttilingen, Germany). Supernatants from the units were prepared for analysis by double centrifugation at 3600 rpm for 10 min (Hettich Rotanta 460RS, Tuttlingen, Germany). Supernatant sodium and potassium concentrations were determined by ion-specific electrodes, and glucose was determined by glucose oxidase (PPE, Roche Diagnostics, Indianapolis, IN). Lactate was analyzed via a lactate oxidase/peroxidase endpoint reaction on the Cobas Integra (Roche Diagnostics, Indianapolis, IN). The pH, pCO2, and pO2 were measured at 37°C on a blood gas analyzer using electrodes: ion selective electrode for pH, a Severinghaus Bradley type electrode for pCO2, and a Clark type electrode for pO2 (Rapidlab 248, Siemens Healthcare Diagnostics, Tarrytown, NY). Internal pH of the RBC was measured after the method of Högman and Meryman.17 Briefly, the plasma supernatant was removed following centrifugation of the RBC sample (2800xGx10 min), the RBC were lysed with an equal volume of purified water, and pH measured on the blood gas analyzer. Supernatant samples were analyzed for red cell hemoglobin using a Drabkin's reagent method (Sigma, St. Louis, MO) automated on the COBAS FARA (Roche, Indianapolis, IN) with a turbidity correction. A red cell perchloric acid extract was neutralized with 3M K2CO3 and analyzed for ATP using the NADP+ reduction method of Beutler, and 2,3-DPG (Roche Diagnostics, Mannheim) both automated for the COBAS FARA. Microbiological screening was performed at week 9 by injecting 4-5mL of RBC into aerobic and anaerobic culture bottles (BTA FA, BTA FN) and testing in the BacT/ALERT 3D system (bioMérieux, Durham, NC).
Metabolomics analyses
Metabolomics analyses were performed as previously reported.13. Briefly, aliquots were collected on a weekly basis and frozen at -80°C until analyses. Samples were prepared using the automated MicroLab STAR® system from Hamilton Company, and assayed by GC/MS and LC/MS/MS platforms (either a Thermo-Finnigan Trace DSQ fast-scanning single-quadrupole mass spectrometer using electron impact ionization or Waters ACQUITY UPLC and a Thermo-Finnigan LTQ-FT mass spectrometer), run either in positive and negative ion modes with adequate buffer, column, phases and gradient adjustments. Compounds were identified by comparison to library entries of purified standards or recurrent unknown entities within a 5ppm window range. Statistical significance was determined by calculating Welch's two sample t-test and random forest algorithms to determine significantly (p<0.05) altered metabolic pathways. Relative quantitation was performed by exporting integrated peak areas values into Excel (Microsoft, Redmond, CA, USA) for normalization against protein concentrations. 10,13
Analysis and statistics
An a priori assessment of sample size requirements estimated from our prior data indicated we could expect to demonstrate non-inferiority with an equivalency margin of 20%, with a sample size of 12 at a 90% power and alpha risk of 0.05. Mixed effects, repeated measures ANOVA models were used for hypotheses tests and parameter estimates were calculated with SAS (SAS v.9.3, SAS Institute, Cary, NC). Data are mean or estimate ± SE except where noted. Analyses of metabolomics data included ANOVA (significance threshold for p-values < 0.05) and partial least square discriminant analysis (PLS-DA) calculated through the macro MultiBase (freely available at www.NumericalDynamics.com). Hierarchical clustering analysis (HCA) was performed through the software GENE-E (Broad Institute, Cambridge, MA, USA).
Results
As expected, depletion of CO2 together with O2 resulted in the alkalization of the RBC cytosol in AN (Figure 2A). The pH then steadily declined over storage as lactic acid was produced through glycolysis. Depletion of O2 alone with 5%CO2/95%N2 (AN[CO2]) met our objective of matching the pH between this anaerobic arm and the aerobic control arm (p=0.7 days 0-42). Here we report pH as measured at 37°C, a standard reporting practice for RBC storage studies. However, it should be noted that this parameter is temperature dependent. Thus, at the storage condition of 1-6°C pH may be 0.3 to 0.45 units higher than shown. Therefore, specific inferences on optimum pH of enzymes should be made with caution and may require specific functional study and measurements at 1-6°C to be accurate. The main effects of additive solution for all outcomes were insignificant (p>0.3), therefore data are combined for AS-3 and OFAS-3.
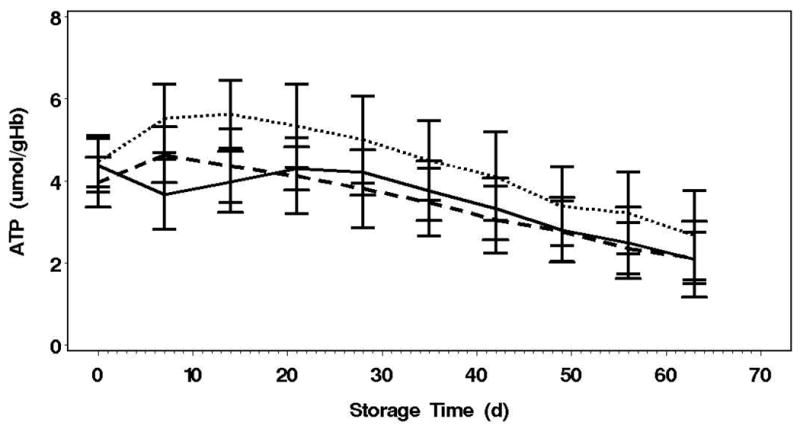
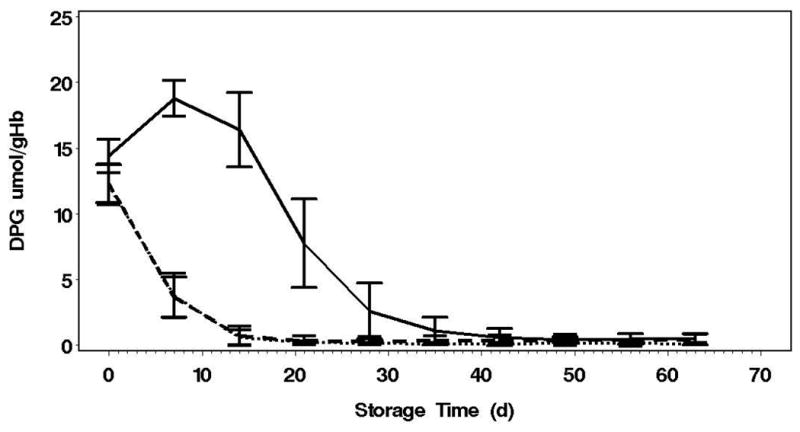
Figure 2. pH, ATP and 2,3-DPG over 63 Day Storage.
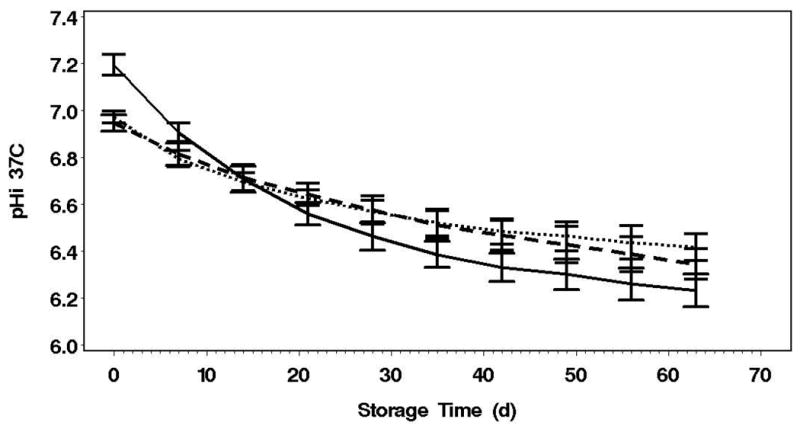
A: Depletion of both CO2 & O2 increased the initial pH and resulted in more rapid decline compared to control and AN[CO2] (p<0.0001). pH does not differ for control and AN[CO2] for the first 42 days.
B: AN[CO2] initially had a faster accumulation plus maintenance of ATP over storage (p<0.0001). AN had a net decrement in ATP during the first 14 days coincident with 2,3,-DPG increase.
C: AN has a net gain of 2,3-DPG over the first 14 days (p<0.0001) and then decline similarly to the other conditions Error bars=2SE, Solid line=AN, Dotted line=AN[CO2], Dashed line=Control
The glycolytic flux, as indicated by lactate production and glucose consumption, was highest in the AN arm (p<0.0001, Table 1). The glycolytic fluxes were not different between the AN[CO2] and control arms. Surprisingly, even though lactate production and glucose consumption were highest in the AN arm, the AN[CO2] units had much greater initial net ATP accumulation over the first 2 weeks of storage than the AN units (Figure 2B, Table 1), and this was maintained through 63 day storage (p<0.0001). In addition, in spite of pHi identical to control, ATP levels in AN were much higher than control. The net loss of 2,3-DPG is the same for the AN[CO2] and control arms. 2,3-DPG levels increased over the first week of storage in AN followed by a decline similar to the other arms from day 14 to 35 (Figure 2C). The increase in 2,3-DPG over the first week in AN units is accompanied by a concomitant drop in ATP that recovers by week 3. Therefore, although the glycolytic flux was matched by controlling pH, the metabolic advantages of the anaerobic conditions indicated by higher ATP and 2,3-DPG levels cannot be totally attributed to the pH effects on PFK.
Table 1. Summary metabolic analyte.
Results are pooled for AS-3 (n=6) and OFAS-3 (n=8) except for glucose where the starting concentrations are different for AS-3 and OFAS-3.
| Arm | Day | pHi (37°C) | pCO2 (37°C) | ATP (μmol/gHb) | 2,3-DPG (μmol/gHb) | Lactate (μmol/gHb) | Glucose (μmol/gHb) | Percent Hemolysis | |
|---|---|---|---|---|---|---|---|---|---|
| AS-3 | OFAS-3 | ||||||||
| Control | 0 | 6.87±0.03 | 70±7 | 4.0±0.6 | 12.3±1.4 | 14±3 | 262±25 | 488±29 | 0.19±0.040 13 - 0.25 |
| 21 | 6.60±0.04 | 92±13 | 4.1±0.9 | 0.3±0.3 | 100±19 | 211±22 | 450±26 | 0.20±0.060 11 - 0.28 |
|
| 42 | 6.46±0.06 | 68±11 | 3.1±0.8 | 0.4±0.4 | 159±21 | 178±21 | 422±35 | 0.32±0.090 20 - 0.47 |
|
| 63 | 6.35±0.07 | 35±9 | 2.1±0.6 | 0.4±0.4 | 201±19 | 152±20 | 397±30 | 0.69±0.370 29 - 1.67* |
|
| AN[CO2] | 0 | 6.89±0.03 | 70±6 | 4.5±0.6 | 12.2±1.6 | 15±3 | 261±25 | 494±41 | 0.18±0.060 12 - 0.26 |
| 21 | 6.56±0.04 | 146±12 | 5.3±1.0† | 0.2±0.1 | 99±12 | 215±19 | 465±33 | 0.20±0.100 13 - 0.45 |
|
| 42 | 6.44±0.04 | 155±15 | 4.1±1.1† | 0.1±0.1 | 146±23 | 191±18 | 439±43 | 0.34±0.130 19 - 0.62 |
|
| 63 | 6.37±0.06 | 144±12 | 2.7±1.1† | 0.1±0.1 | 177±25 | 176±20 | 423±43 | 0.69±0.330 38 - 1.31* |
|
| AN | 0 | 7.22±0.04 | 9±3 | 4.4±0.6 | 14.4±1.3 | 22±3 | 258±24 | 491±38 | 0.18±0.070 09 - 0.31 |
| 21 | 6.59±0.05 | 29±6 | 4.3±0.5 | 7.7±3.4§ | 161±15§ | 180±17 | 430±31 | 0.19±0.060 11 - 0.35 |
|
| 42 | 6.36±0.06 | 29±5 | 3.3±0.7 | 0.6±0.7 | 210±19§ | 152±17 | 395±39 | 0.29±0.100 21 - 0.55 |
|
| 63 | 6.26±0.07 | 13±3 | 2.1±0.9 | 0.5±0.4 | 237±19§ | 139±16 | 381±36 | 0.68±0.350 33 - 1.35* |
|
exceeds regulatory specifications
p<0.0001 compared to control and AN[CO2]
p<0.0001 compared to control and AN
Hemolysis in all arms increased over storage. All units were less than 0.7% hemolysis by day 42, but all three conditions had units over 1% at day 63. As previously reported,18 we observed that hemolysis was strongly subject dependent with intra-class correlation coefficients of 0.61 at day 42 and 0.87 at day 63.
Extended metabolomics were performed on two OFAS3 units (control, AN[CO2], and AN) for days 0-28. The rationale for this choice is based on previous metabolomics reports6,10, suggesting that the bulk of metabolic lesions were detected within this time frame. Metabolomics results are extensively reported in Supplementary Table 1, along with metabolite names, KEGG or human metabolome database IDs, metabolic pathways, original values and values normalized against protein concentrations. Principal component analyses of metabolomics showed a storage effect on metabolism for all 3 conditions, consistent with previous reports on RBC metabolism.10 AN[CO2] units were consistent with control units, as gleaned by both PLS-DA (Figure 3.A) and HCA heat maps (Figure 3.B, Supplementary Figure 1).
Figure 3. PLS-DA and Heat Maps: A.
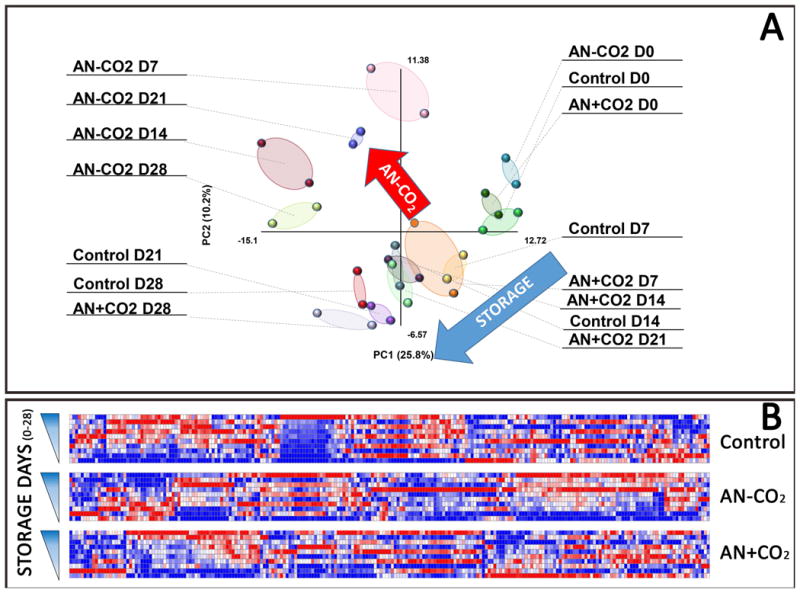
Partial least square-discriminant analysis (PLS-DA) was performed on metabolomics data. The first two principal components accounted for the storage effect or the metabolic effect of CO2 depletion (total anaerobiosis – AN). B: Heat maps show relative metabolite levels (blue = low; red = high) during storage progression in control units, or anaerobic units where CO2 was either removed (AN) or supplemented (AN[CO2]). Metabolite and sample names are provided in vectorial format in Supplementary Figure 1. Both analyses, metabolic profiles in AN[CO2] were closer to those observed in control units rather than being similar to units stored under total anaerobiosis (AN).
In Figures 4-6 we report the results of biochemical and metabolomics analyses divided by pathway: glycolysis (Figure 4), PPP and glutathione homeostasis (Figure 5), purine and arginine metabolism (Figure 6). Consistent with a higher initial pH, the promotion of glycolytic fluxes in hypocapnic anaerobic storage (AN) is further supported by the accumulation of hexose bisphosphate (e.g. fructose bisphosphate), triose phosphates (DPG, phosphoenolpyruvate) and triose end-products pyruvate and lactate. Likewise, the glycolytic fluxes were not different between the AN[CO2] and control arms (Figure 4).
Figure 4. Anaerobic storage and glycolysis.
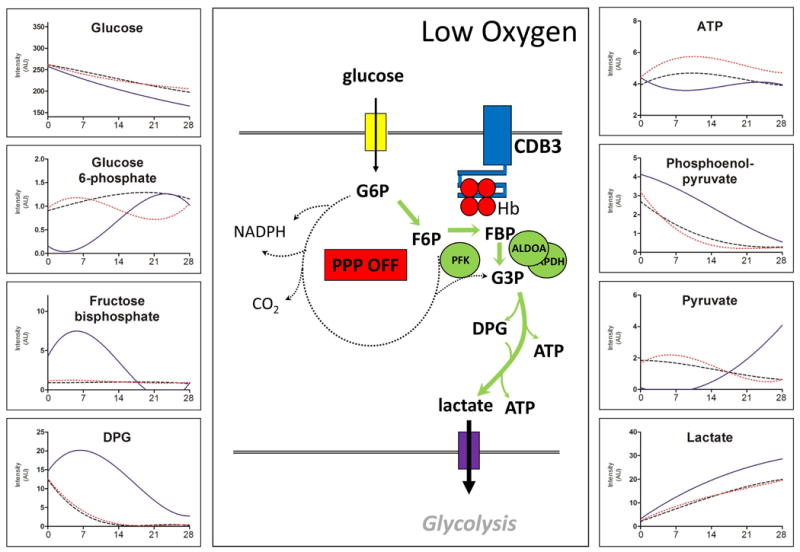
The central panel shows a schematic representation of the oxygen-dependent metabolic modulation mechanism. Deoxyhemoglobin under anaerobic conditions would bind to the N-terminal cytosolic domain of band 3. This would in turn results in the release of glycolytic enzymes from cdB3, increased levels of glycolysis, and deactivation of the pentose phosphate pathway (PPP OFF).
Select metabolomics data for the three arms are shown in the side panels. These results are consistent with the model suggesting the total anaerobiosis promotes faster glucose consumption and accumulation of glycolytic intermediates, DPG, and end products than routine storage under normoxia (control). On the other hand, anaerobic storage with 5% CO2 supplementation (AN[CO2]) promotes ATP preservation at the expense of DPG. Solid line=AN, Dotted line=AN[CO2], Dashed line=Control
Figure 6. Nitrogen and purine metabolism in RBC stored under control or anaerobic conditions.
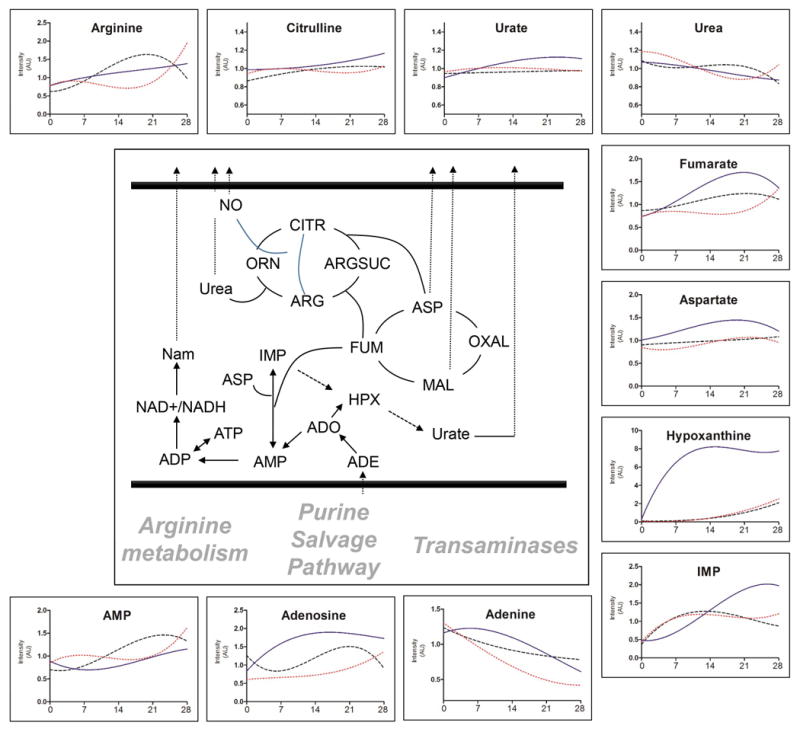
Hypocapnic anaerobic storage promotes purine metabolism and salvage reactions. Solid line=AN, Dotted line=AN[CO2], Dashed line=Control
Figure 5. Pentose Phosphate Pathway and redox homeostasis.
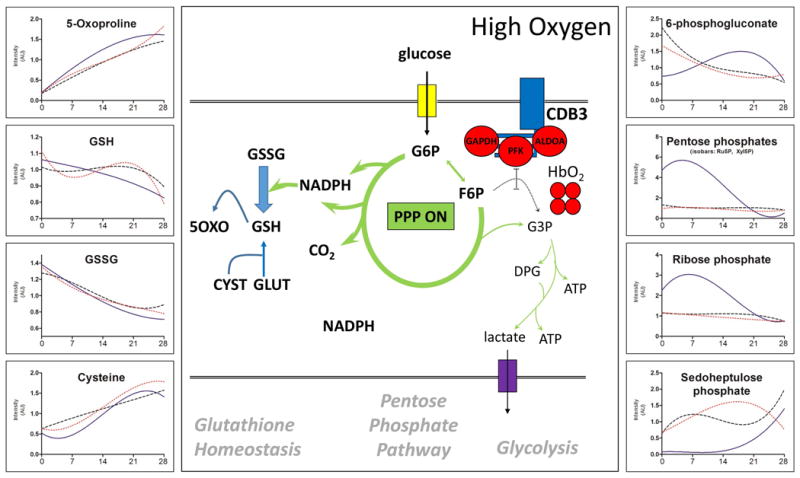
The central panel shows a schematic representation of the oxygen-dependent metabolic modulation mechanism.41 Oxidative stress and increased pO2 during storage in AS-3 is expected (and previously observed10) to trigger activation of the pentose phosphate pathway (PPP ON) to recycle oxidized glutathione (GSSG) back to the reduced form (GSH). However, this mechanism is progressively impaired during storage10,35 and should be negatively affected by anaerobiosis6,36. On the other hand, anaerobiosis should slow Fenton and Haber-Weiss reactions by removing oxygen, a key substrate for pro-oxidant reactions. No significant effect was observed in terms of redox homeostasis in response to anaerobiosis (either in presence or absence of CO2). Metabolic intermediates of the non-oxidative phase of the pentose phosphate pathway (see text) increased in response to total anaerobiosis (AN). Solid line=AN, Dotted line=AN[CO2], Dashed line=Control
Anaerobiosis (either hypo- or hypercapnic) did not influence total glutathione pools (GSH+GSSG), glutathione synthesis (GSH), NADPH-dependent oxidized glutathione reduction, and glutathione turn-over (5-oxoproline) in comparison to controls (Figure 5). At the same time, the levels of non-oxidative phase metabolites of the PPP, ribose phosphate, isobaric pentoses (ribulose 5-phosphate, xyulose 5-phosphate) and sedoheptulose phosphate increased during the first two weeks of storage only in hypocapnic units (AN – Figure 5). No significant effect on arginine metabolism was observed (Figure 6). Purine metabolites, especially products of adenine and AMP deamination – hypoxanthine and IMP, respectively – increased in all groups, but in particular in hypocapnic units (AN – Figure 6).
Discussion
The objective of this study was to determine the effects of CO2 removal when conditioning RBC for anaerobic storage. The initial motivations for storing RBC anaerobically were to reduce oxygen-dependent pro-oxidant reactions resulting in reduced oxidative stress and slowing the development of a storage lesion.19 Previous metabolomics studies on anaerobically stored RBC showed limited or no effect of anaerobic storage on glutathione homeostasis,6 as we confirmed in all arms of this study. At the same time, previous dynamic in silico simulations20 and actual metabolomics assessment6 of RBC responses to hypoxia had documented significant beneficial effects of anaerobic storage on energy metabolism. Previously, we observed that anaerobically stored RBC units consistently have significant improvements in ATP and DPG levels as well as an increased 24-hr recovery compared to the control stored under standard aerobic storage conditions.1–3 In those studies, the anaerobic state of RBC units was established with a large volume Ar gas exchange. The gas exchanges with Ar removes oxygen, but also removes CO2, thereby increasing the cytosolic pH of the RBC and confounding the O2, CO2, and pH effects on the system. Others have suggested that, rather than the effects of oxygen removal, the enhanced metabolic characteristics of these anaerobically stored RBC were simply the result of increased glycolytic flux resulting from the known direct effect of pH on phosphofructokinase (PFK), a rate limiting enzyme of the glycolytic pathway (Embden-Meyerhof pathway, EMP).4 However, here we show that the highest rates of glycolysis, as those observed in the AN (anaerobic, hypocapnic) RBC units, did not result in the highest net ATP production. Rather, the AN[CO2] RBC group (anaerobic, hypercapnic) had the highest net ATP production in spite of having a glycolytic rates and pH similar to the aerobic control group.21
There are several mechanisms within the RBC that may contribute to explain these observations. One possibility is the overall cellular ATP demand in the AN[CO2] RBC is lower than the AN or control groups, although definitive conclusions on the mechanism cannot be drawn based on the present data. On the other hand, one ATP generating step is skipped during production of DPG, which might justify lower levels of ATP in DPG enriched AN RBCs in comparison to AN[CO2] units.
This study revealed that the large increase in DPG levels observed in previous anaerobic storage experiments1,21,22 was dependent on the removal of both O2 and CO2. On the other hand, beneficial effects on ATP, but not DPG, were observed in response to hypoxia alone, since pH alkalization observed in hypocapnic units (AN) was prevented by 5% CO2 supplementation (AN[CO2]). As a result, both control and AN[CO2] units had rapid declines in DPG over the first 2 weeks of storage. In contrast, AN units demonstrated net DPG accumulations over the first 2 weeks, reaching a peak between 1 and 2 weeks with a concomitant net loss of ATP. Of note, a net production of DPG through the Rapoport-Luebering shunt requires a net consumption of ATP23. Following week 2, concomitantly to decline in the intracellular pH, DPG declined as well at a rate similar to the other two groups, reaching undetectable levels at about 5 weeks of storage (Table 1). This diversion of glycolytic flux through the R-L shunt likely reflects a strong initial pH-dependency of the diphosphoglycerate mutase (DPGM), which is subsequently lost during storage. In classic work, Rose described the pH dependence of 2,3-DPG phosphatase having a pH optimum between 6.9 and 7.2 at 37°C, and a strong pH dependence of the enzyme at both 25°C and 4°C for pH 7.5 contrasted with pH 5.5; although the pH dependence at 1-6°C within the range of stored RBC has not been fully described.23–25 However, in a previous study, a mixture of phosphate, inosine, pyruvate, and adenine (PIPA; or Rejuvesol; Cytosol Lab Braintree MA) after 2, 4, 6 and 8 week of anaerobic storage (i.e., AN condition), was successful in restoring 2,3-DPG and ATP, despite the low pH expected in these units.2 This is consistent with Oski's observation that correction of pH was not required to observe the maximum response with this rejuvenation cocktail.26 This observation suggests the possibility of DPGM activity being directly affected by CO2, as an allosteric activator, or via direct reaction (carbamination) to activate its activity. Additional studies are needed to tease out these details.
No significant improvements in glutathione homeostasis were observed in anaerobic units. Glutathione biosynthesis, an ATP-dependent process27, was not favored by higher ATP availability in AN[CO2] units, while both glutathione turn-over to 5-oxoproline or oxidation to GSSG were not affected by anaerobiosis. In the light of previous observations on the beneficial effects of anaerobic storage on morphology, vesiculation, reduced protein fragmentation/vesiculation/oxidation, hemolysis and increased in vivo survival,7,8 these results are suggestive that impaired energy metabolism, rather than oxidative stress, might represent the key injury RBC suffer during routine storage. Alternatively, these results are suggestive that glutathione pools represent poor oxidative stress markers in stored units and better markers, such as non-reducible peroxiredoxin 2 or oxidized lipids might better mirror impairment in redox homeostasis and beneficial contribution by anaerobic storage. 7,28,29
Systemic responses to hypoxia result in the activation of vasodilatory responses, such as the production of nitric oxide (NO).30 Though expressing a functional endothelial nitric oxide synthase,31 RBC did not respond to hypoxia by triggering arginine consumption and urea-independent citrulline accumulation in anaerobic units, a metabolic phenotype that would have suggested ongoing NO synthesis. This confirms a role for RBC in redox-regulated nitrite reductase activities and NO scavenging rather than direct NO biosynthesis.30
As shown by several groups,32–35 the oxygenation state of Hb in the RBC has a direct effect on the percentage of glucose that is oxidized via the EMP or the PPP. In oxygen-rich RBC, oxygenated Hb in the R state (HbR) reduces EMP flux through three effects. i) A reduced affinity of HbR for DPG. DPG is a potent inhibitor of DPGM and EMP enzymes such as pyruvate kinase; ii) HbR releases a H+ (Bohr proton) to the cytosol; in turn, lower pH reduces the activity of PFK and other pH dependent enzymes; iii) HbR has a lower affinity for the N-terminal cytosolic domain of band-3 membrane protein complex (cdB3).32–35 This permits EMP enzymes to associate with cdB3, therefore, curtailing their net activities (central panel - Figure 5). In addition, a larger fraction of glucose shunts through the oxidative portion of the PPP for maintaining the reducing equivalents in the RBC and generating CO2 (central panel - Figure 5). In contrast, under oxygen-depleted conditions, deoxygenated Hb takes on T conformation state (HbT) that increases EMP enzyme activities by binding DPG and H+, as well as competing with EMP enzymes for association with the cdB3 (central panel - Figure 4). This results in a higher flux potential in the EMP. At the same time, the reducing environment under anaerobic condition decreases the NADP+/NADPH ratio, limiting glucose-6-phosphate dehydrogenase (G6PDH) activity by low NADP+ concentrations, restricting glucose-6-phosphate entry into the PPP, consistent with previous observations on RBC exposed to acute36 or chronic hypoxia.6 Additionally, highest EMP rates in response to anaerobiosis acidify intracellular pH, negatively affecting G6PDH activity, that is favored by alkaline pH.37 In contrast, a high O2 concentration results in an environment favorable for oxidative reactions.19 Increased NADP+/NADPH ratio enable flux through the oxidative part of the PPP thereby converting a portion of glucose to CO2. In the absence of flux analysis experiments with 13C1,2-glucose, steady state metabolite levels and pCO2 values can be used to infer fluxes through the PPP.35 The pCO2 data presented here are consistent with this mechanism, as well as with recent metabolomics observations on AS3 RBC.10 Control units had 36% initial increase of pCO2 before declining as dissolved CO2 inside the storage bag at 4°C slowly equilibrated with the pCO2 of the ambient air (∼0.3 mmHg). In contrast, AN units reached the maximum pCO2 later in storage. Inspection of total CO2 suggests the net production rate in AN is lower than in control units, although this cannot be determined with the available data since CO2 resulted from conversion of bicarbonate through carbonic anhydrase, CO2 production in the PPP, and CO2 loss through the bag. These data also suggest that the observed increase in ribose phosphate and PPP non-oxidative phase metabolites (isobaric pentose phosphate compounds and sedoheptulose phosphate - Figure 5) observed in AN units was dependent upon fluxes from transketolase and transaldolase rather than actual fueling from the oxidative branch of the PPP, or rather mirror a bottleneck in salvage reactions of nucleosides. Indeed, the PPP plays a significant role in this expansion of AXP as AMP is synthesized by diverting glucose into the regenerative section of the PPP through fructose-6-phosphate (F6P) and triose phosphates (T3P: dihydroxyacetone phosphate and glyceraldehyde-3-phosphate) bypassing the oxidative part of PPP. In the regenerative part of the PPP, up to 1.2 ribose-5-phosphate (R5P) can be synthesized from one glucose molecule, and R5P can react with adenine and ATP to replenish the AXP.
Repletion of the adenylate pool (AXP) in RBC is a well-known method for restoration of DPG and ATP through salvage reactions.38 Noting that the ratio of ATP:ADP:AMP in RBC is ∼ 25 : 5.5 : 1,39 it is evident that a significant expansion in the AXP must accompany the ∼40% increase in ATP levels of AN[CO2] units compared to the control observed in this study. Consistently, AN[CO2] units were characterized by lower levels of adenine and adenosine, but comparable levels of AMP, suggesting faster salvage of purine bases and nucleosides to preserve the homeostasis of phosphorylated nucleotide forms. On the other hand, in hypocapnic anaerobiosis (AN), adenine depletion corresponded to increased levels of adenosine, other than significantly higher levels (p<0.001) of deamination products of AXP metabolites, such as IMP and hypoxanthine. Of note, the deaminated form of adenosine might either derive from the activity of adenosine deaminase or oxidative stress. In the absence of any significant alteration of glutathione homeostasis across arms of the present study, the latter hypothesis would not justify such a differential metabotype, suggesting that CO2 removal under anaerobic conditions might either promote adenosine deaminase activity or negatively affect the rate of salvage reactions to replenish the AXP. Of note, the activity of adenylosuccinate lyase, a key enzyme in salvage reactions, is pH dependent with an alkaline pH for optimum activity (9.0).40
This investigation focused on the main metabolic effects of anaerobic storage. There were surprisingly few differences in glycolysis between storage under standard aerobic conditions and anaerobic conditions with CO2; the only appreciable difference was increased ATP levels in the latter group, while levels of other glycolytic intermediates were almost indistinguishable between these groups (Figure 4). In contrast, there were significant differences seen between AN (O2 and CO2 depleted) storage and the other 2 groups in every glycolytic measure. Anaerobic storage did not improve glutathione homeostasis, in terms of de novo synthesis, oxidation or turn-over, suggesting that the previously reported beneficial effects of anaerobic storage might stem from oxidative stress-independent mechanisms that are rather affected by energetic homeostasis. Indeed, we also conclude that CO2 removal along with O2 depletion results in ATP levels higher than aerobic controls, and maintains 2,3-DPG for at least 21 days. We demonstrate that a simple pH effect on the PFK activity alone does not account for the observed metabolic advantages of anaerobic storage in terms of ATP preservation in control pH-matched hypercapnic anaerobic units (AN[CO2]). Additional studies will be needed to further elucidate metabolic modulation under CO2 depleted, anaerobic conditions, for example to test whether alkaline or chloride free additives might mimic the beneficial effects of hypocapnic anaerobiosis by promoting glycolytic enzyme activities. In addition, it will be worth exploring whether optimum O2 and CO2 concentrations during deoxygenation might further promote metabolic modulation in stored RBC. Anaerobic storage of RBC presents a new opportunity to further investigate the mechanisms underlying metabolic storage lesions, as to improve the quality of stored RBC for transfusion.
Supplementary Figure 1: Heat maps show relative metabolite levels (blue = low; red = high) during storage progression in control units, or anaerobic units where CO2 was either removed (AN) or supplemented (AN[CO2]). Metabolite and sample names are either provided in the right hand side of the figure or on top of the maps
Supplementary Material
Acknowledgments
The authors extend their gratitude to the volunteers that participated as subjects in this study. The authors also thank Sharry Baker, Kristin E. Calcagni, Molly L. Housman, Susan L.Waters, and Louise H. Herschel for their technical contributions.
This work was supported by a grant from National Institute of Health (R44HL088848 to TY)
Footnotes
Conflict of Interest: This study was sponsored by New Health Sciences, Inc. as the awardee of an SBIR grant (R44HL088848). TY is an employee of New Health Sciences. LD and ZS receive research support from New Health Sciences, Inc., and LD and AD are consultants.
References
- 1.Yoshida T, AuBuchon JP, Tryzelaar L, Foster KY, Bitensky MW. Extended storage of red blood cells under anaerobic conditions. Vox Sang. 2007;92(1):22–31. doi: 10.1111/j.1423-0410.2006.00860.x. [DOI] [PubMed] [Google Scholar]
- 2.Yoshida T, AuBuchon JP, Dumont LJ, Gorham JD, Gifford SC, Foster KY, et al. The effects of additive solution pH and metabolic rejuvenation on anaerobic storage of red cells. Transfusion. 2008;48(10):2096–105. doi: 10.1111/j.1537-2995.2008.01812.x. [DOI] [PubMed] [Google Scholar]
- 3.Dumont LJ, Yoshida T, AuBuchon JP. Anaerobic storage of red blood cells in a novel additive solution improves in vivo recovery. Transfusion. 2009;49(3):458–64. doi: 10.1111/j.1537-2995.2008.02038.x. [DOI] [PMC free article] [PubMed] [Google Scholar]
- 4.Erecińska M, Deas J, Silver IA. The effect of pH on glycolysis and phosphofructokinase activity in cultured cells and synaptosomes. J Neurochem. 1995;65(6):2765–72. doi: 10.1046/j.1471-4159.1995.65062765.x. [DOI] [PubMed] [Google Scholar]
- 5.Hess JR. Storage of red blood cells under anaerobic conditions. Vox Sang. 2007;93(2):183. doi: 10.1111/j.1423-0410.2007.00915.x. author reply 184. [DOI] [PubMed] [Google Scholar]
- 6.D'Alessandro A, Gevi F, Zolla L. Red blood cell metabolism under prolonged anaerobic storage. Mol Biosyst. 2013;9(6):1196. doi: 10.1039/c3mb25575a. [DOI] [PubMed] [Google Scholar]
- 7.Longo V, D'alessandro A, Zolla L. Deoxygenation of leucofiltered erythrocyte concentrates preserves proteome stability during storage in the blood bank. Blood Transfus Trasfus Sangue. 2014;12(4):599–604. doi: 10.2450/2014.0335-13. [DOI] [PMC free article] [PubMed] [Google Scholar]
- 8.Zolla L, D'Alessandro A. An Efficient Apparatus for Rapid Deoxygenation of Erythrocyte Concentrates for Alternative Banking Strategies. J Blood Transfus. 2013 doi: 10.1155/2013/896537. [DOI] [PMC free article] [PubMed] [Google Scholar]
- 9.Roback JD, Josephson CD, Waller EK, Newman JL, Karatela S, Uppal K, et al. Metabolomics of ADSOL (AS-1) Red Blood Cell Storage. Transfus Med Rev. 2014;28(2):41–55. doi: 10.1016/j.tmrv.2014.01.003. [DOI] [PMC free article] [PubMed] [Google Scholar]
- 10.D'Alessandro A, Nemkov T, Kelher M, West FB, Schwindt RK, Banerjee A, et al. Routine storage of red blood cell (RBC) units in additive solution-3: a comprehensive investigation of the RBC metabolome. Transfusion. 2014 doi: 10.1111/trf.12975. [DOI] [PMC free article] [PubMed] [Google Scholar]
- 11.Van 't Erve TJ, Doskey CM, Wagner BA, Hess JR, Darbro BW, Ryckman KK, et al. The Heritability of Glutathione and Related Metabolites in, Stored Red Blood Cells. Free Radic Biol Med. 2014;76:107–13. doi: 10.1016/j.freeradbiomed.2014.07.040. [DOI] [PMC free article] [PubMed] [Google Scholar]
- 12.Van 't Erve TJ, Wagner BA, Martin SM, Knudson CM, Blendowski R, Keaton M, et al. The heritability of metabolite concentrations in stored human red blood cells. Transfusion. 2014;54(8):2055–63. doi: 10.1111/trf.12605. [DOI] [PMC free article] [PubMed] [Google Scholar]
- 13.D'Alessandro A, Hansen KC, Silliman CC, Moore EE, Kelher M, Banerjee A. Metabolomics of AS-5 RBC supernatants following routine storage. Vox Sang. 2015;108(2):131–40. doi: 10.1111/vox.12193. [DOI] [PMC free article] [PubMed] [Google Scholar]
- 14.D'Alessandro A, D'Amici GM, Vaglio S, Zolla L. Time-course investigation of SAGM-stored leukocyte-filtered red bood cell concentrates: from metabolism to proteomics. Haematologica. 2012;97(1):107–15. doi: 10.3324/haematol.2011.051789. [DOI] [PMC free article] [PubMed] [Google Scholar]
- 15.Nishino T, Yachie-Kinoshita A, Hirayama A, Soga T, Suematsu M, Tomita M. In silico modeling and metabolome analysis of long-stored erythrocytes to improve blood storage methods. J Biotechnol. 2009;144(3):212–23. doi: 10.1016/j.jbiotec.2009.08.010. [DOI] [PubMed] [Google Scholar]
- 16.Nishino T, Yachie-Kinoshita A, Hirayama A, Soga T, Suematsu M, Tomita M. Dynamic simulation and metabolome analysis of long-term erythrocyte storage in adenine-guanosine solution. PloS One. 2013;8(8):e71060. doi: 10.1371/journal.pone.0071060. [DOI] [PMC free article] [PubMed] [Google Scholar]
- 17.Högman CF, Löf H, Meryman HT. Storage of red blood cells with improved maintenance of 2,3-bisphosphoglycerate. Transfusion. 2006;46(9):1543–52. doi: 10.1111/j.1537-2995.2006.00893.x. [DOI] [PubMed] [Google Scholar]
- 18.McAteer MJ, Dumont LJ, Cancelas J, Rugg N, Vassallo R, Whitley P, et al. Multi-institutional randomized control study of haemolysis in stored red cell units prepared manually or by an automated system. Vox Sang. 2010;99(1):34–43. doi: 10.1111/j.1423-0410.2010.01313.x. [DOI] [PubMed] [Google Scholar]
- 19.Yoshida T, Shevkoplyas SS. Anaerobic storage of red blood cells. Blood Transfus Trasfus Sangue. 2010;8(4):220–36. doi: 10.2450/2010.0022-10. [DOI] [PMC free article] [PubMed] [Google Scholar]
- 20.Yachie-Kinoshita A, Nishino T, Shimo H, Suematsu M, Tomita M. A metabolic model of human erythrocytes: practical application of the E-Cell Simulation Environment. J Biomed Biotechnol. 2010;2010:642420. doi: 10.1155/2010/642420. [DOI] [PMC free article] [PubMed] [Google Scholar]
- 21.Yoshida T, AuBuchon JP. Storage of red blood cells under anaerobic conditions: Reply. Vox Sang. 2007;93(2):184–184. doi: 10.1111/j.1423-0410.2007.00915.x. [DOI] [PubMed] [Google Scholar]
- 22.Dumont LJ, Yoshida T, AuBuchon JP. Anaerobic storage of red blood cells in a novel additive solution improves in vivo recovery. Transfusion. 2009;49(3):458–64. doi: 10.1111/j.1537-2995.2008.02038.x. [DOI] [PMC free article] [PubMed] [Google Scholar]
- 23.Rapoport I, Berger H, Elsner R, Rapoport S. PH-dependent changes of 2,3-bisphosphoglycerate in human red cells during transitional and steady states in vitro. Eur J Biochem FEBS. 1977;73(2):421–7. doi: 10.1111/j.1432-1033.1977.tb11333.x. [DOI] [PubMed] [Google Scholar]
- 24.Rose ZB, Dube S. Rates of phosphorylation and dephosphorylation of phosphoglycerate mutase and bisphosphoglycerate synthase. J Biol Chem. 1976;251(16):4817–22. [PubMed] [Google Scholar]
- 25.Rose ZB, Liebowitz J. 2,3-diphosphoglycerate phosphatase from human erythrocytes. General properties and activation by anions. J Biol Chem. 1970;245(12):3232–41. [PubMed] [Google Scholar]
- 26.Oski FA, Travis SF, Miller LD, Delivoria-Papadopoulos M, Cannon E. The In Vitro Restoration of Red Cell 2,3-Diphosphoglycerate Levels in Banked. Blood. 1971;37(1):52–8. [PubMed] [Google Scholar]
- 27.Raftos JE, Whillier S, Kuchel PW. Glutathione Synthesis and Turnover in the Human Erythrocyte alignment of a model based on detailed enzyme kinetics with experimental data. J Biol Chem. 2010;285(31):23557–67. doi: 10.1074/jbc.M109.067017. [DOI] [PMC free article] [PubMed] [Google Scholar]
- 28.Van 't Erve TJ, Lih FB, Kadiiska MB, Deterding LJ, Eling TE, Mason RP. Reinterpreting the best biomarker of oxidative stress: The 8-iso-PGF2α/PGF2α ratio distinguishes chemical from enzymatic lipid peroxidation. Free Radic Biol Med. 2015;83:245–51. doi: 10.1016/j.freeradbiomed.2015.03.004. [DOI] [PMC free article] [PubMed] [Google Scholar]
- 29.Zimring JC, Smith N, Stowell SR, Johnsen JM, Bell LN, Francis RO, et al. Strain-specific red blood cell storage, metabolism, and eicosanoid generation in a mouse model: Metabolomics of RBC Donor Variability in Mice. Transfusion. 2014;54(1):137–48. doi: 10.1111/trf.12264. [DOI] [PMC free article] [PubMed] [Google Scholar]
- 30.Crawford JH, Isbell TS, Huang Z, Shiva S, Chacko BK, Schechter AN, et al. Hypoxia, red blood cells, and nitrite regulate NO-dependent hypoxic vasodilation. Blood. 2006;107(2):566–74. doi: 10.1182/blood-2005-07-2668. [DOI] [PMC free article] [PubMed] [Google Scholar]
- 31.Kleinbongard P, Schulz R, Rassaf T, Lauer T, Dejam A, Jax T, et al. Red blood cells express a functional endothelial nitric oxide synthase. Blood. 2006;107(7):2943–51. doi: 10.1182/blood-2005-10-3992. [DOI] [PubMed] [Google Scholar]
- 32.Rogers SC, Said A, Corcuera D, McLaughlin D, Kell P, Doctor A. Hypoxia limits antioxidant capacity in red blood cells by altering glycolytic pathway dominance. FASEB J. 2009;23(9):3159–70. doi: 10.1096/fj.09-130666. [DOI] [PMC free article] [PubMed] [Google Scholar]
- 33.Castagnola M, Messana I, Sanna MT, Giardina B. Oxygen-linked modulation of erythrocyte metabolism: state of the art. Blood Transfus Trasfus Sangue. 2010;8(Suppl 3):s53–8. doi: 10.2450/2010.009S. [DOI] [PMC free article] [PubMed] [Google Scholar]
- 34.Lewis IA, Campanella ME, Markley JL, Low PS. Role of band 3 in regulating metabolic flux of red blood cells. Proc Natl Acad Sci U S A. 2009;106(44):18515–20. doi: 10.1073/pnas.0905999106. [DOI] [PMC free article] [PubMed] [Google Scholar]
- 35.Messana I, Ferroni L, Misiti F, Girelli G, Pupella S, Castagnola M, et al. Blood bank conditions and RBCs: the progressive loss of metabolic modulation. Transfusion. 2000;40(3):353–60. doi: 10.1046/j.1537-2995.2000.40030353.x. [DOI] [PubMed] [Google Scholar]
- 36.Rogers SC, Said A, Corcuera D, McLaughlin D, Kell P, Doctor A. Hypoxia limits antioxidant capacity in red blood cells by altering glycolytic pathway dominance. FASEB J. 2009;23(9):3159–70. doi: 10.1096/fj.09-130666. [DOI] [PMC free article] [PubMed] [Google Scholar]
- 37.Cohen P, Rosemeyer MA. Human Glucose-6-Phosphate Dehydrogenase: Purification of the Erythrocyte Enzyme and the Influence of Ions on its Activity. Eur J Biochem. 1969;8(1):1–7. doi: 10.1111/j.1432-1033.1969.tb00487.x. [DOI] [PubMed] [Google Scholar]
- 38.Meyer EK, Dumont DF, Baker S, Dumont LJ. Rejuvenation capacity of red blood cells in additive solutions over long-term storage. Transfusion. 2011;51(7):1574–9. doi: 10.1111/j.1537-2995.2010.03021.x. [DOI] [PubMed] [Google Scholar]
- 39.Lentner C. Geigy scientific tables. West Caldwell, N.J.: CIBA-GEIGY Corporation; 1984. pp. 111–113. [Google Scholar]
- 40.Toth EA, Yeates TO. The structure of adenylosuccinate lyase, an enzyme with dual activity in the de novo purine biosynthetic pathway. Structure. 2000;8(2):163–74. doi: 10.1016/s0969-2126(00)00092-7. [DOI] [PubMed] [Google Scholar]
- 41.Castagnola M, Messana I, Sanna MT, Giardina B. Oxygen-linked modulation of erythrocyte metabolism: state of the art. Blood Transfus Trasfus Sangue. 2010;8(Suppl 3):s53–8. doi: 10.2450/2010.009S. [DOI] [PMC free article] [PubMed] [Google Scholar]
Associated Data
This section collects any data citations, data availability statements, or supplementary materials included in this article.