Abstract
Third-hand smoke (THS) is a new cigarette-related issue defined as the residual contamination from cigarette smoke after a cigarette is extinguished. To detect THS on three commonly used clothing fibers—wool, cotton, and polyester, we applied two methods to measure the adsorption of THS: one was the gain of mass with an analytical balance after exposure to cigarette smoke; and the other was to detect the THS chemical compounds such as nicotine and 3-ethenylpyridine with a surface acoustic wave (SAW) sensor composed of coated oxidized hollow mesoporous carbon nanospheres. In the mass measurement, the gain of mass decreased in the order wool, cotton, and polyester; the latter gain was about one tenth that of wool. In the SAW detection, the frequency shift decreased in the same order—wool, cotton, and polyester. The residence period of THS on natural fiber (wool and cotton) is greater than on synthetic polyester fiber. These two tests provide quantitative results of THS on varied clothing fibers, to assess their risk after exposure to cigarette smoke.
I. INTRODUCTION
Environmental tobacco smoke (ETS) is composed mainly of side-stream smoke emitted from the burning end of a cigarette.1 Most analysis of ETS has been focused on an evaluation of the quality of indoor air, because it could be important to avoid a risk for non-smokers.2,3 Of emerging concern is that pollutants from tobacco smoke not only remain during active smoking or second-hand smoke (SHS) but also cling to hair, skin, clothing, and furniture surfaces and are contained in dust;4 these compounds from tobacco smoke have been defined as third-hand smoke (THS).5,6 THS implies a residual contamination from tobacco smoke that remains after a cigarette is extinguished. THS is difficult to eliminate on opening windows or using fans, leading to exposure prolonged for more than two months, becoming a new cigarette-related issue for scientists and researchers.7 The comparison between SHS and THS is listed in Table I in terms of sources, major compounds, and related diseases.
TABLE I.
Comparison between second-hand smoke (SHS) and third-hand smoke (THS).
| Secondhand smoke (SHS) | Thirdhand smoke (THS) | |
|---|---|---|
| Source | Composed of the main-stream smoke exhaled by active smokers and side-stream smoke expelled from the lit tobacco product | A residual contamination from tobacco smoke that remains after cigarette is extinguished, usually cling to hair, skin, clothing, and furniture surfaces |
| Major compounds | Benzene, toluene, styrene, acetone, xylene, naphthalene, formaldehyde, polonium-210, phenol, PAHs, nicotine, 3-ethenylpyridine, carbon monoxide, and N-nitrosamine | Nicotine, 3-ethenylpyridine, phenol, cresols, formaldehyde, tobacco-specific nitrosamines, naphthalene, xylene, styrene, benzene, and toluene (Basically, the compounds of THS are very similar to SHS but at lower concentration) |
| Related disease | Lung cancer, oral cancer, asthma, chronic obstructive pulmonary disease (COPD), and coronary heart disease | Allergic symptoms, asthma, and altering brain and lung development in children |
The chemicals in THS are reported to re-emit back into the air during aging or to react with ambient oxidants and nitrous acid to form secondary pollutants, such as tobacco-specific nitrosamines (TSNA) which are well known to be toxic carcinogens.8,9 Besides TSNA, hydrogen cyanide, butane, toluene, formaldehyde, even radioactive polonium-210 and polycyclic aromatic hydrocarbons (PAHs) are found in THS.10 Although human exposure to THS has not been fully studied, it is still possible to predict the detrimental effects on human health from some THS compounds, resulting in an increased risk of damage to DNA, allergic symptoms, asthma, inflammation, and even altering brain and lung development in children.11,12 THS exposure can be delivered through skin, ingestion, and inhalation; infants and young children are the group most susceptible to THS-contaminants in house dust and surfaces through hand-to-mouth behavior and crawling on the floor.13
Because third-hand smoke is a relatively new concept, there is no strict policy to ban THS; making a sensitive THS sensor is hence important and essential to protect people from long-term tobacco hazards.7 To detect THS in a real environment, choosing a marker for sampling is needed. Such a marker should ideally be specific to tobacco smoke, stable, and easily obtainable; the most widely used markers are nicotine and 3-ethenylpyridine (3-EP).14 This research is focused on THS absorbed on clothing fibers, using a surface acoustic wave (SAW) gas sensor to detect the volatile components of THS.
The basic principle of a SAW sensor is that the coated interdigital transducer (IDT) stimulates a piezoelectric substrate with a stable resonant frequency when a RF voltage is applied in the range of resonant frequency from MHz to GHz depending on the design of the IDT and substrates. When the target is adsorbed by the sensing layer, the surface acoustic wave slows because of the mass loading, so the resonant frequency decreases.
II. MATERIALS AND METHODS
A. Fabrication of surface acoustic wave chips
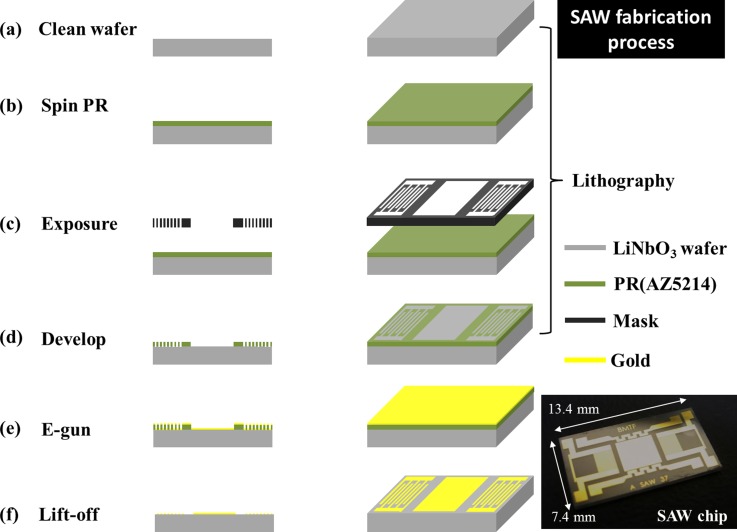
The SAW chips with center frequency 117.4 MHz were fabricated with MEMS techniques in a well design; IDTs and a delay line were patterned on a 128° YX-LiNbO3 piezoelectric wafer with a photolithographic process; gold IDT (thickness 100 nm) was deposited with an e-gun. Each side of IDT has 50 pairs; the finger width is 8.5 μm. After a lift-off process, a chip has size 13.4 mm × 7.4 mm and actual central frequency 114.2 MHz, measured with a network analyzer. The mainly process included three steps—lithography, e-gun evaporation, and lift off, shown in Fig. 1.
FIG. 1.
Schematic of fabrication of a surface acoustic wave chip; an actual SAW chip is shown at the bottom right corner.
1. Lithographic process
The lithium niobate (LiNbO3) wafer was first cleaned through washing with acetone, isopropanol (IPA), deionized water, and final immersion into piranha solution (sulfuric acid: hydrogen peroxide = 7:1) for 10 min at 90 °C. Before coating the photoresist on the wafer, hexamethyldisilazane (HMDS) vapor was deposited on the wafer for 5 min to increase the adhesion between the photoresist and the substrate surface. The positive photoresist (AZ5214) was spin-coated at 3000 rpm for 30 s; the wafer was coated with photoresist (1 μm). To remove most photoresist solvent, the temperature for a soft baking was set at precisely 100 °C with baking duration 1 min. After UV exposure, developer AZ400K served to develop the photoresist (AZ400K:DI water = 1:4), which was inspected with a microscope to verify the developing precision of the IDT pattern.
2. E-gun evaporation
When the pattern of the IDT electrode was completed, Au and Cr were deposited (thicknesses 100 nm and 20 nm) on a lithium niobate substrate with an E-gun.
3. Lift off
After evaporation of Au, the deposited wafer was immersed in acetone ultrasonically to eliminate unnecessary photoresist so that the metal area became defined. The finished wafer was diced into chips to complete the fabrication.
B. Sensing material
Because cigarette smoke marker 3-EP has an amine group, which forms a hydrogen bond with a carboxyl group, this physical bonding lets the SAW sensor detect repeatedly. The sensing material for a SAW sensor typically uses a polymer-based film, combining with nanostructure is also a trend to increase surface area and improve the sensitivity,15,16 but some drawbacks include lack of thermal stability and a mismatch between the glass transition temperature and the ambient temperature. Further, some vapor permeates into the polymer and causes the polymer film to expand, called a swelling effect, hindering the repeatability and reliability of a SAW sensor.17
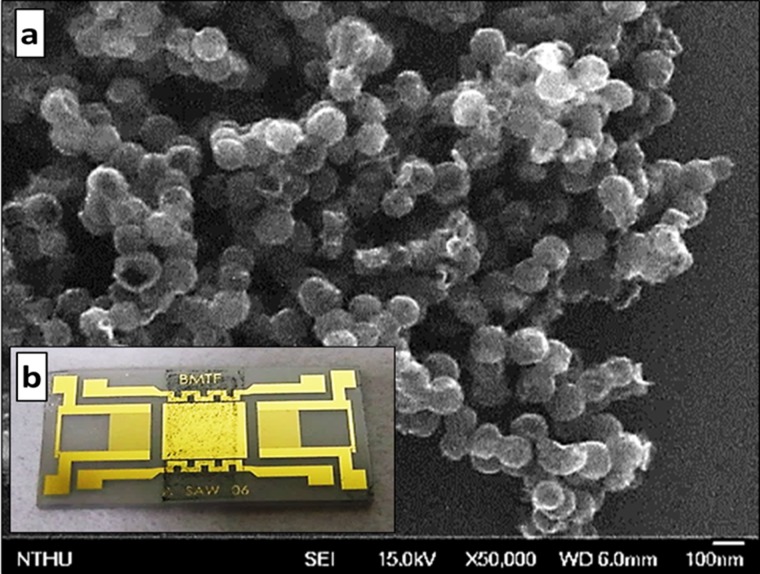
To avoid the disadvantages of a polymer, a non-polymer-based sensing material, oxidized hollow mesoporous carbon nanospheres (O-HMC) is a suitable choice for detection because of a large specific surface area (1500 m2/g) for rapid detection, many more carboxyl groups for increased sensitivity and stability relative to a polymer. The O-HMC is modified on chemical oxidation of hollow mesoporous carbon nanospheres (HMC, each sphere has size in a range 80–120 nm; the pore size is about 4 nm), treated with nitric acid solution (2.5 M) for 15 h at 80 °C to introduce carboxylic groups on the carbon framework,18 shown in Fig. 2(a). O-HMC is solid after fabrication; in facilitate coating, a sensing material (10 mg) is added into ethanol (1 ml) as solvent. Before coating, aggregation of this sensing material was prevented through ultra-sonication for 20 min, spin coating with great uniformity at 1500 rpm, and final heating at 90 °C for 10 min to remove the solvent, shown in Fig. 2(b).
FIG. 2.
(a) SEM image of oxidized hollow mesoporous carbon nanospheres (O-HMC); (b) spin-coated SAW chip with O-HMC (sensing layer thickness 1 μm).
C. Sensing system
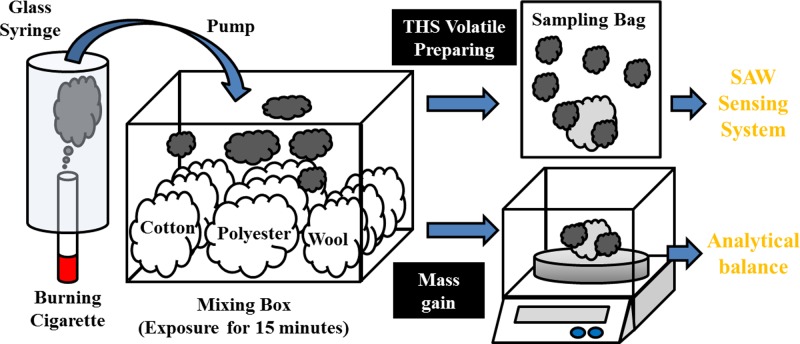
To detect THS on clothing fibers, we prepared fiber of three common types, cotton and wool as natural fibers and polyester as synthetic fiber; their characteristics are presented in Table II. All fibers were purchased from a local fiber market and used without further treatment or dye, cut into pieces (mass 0.2 g) and stored in dry air before use. A lit cigarette (Marlboro, tar 10 mg and nicotine 0.8 mg per cigarette) was placed on the bottom of a glass syringe and the cigarette smoke was drawn with a pump (Thomas, diaphragm pump 2002, 400 ml/min) into a mixing box. The fiber samples were placed in a random order in that box, made of acrylonitrile butadiene styrene (ABS) (internal dimensions width 24 cm × depth 16 cm × height 12 cm, volume about 4.6 l) and exposed to cigarette smoke for 15 min.
TABLE II.
Characteristics of three tested clothing fibers.
| Fiber types | Composition | Main functional group | Appearance |
|---|---|---|---|
| Natural | |||
| Wool | Cysteine | Thiol, carboxylic acid, amine | Cuticle shape |
| Cotton | Cellulose | Alcohol | Hollow, flat |
| Man-made | |||
| Polyester | Polyethylene terephthalate | Benzene, ester | Smooth, strip |
After that exposure, two tests were undertaken. In one test, the exposed fiber was placed in a sampling bag and filled with dry air (relative humidity 20%), then sealed for 1 h to release the volatile THS from the fiber; the THS sample was detected with a SAW system, providing a quantitative analysis of the amount of THS on the fiber. The other test was to measure, with an analytical balance, the mass gained after adsorption of cigarette smoke; each run was made in triplicate. A schematic diagram of the two tests is shown in Fig. 3.
FIG. 3.
Schematic diagram of two tests of THS on clothing fiber; one with the THS volatile compounds for SAW sensing and another measuring the mass gain of fibers exposed to cigarette smoke.
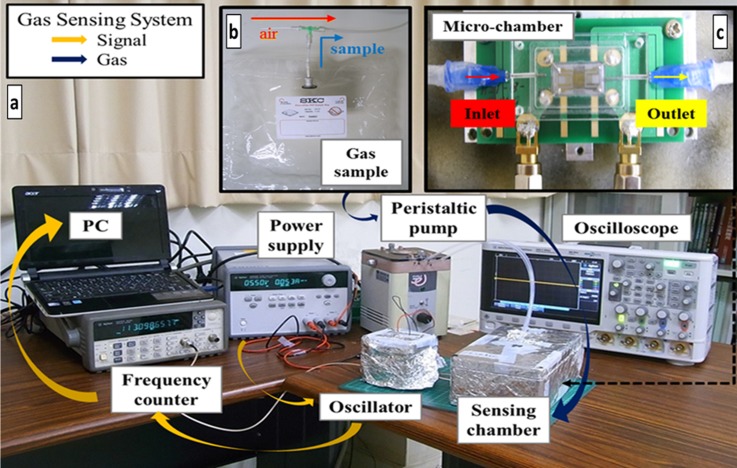
The SAW sensing system is shown in Fig. 4(a); the sample of gaseous third-hand smoke was prepared in the sampling bag with a three-way valve to switch to a sample or dry air, shown in Fig. 4(b). Before SAW detection, the sampling bag was left at ambient temperature for 15 min to prevent any influence of temperature on cigarette smoke; the cigarette sample was prepared on collecting the smoke of a burning cigarette into the sampling bag. To decrease the gas-diffusion volume and the response time, a self-designed micro-chamber (800 μl) was mounted on the printed circuit board (PCB), shown in Fig. 4(c). For a dynamic detection, a sample was drawn into the micro-chamber through a needle with a peristaltic pump (flow rate 20 ml/min). At the beginning of tests, dry air flowed into the chamber until the frequency response was stable; the THS sample channel was then switched for adsorption and eventually the dry air valve was opened again to purge the sensing material and to complete one cycle. The frequency response was recorded in a computer with a GPIB card, which was connected to a frequency counter. All detection took an untreated HMC-coated SAW as reference to remove environmental interference, such as from humidity and temperature.
FIG. 4.
(a) Experimental setup of the SAW sensor system. Orange arrows indicate the signal of the frequency response; deep blue arrows show the delivery of gas; (b) sampling bag with a three-way valve to switch air or a gaseous sample; (c) a self-designed micro-chamber (volume 800 μl)
III. RESULTS
A. THS detection with an analytical balance
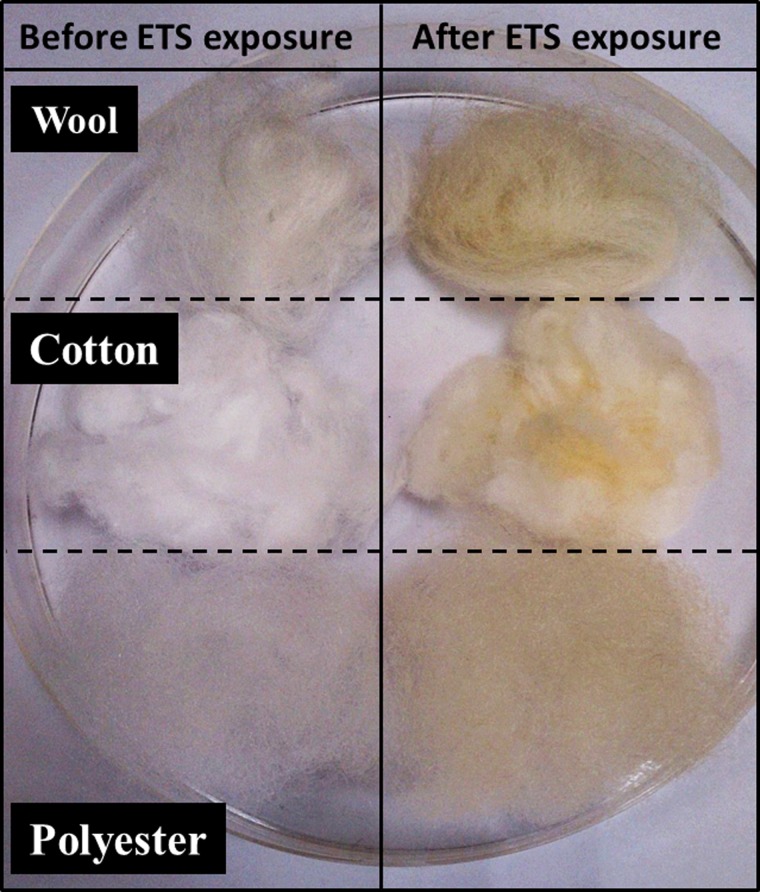
Two tests were used to determine the amount of THS on clothing fibers. When the clothing fiber was exposed to cigarette smoke, many chemical compounds adhered to the fiber, causing a color change. We compared the appearances of three fibers before and after exposure to ETS, shown in Fig. 5. Before ETS exposure, all undyed fibers are white, except wool that showed a slightly yellow color, but all fibers become yellow after exposure to ETS because of the adhesion by tar; the two natural fibers were more yellow than the polyester.
FIG. 5.
Appearance of tested fibers before and after exposure to ETS.
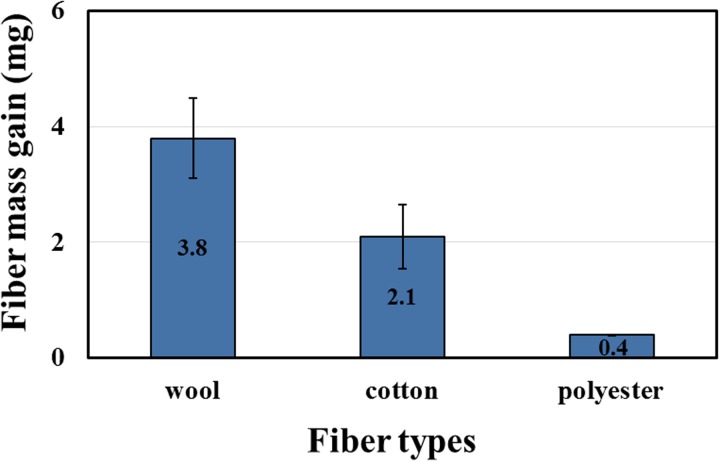
In addition to the observation of the color difference, we measured the gain of mass from ETS adsorption with an analytical balance. The initial mass of all fibers was 0.2 g. The average ETS increase is shown in Figure 6; every fiber was measured at least in triplicate and weighed immediately after ETS exposure. Among these fibers, the mass gain of wool was 3.8 ± 0.7 mg, cotton 2.1 ± 0.55 mg, and polyester 0.4 ± 0.01 mg; hence all fibers gained mass. The wool fiber adsorbed more tar and particles as it had more functional groups to adsorb cigarette smoke; the cuticle shape of wool also provided an increased opportunity to trap substances in THS. The mass gain of polyester was about one tenth that of wool; this large disparity results because the polyester fiber has a smooth and hydrophobic surface, leading to decreased chemical adhesion. The result of the mass gain on the clothing fibers is consistent with the color change, mentioned above.
FIG. 6.
Mean mass gain of three fibers. The initial mass of all fibers was 0.2 g.
B. THS detection with a SAW gas sensor
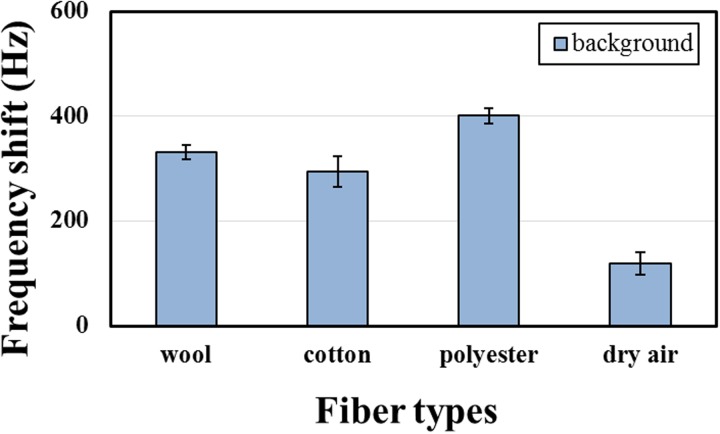
To investigate the amount of THS volatile on clothing fibers, we used a self-designed surface acoustic wave gas sensor to detect the chemical compounds in the vapor or gaseous phase, such as cigarette-related nicotine and 3-EP. The selectivity of a sensing material to cigarette smoke was demonstrated in previous tests. When a fiber adsorbs ETS, some toxic and harmful substances become re-emitted into the air; before their detection, the background frequency shift with a pure fiber must be measured, shown in Fig. 7. Because of varied moisture regained by fibers, putting a pure fiber into a sampling bag leads to a new moisture equilibrium therein; the measurement of the background is useful to calibrate the frequency shift with THS in targets but not moist gas. The dry air background still causes a frequency shift about 119 Hz, because the relative humidity of the used dry air, 20%, causes some water molecules to be adsorbed by the sensing material.
FIG. 7.
Background frequency shift of three tested fibers (without ETS exposure) and dry air.
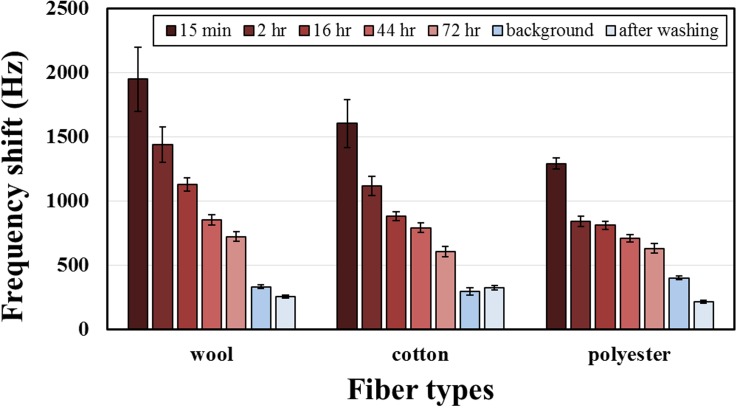
Figure 8 shows the results of detection on three clothing fibers at varied time; when the duration inside the sampling bag increased, the frequency shift clearly decreased due to some adsorbed chemicals becoming released into the air during aging, but the frequency shift of THS after 72 h was still twice the background level, showing the strong adhesion of THS on the fibers and the difficulty to remove it naturally. In the tested fibers, wool gave the largest frequency shift, polyester the smallest—the same result as for the mass gain from THS in Fig. 6, showing that the amount of THS attached has great relevance to the amount of THS volatiles.
FIG. 8.
Frequency shift of three THS exposed fibers at varied time and after laundering.
The absorbency of THS by fibers depends on the chemical and physical properties. The chemical properties include mainly the functional groups present in the material: wool can form hydrogen bonds with the nitrogen atom in nicotine and 3-EP through a carboxylic acid and an amine; cotton can bind with nicotine and 3-EP through hydroxyl groups, whereas the polyester can form only weak bonds with nicotine and 3-EP. The physical properties include mainly the appearance, surface characteristics, and pore size; a wool fiber has a cuticle shape, resulting in an increased surface area and the functional groups make it hydrophilic. A cotton fiber is hollow and short, leading to increased area to adsorb chemicals, and its functional groups make it hydrophilic; the polyester fiber is smooth, long and hydrophobic. According to these properties, the natural fibers (wool and cotton) adsorb THS chemicals more readily than synthetic fibers (polyester).
Although THS chemicals are difficult to remove by natural dissipation, laundering is a useful and simple way to eliminate chemicals. In this work, an ordinary laundry process in a washing machine was used to clean the tested fibers after ETS exposure. To avoid the influence of a detergent, the washing involved only water; the tested fibers were placed individually in laundry bags. After washing and drying (70 °C) the exposed fibers, the frequency shift of two fibers was smaller than the background; cotton was still a little greater, proving that laundry is an effective method to remove THS; results after adding detergent are expected to be superior still.
C. THS residence period of clothing fibers
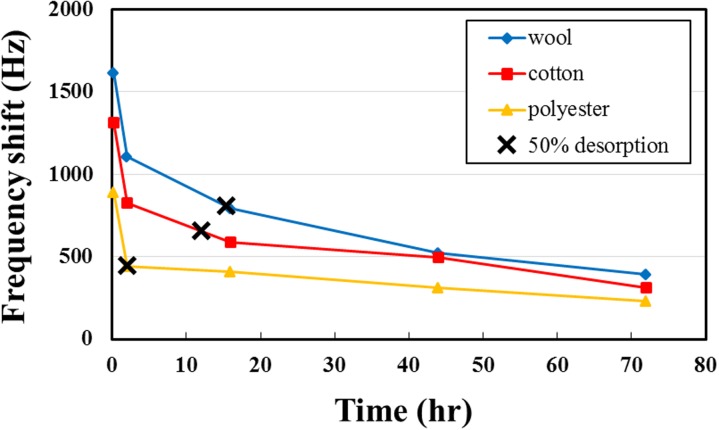
Beyond understanding the amount of THS on clothing fibers, the residence period for THS is another important issue; it shows how long the THS might influence health and living environment. In these tests, the desorption of half the THS on clothing fibers was defined as half the THS frequency shift at 15 min. Figure 9 shows the variation of frequency shift of THS with time; the period for 50% desorption for wool, cotton, and polyester is about 15, 12, and 2 h, respectively. Wool and cotton have hence not only greater THS adsorption but also a prolonged residence period, which means that, when these two natural fibers adsorb THS, it becomes released slowly to air, increasing the chance to contaminate other items and to become inhaled as toxic chemicals into the body. Because the polyester fiber is smooth and hydrophobic, the tar and smoke particles are difficult to be attached but wool fiber is cuticle shape, making the tar and smoke particles are easy to be attached and trapped. However, the SAW system is detecting the gaseous THS and the frequency shift is caused by chemicals adsorption, because the polyester has benzene ring, which can form the pi-pi interactions between nicotine and 3-EP, may be this bonding let the polyester adsorb much more chemicals than expectation and result in a big difference with mass gain.
FIG. 9.
Residence period of THS on three fibers: the wool fiber has the slowest desorption and the polyester fiber has the most rapid desorption. 50% desorption of THS on clothing fibers is defined as half the THS frequency shift at 15 min.
IV. CONCLUSION
Three tested clothing fibers—wool, cotton, and polyester—were exposed to cigarette smoke for 15 min during which THS chemicals adsorbed on the fibers then became re-emitted into the air. To determine the amount of THS on varied fibers, we used an analytical balance to measure the mass gain and a SAW sensor to detect the volatile chemical compounds. Both tests showed the same result—that the woolen fiber adsorbed the most THS because of specific functional groups and its cuticle appearance; the polyester fiber showed the least THS adsorption because of the smooth surface and hydrophobic property. The period for 50% desorption of THS on synthetic fiber polyester is much smaller than for the natural fibers, wool, and cotton. According to these results, clothing based on wool and cotton is unsuitable in a location contaminated with cigarette smoke; clothing based on polyester can adsorb fewer chemical compounds and desorb the adsorbed substances more rapidly. The SAW sensor is a suitable and powerful method to detect THS on clothing, protecting people, especially infants and children, from toxic chemicals and carcinogens in THS.
References
- 1. Eriksen M. P., LeMaistre C. A., and Newell G. R., “ Health hazards of passive smoking,” Annu. Rev. Public Health 9, 47–70 (1988). 10.1146/annurev.pu.09.050188.000403 [DOI] [PubMed] [Google Scholar]
- 2. Koszowski B., Goniewicz M. L., Czogala J., Zymelka A., and Sobczak A., “ Simultaneous determination of nicotine and 3-vinylpyridine in single cigarette tobacco smoke and in indoor air using direct extraction to solid phase,” Int. J. Environ. Anal. Chem. 89, 105–117 (2009). 10.1080/03067310802549946 [DOI] [PMC free article] [PubMed] [Google Scholar]
- 3. Pandey S. K. and Kim K.-H., “ A review of environmental tobacco smoke and its determination in air,” TrAC, Trends Anal. Chem. 29, 804–819 (2010). 10.1016/j.trac.2010.04.014 [DOI] [Google Scholar]
- 4. Quintana P. J., Matt G. E., Chatfield D., Zakarian J. M., Fortmann A. L., and Hoh E., “ Wipe sampling for nicotine as a marker of thirdhand tobacco smoke contamination on surfaces in homes, cars, and hotels,” Nicotine Tob. Res. 15, 1555–1563 (2013). 10.1093/ntr/ntt014 [DOI] [PubMed] [Google Scholar]
- 5. Chien Y. C., Chang C. P., and Liu Z. Z., “ Volatile organics off-gassed among tobacco-exposed clothing fibers,” J. Hazardous Mater. 193, 139–148 (2011). 10.1016/j.jhazmat.2011.07.042 [DOI] [PubMed] [Google Scholar]
- 6. Nilsen T. and Nilsen O. G., “ Accumulation of nicotine in human hair during long-term controlled exposure to a low concentration of nicotine vapour,” Pharmacol. Toxicol. 81, 48–52 (1997). 10.1111/j.1600-0773.1997.tb00030.x [DOI] [PubMed] [Google Scholar]
- 7. Winickoff J. P., Friebely J., Tanski S. E., Sherrod C., Matt G. E., Hovell M. F. et al. , “ Beliefs about the health effects of “thirdhand” smoke and home smoking bans,” Pediatrics 123, e74–e79 (2009). 10.1542/peds.2008-2184 [DOI] [PMC free article] [PubMed] [Google Scholar]
- 8. Matt G. E., Quintana P. J. E., Destaillats H., Gundel L. A., Sleiman M., Singer B. C. et al. , “ Thirdhand tobacco smoke: Emerging evidence and arguments for a multidisciplinary research agenda,” Environ. Health Perspect. 119, 1218–1226 (2011). 10.1289/ehp.1103500 [DOI] [PMC free article] [PubMed] [Google Scholar]
- 9. Sleiman M., Gundel L. A., Pankow J. F., Jacob P. III, Singer B. C., and Destaillats H., “ Formation of carcinogens indoors by surface-mediated reactions of nicotine with nitrous acid, leading to potential thirdhand smoke hazards,” Proc. Natl. Acad. Sci. U.S.A. 107, 6576–6581 (2010). 10.1073/pnas.0912820107 [DOI] [PMC free article] [PubMed] [Google Scholar]
- 10. Talbot L. and Palmer J., “ Effects of smoking on health and anaesthesia,” Anaesth. Intensive Care Med. 14, 107–109 (2013). 10.1016/j.mpaic.2013.01.009 [DOI] [Google Scholar]
- 11. Hang B., Sarker A. H., Havel C., Saha S., Hazra T. K., Schick S. et al. , “ Thirdhand smoke causes DNA damage in human cells,” Mutagenesis 28, 381–391 (2013). 10.1093/mutage/get013 [DOI] [PMC free article] [PubMed] [Google Scholar]
- 12. Ferrante G., Simoni M., Cibella F., Ferrara F., Liotta G., Malizia V. et al. , “ Third-hand smoke exposure and health hazards in children,” Monaldi Arch. Chest Dis. 79, 38–43 (2013). 10.4081/monaldi.2013.108 [DOI] [PubMed] [Google Scholar]
- 13. Roberts J. W., Wallace L. A., Camann D. E., Dickey P., Gilbert S. G., Lewis R. G. et al. , “ Monitoring and reducing exposure of infants to pollutants in house dust,” Rev. Environ. Contam. Toxicol. 201, 1–39 (2009). 10.1007/978-1-4419-0032-6_1 [DOI] [PubMed] [Google Scholar]
- 14. Apelberg B. J., Hepp L. M., Avila-Tang E., Gundel L., Hammond S. K., Hovell M. F. et al. , “ Environmental monitoring of secondhand smoke exposure,” Tob. Control 22, 147–155 (2013). 10.1136/tobaccocontrol-2011-050301 [DOI] [PMC free article] [PubMed] [Google Scholar]
- 15. Ku P. H., Hsiao C. Y., Chen M. J., Lin T. H., Li Y. T., Liu S. C. et al. , “ Polymer/ordered mesoporous carbon nanocomposite platelets as superior sensing materials for gas detection with surface acoustic wave devices,” Langmuir 28, 11639–11645 (2012). 10.1021/la3015892 [DOI] [PubMed] [Google Scholar]
- 16. Sayago I., Fernández M. J., Fontecha J. L., Horrillo M. C., Vera C., Obieta I. et al. , “ New sensitive layers for surface acoustic wave gas sensors based on polymer and carbon nanotube composites,” Sens. Actuators, B 175, 67–72 (2012). 10.1016/j.snb.2011.12.031 [DOI] [Google Scholar]
- 17. Grate J. W. and McGill R. A., “ Dewetting effects on polymer-coated surface acoustic wave vapor sensors,” Anal. Chem. 67, 4015–4019 (1995). 10.1021/ac00117a031 [DOI] [Google Scholar]
- 18. Bazuła P. A., Lu A.-H., Nitz J.-J., and Schüth F., “ Surface and pore structure modification of ordered mesoporous carbons via a chemical oxidation approach,” Microporous Mesoporous Mater. 108, 266–275 (2008). 10.1016/j.micromeso.2007.04.008 [DOI] [Google Scholar]


