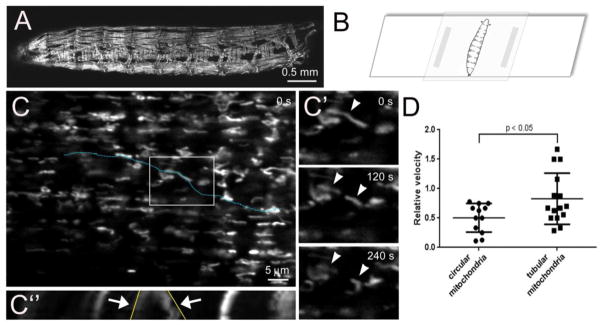
Figure 6. Live imaging of mitochondria in Drosophila larval muscles.
(A) Low magnification image of mef2-GAL4>mito-GFP larvae to visualize all muscles that express fluorescently-tagged mitochondria. (B) Larvae were immobilized in a 15–25% chloroform:water solution for 5 minutes and mounted on a glass slide for immediate imaging through the cuticle using a 63× oil lens. A Z-stack series (0.38 μm/interval) was acquired every 30 s for 4.5 minutes. Images were processed in Image J using the StackReg and PoorMan3Dreg plugins. (C) Projection of Z-stack images of dorsal oblique 4 (also called muscle 19) collected at t = 0 seconds (s). (C′) The boxed region in C at the indicated time points reveal both dynamic movement and fission events (arrowheads) of GFP-labeled mitochondria. (C″) Kymograph analysis of mitochondrial dynamics and motility along the linear ROI in C (blue dotted line). The x-axis in the kymograph illustrates the distance along the blue dotted line. Fission events are observed over time (y-axis, arrows) and shown in the XY plane in C′. The angle of the lines drawn along the contrast edge of the indicated mitochondria (yellow line) are proportional to the velocity. (F) In general, the circular mitochondria move less than tubular mitochondria in Drosophila skeletal muscle. Kymographs and relative velocities were generated using the Multiple Kymograph plugin and Velocity tsp macro in Image J. The raw data was imported into Graphpad Prism for the generation of graphs and a student-test was used for statistical analysis (mean = +/− SEM). Scale bars are indicated.

