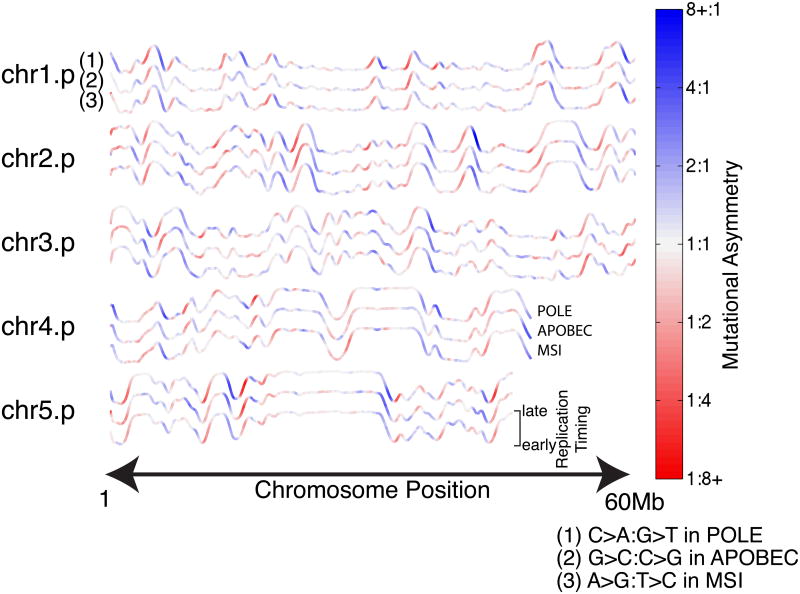
Figure 4. Replicative asymmetry is concordant across three distinct R-class mutational processes.
Color representing mutational asymmetry is overlaid on replication timing profiles as in Fig. 2. Profiles are shown in triplets colored by: (1) C→A:G→T asymmetry in 12 mutant-POLE colorectal and endometrial genomes; (2) G→C:C→G asymmetry in 22 APOBEC-enriched bladder, breast, and head-and-neck genomes; and (3) A→G:T→C asymmetry in 9 MSI-associated colon genomes.

