

Key points
Inflammatory kinins are released following spinal cord injury or neurotrauma.
The effects of these kinins on ongoing locomotor activity of central pattern generator networks are unknown.
In the present study, kinins were shown to have short‐ and long‐term effects on motor networks.
The short‐term effects included direct depolarization of interneurons and motoneurons in the ventral horn accompanied by modulation of transient receptor potential vanilloid 1‐sensitive nociceptors in the dorsal horn.
Over the long‐term, we observed a bradykinin‐mediated effect on promoting plasticity in the spinal cord.
In a model of spinal cord injury, we observed an increase in microglia numbers in both the dorsal and ventral horn and, in a microglia cell culture model, we observed bradykinin‐induced expression of glial‐derived neurotrophic factor.
Abstract
The expression and function of inflammatory mediators in the developing spinal cord remain poorly characterized. We discovered novel, short and long‐term roles for the inflammatory nonapeptide bradykinin (BK) and its receptor bradykinin receptor B2 (B2R) in the neuromodulation of developing sensorimotor networks following a spinal cord injury (SCI), suggesting that BK participates in an excitotoxic cascade. Functional expression of B2R was confirmed by a transient disruptive action of BK on fictive locomotion generated by a combination of NMDA, 5‐HT and dopamine. The role of BK in the dorsal horn nociceptive afferents was tested using spinal cord attached to one‐hind‐limb (HL) preparations. In the HL preparations, BK at a subthreshold concentration induced transient disruption of fictive locomotion only in the presence of: (1) noxious heat applied to the hind paw and (2) the heat sensing ion channel transient receptor potential vanilloid 1 (TRPV1), known to be restricted to nociceptors in the superficial dorsal horn. BK directly depolarized motoneurons and ascending interneurons in the ventrolateral funiculus. We found a key mechanism for BK in promoting long‐term plasticity within the spinal cord. Using a model of neonatal SCI and a microglial cell culture model, we examined the role of BK in inducing activation of microglia and expression of glial‐derived neurotrophic factor (GDNF). In the neonatal SCI model, we observed an increase in microglia numbers and increased GDNF expression restricted to microglia. In the microglia cell culture model, we observed a BK‐induced increased expression of GDNF via B2R, suggesting a novel mechanism for BK spinal‐mediated plasticity.
Key points
Inflammatory kinins are released following spinal cord injury or neurotrauma.
The effects of these kinins on ongoing locomotor activity of central pattern generator networks are unknown.
In the present study, kinins were shown to have short‐ and long‐term effects on motor networks.
The short‐term effects included direct depolarization of interneurons and motoneurons in the ventral horn accompanied by modulation of transient receptor potential vanilloid 1‐sensitive nociceptors in the dorsal horn.
Over the long‐term, we observed a bradykinin‐mediated effect on promoting plasticity in the spinal cord.
In a model of spinal cord injury, we observed an increase in microglia numbers in both the dorsal and ventral horn and, in a microglia cell culture model, we observed bradykinin‐induced expression of glial‐derived neurotrophic factor.
Abbreviations
- aCSF
artificial cerebrospinal fluid
- BK
bradykinin
- B1R
bradykinin receptor B1
- B2R
bradykinin receptor B2
- ChAT
choline acetyl transferase
- CPG
central pattern generator
- DA
dopamine
- DABK
des‐Arg9‐bradykinin
- ELISA
enzyme‐linked immunosorbent assay
- GDNF
glial‐derived neurotrophic factor
- HL
one‐hind‐limb
- P
postnatal day
- SCI
spinal cord injury
- TRPV1
transient receptor potential vanilloid 1
- VLF
ventrolateral funiculus
Introduction
The interaction between inflammatory mediators released following spinal cord injury (SCI) and changes in sensorimotor spinal circuits represents a complex and understudied relationship. Although previous work has focused on either nociceptive or motor networks, few studies have examined the combined effects of inflammatory mediators on both networks. Inflammatory mediators (e.g. kinins and neurotrophins) released after SCI can directly or indirectly affect spinal sensorimotor networks (Xu et al. 1991; Couture et al. 2001; Julius & Basbaum, 2001; Sugiura et al. 2002; Mandadi & Roufogalis, 2008; Mizumura et al. 2009). Bradykinin (BK) is a potent kinin that acts on the bradykinin receptor B2 (B2R) (Regoli & Barabé, 1980; Marceau et al. 1998). In the spinal cord, B2R is expressed not only in the nociceptive nerve terminals of the dorsal horn, but also in the ventral horn motoneurons (Lopes & Couture, 1997; Bouhadfane et al. 2015). Although it is unknown whether BK acts to depolarize motoneurons in an excitotoxic manner following SCI (Ferguson et al. 2008), the action of BK on B2R does directly activate dorsal horn nociceptors, leading to thermal hyperalgesia by modulation of transient receptor potential vanilloid 1 (TRPV1) channel sensitivity (DomBourian et al. 2006; Huang et al. 2006; Rajpal et al. 2007). We have demonstrated that, beginning at birth, molecularly defined nociceptive pathways projecting onto the dorsal horn can potently modulate ventral horn networks that generate locomotion, known as central pattern generators (CPGs) (Mandadi et al. 2009; 2013 a; 2013 b). However, the actions of BK on B2R and the resulting functional consequences on the sensorimotor networks involved in controlling CPGs are poorly characterized. In the present study, we provide evidence that the actions of BK on B2R can result in increased excitability of lumbar CPGs. The modulation of CPGs was not only limited to the dorsal horn nociceptors and ventral horn motoneurons, but also extended to the interneurons of the ventrolateral funiculus (VLF). Thus, BK produces a widespread depolarization of ventral horn neurons through B2R, likely contributing to excitotoxic damage of motor networks following SCI.
Apart from the acute actions of BK on B2R, there is evidence for a progressive increase in accumulation of BK following SCI, the long‐term effects of which are unclear (Xu et al. 1991). One implication could be an action of BK on B2R expressed in non‐neuronal microglia cell populations in the spinal cord. Functioning similarly to peripheral macrophage, microglia are implicated in long‐term plasticity following SCI (Coull et al. 2005; Ferrini et al. 2013). Indeed, using an experimental SCI model, we showed increased proliferation of microglia and upregulation of glial cell‐derived neurotrophic factor (GDNF), a neurotrophic factor released during nerve damage and SCI (Trupp et al. 1995). The increase in GDNF expression was restricted to microglia. A microglial cell culture model was used to demonstrate that the actions of BK resulted in the increased expression of GDNF. In summary, our work has uncovered a short‐term, multipronged action of BK via B2R on sensorimotor spinal circuits, characterized by microglial‐mediated production of GDNF. Taken together, our data suggest that this novel BK pathway serves to drive plasticity of networks within the spinal cord. Some of these data have previously been reported in abstract form (Mandadi et al., 2012, 2014).
Methods
Animals
Experiments were performed on neonatal Swiss Webster (Charles River Laboratories, Senneville, Quebec, Canada) and on transient receptor potential vanilloid 1‐null mice (trpv1 −/−; B6.129 × 1‐Trpv1tm1Jul/J; The Jackson Laboratory, Bar Harbor, Maine, USA) between postnatal (P) days 0 and 2. All protocols were approved by the Animal Care Committee at the University of Calgary and adhered to ethical guidelines published by the Canadian Council of Animal Care. Neonatal mice were anaesthetized using hypothermia and rapidly decapitated before being transferred to the dissection chamber.
Dissection of spinal cord preparations
Isolated in vitro spinal cord preparations
A ventral laminectomy was performed to expose the spinal cord, sparing as much of the cauda equina as possible, followed by cutting of the ventral and dorsal roots. The spinal cord was transected at thoracic segment 5 (T5) and gently removed from the vertebral column. The spinal cord was transferred to a recording chamber filled with carbogenated artificial cerebrospinal fluid (aCSF) (95% O2–5% CO2) and allowed to equilibrate before raising the temperature of the chamber to 27°C (Whelan et al. 2000). The preparations were continually superfused with recycled aCSF. Electrophysiological recordings included ventral root neurograms of left and right lumbar segments 2 (L2) and either left or right lumbar segment 5 (L5). Drugs were tested by bath application onto the isolated spinal cord preparation. We tested the effects of BK on modulation of locomotor networks. Fictive locomotion was induced by bath application of NMDA (5 μm), 5‐HT (10 μm) and dopamine (DA) (50 μm) to the spinal cord compartment (Whelan et al. 2000). The action of BK on B2R was investigated using HOE 140 (B2R antagonist). The effect of bradykinin receptor B1 (B1R) activation on fictive locomotion was investigated by using des‐Arg9‐bradykinin (DABK; B1R agonist).
In some experiments, the effects of drug applications (BK, HOE 140 or DA) on motoneurons were tested in the presence of blockers of fast synaptic transmission: NMDA receptor antagonist APV (100 μm), AMPA/kainate receptor antagonist CNQX (20 μm), glycine receptor antagonist strychnine (2 μm), GABAA antagonist picrotoxin (50 μm) and GABAB antagonist CGP (50 μm).
VLF preparations
We used an isolated spinal cord preparation to examine the effect of BK on populations of ventral horn interneurons. Electrophysiological recordings consisted of neurograms from interneurons that projected into the VLF. A cut was made in the VLF with microclippers, and a strip of VLF approximately half a segment in length was exposed for recording by a suction electrode (Fedirchuk et al. 1999; Han et al. 2007). The VLF neurogram recordings were performed in the presence of blockers of glutamatergic, GABAergic and glycinergic fast synaptic neurotransmission (see above).
Spinal cord injury
Spinal cord injury and sham injury were performed on the Swiss Webster (CFW) neonatal mice under isoflurane anaesthesia (Boulland et al. 2013). Anaesthesia was initiated in a closed chamber using 4% isoflurane vapourized in pure oxygen. When deeply sedated, the mouse was placed onto a thermal blanket and the snout inserted into a mask providing a continuous supply of isoflurane and oxygen. Complete analgesia was obtained by s.c. injection of 50–100 μg of the local anaesthetic lidocaine at the surgery site (thoracic level T9–12) and a subsequent reduction of the isoflurane concentration to 1–2% was allowed. After a transverse skin incision and muscle dissection, a laminectomy was performed at T9–12 using thin scissors and thin forceps. Leaving the dura intact, parts of the facet joints were removed to gain sufficient lateral space to insert the forceps (Dumont #5) and extradural spinal cord compression was performed in a modification of the procedure reported by Boulland et al. 2013). The spinal cord was compressed twice for 15 s each to achieve symmetrical compression. Sham surgeries did not involve any compression. Muscle and skin layers were then closed using Dermabond (Ethicon, Somerville, NJ, USA), applied to secure the incision. After surgery was completed, mice received an s.c. injection of 30 μl of buprenorphine (0.03 mg ml−1) once for pain relief. The mice were removed from the anaesthesia mask and placed in a temperature‐controlled isolation cage for 1 h of recovery and then returned to the dam. Dams were pre‐treated by dabbing a drop of vanilla essence on their nose to minimize pup cannibalization following surgery. The neonates were monitored for body weights as an indicator for general health, and any animals showing poor recovery were euthanized. After 2 days, acute preparations of the mice were subject to procedures described below.
Hind limb‐attached to spinal cord preparations
We used an in vitro preparation of an isolated neonatal mouse spinal cord (T5 to cauda equina) leaving one hind limb attached (hereafter termed HL preparations) (Mandadi & Whelan, 2009). We designed a special insulated chamber allowing the hind paw to remain attached to the spinal cord at the same time as receiving a separate supply of aCSF (Mandadi & Whelan, 2009). In this manner, the temperature of the hindquarter compartment could be varied without affecting the temperature of the central compartment containing the spinal cord.
We tested the effects of BK on TRPV1‐mediated modulation of locomotor networks. Fictive locomotion was induced by bath application of NMDA (5 μm), 5‐HT (10 μm) and DA (50 μm) to the spinal cord compartment (Whelan et al. 2000). At postnatal day (P)2, HL preparations were dissected to examine changes in effects of peripheral sensory stimulus of noxious heat and its effects on spinal motor networks. Dorsal horn plasticity was tested using thermal stimulation (normal physiological skin temperature ∼32–34°C; noxious heat ∼45–50°C) of the hind paw skin to modulate locomotor activity. Stimulation of cutaneous nociceptors is a useful model for studying the impact of pain via somatosensory pathways on locomotor output (Mandadi & Whelan, 2009; Mandadi et al. 2009).
Electrophysiology
Electrophysiological recordings included ventral root neurograms of L2 and L5. In isolated spinal cords without hind limbs attached, control rhythms were recorded for 10 min before the addition of pharmacological agents such as BK (0.25 μm or 25 μm), HOE 140 (1 μm) or DABK (10 μm; B1R agonist). In HL preparations, control recordings were made for 10 min with the spinal cord compartment at ∼26–27°C and the hind leg compartment at ∼32–34°C. BK (0.25 μm) was applied to the spinal cord compartment along with noxious heat (∼ 45–50°C) through the hind leg compartment. Ventral root neurograms were recorded for an additional 10 min. The hind leg compartments were returned to control temperatures of ∼32–34°C following the noxious temperature test.
Analyses of the electrophysiological data
Ventral root neurograms were amplified 1000× and low‐pass filtered at 1 kHz before being digitized (Digidata 1320; Molecular Devices, Sunnyvale, CA, USA). Digitized data were filtered (high‐pass filter: 100 Hz) using Clampfit 8.2 (Molecular Devices). Spinalcore, version 3.0 (gift from Prof. A. LevTov) was then used to filter the neurograms with a notch filter (60 Hz) and a low‐pass filter (5 Hz), rectified and reduced by a factor of 50 (Mor & Lev‐Tov, 2007). A cross‐wavelet analysis was conducted to compare the filtered neurograms of the left L2 ventral root with the right L2 and left L5 root. The resulting 10‐min spectrograms were divided into 20 bins of 30 s each to analyse rhythm parameters pertaining to frequency, coherence and power.
Power is the combined amplitude of two signals analysed at a specific frequency. Thus, a higher power indicates greater coupling between two neurograms. Coherence is a measure of the extent to which two signals are related and is defined as a value between 0 and 1, where 1 indicates stable rhythmic alternation of bursts and 0 indicates the absence of alternating signals at a specific frequency. Spectrograms were calculated to focus on the frequency of a signal from ∼0.1 to 5.0 Hz on the y‐axis in relation to time in seconds on the x‐axis. The colours in the spectrogram represent the power of a given frequency component in the raw recording. High‐power regions are arbitrarily assigned ‘warm’ colours (e.g. red through yellow range, whereas low‐power regions are assigned ‘cool’ colours (e.g. green through blue range) (Humphreys & Whelan, 2012; Nakanishi & Whelan, 2012; Sharples et al. 2015). Thus, a warmer colour on the spectrograms indicates rhythmic alternation of signal bursts.
BV2 microglia cell culture
BV2 microglia were maintained in culture with DMEM media (Gibco, Life Technologies, Carlsbad, CA, USA) containing 5% fetal bovine serum, 0.5% Penicillin‐Streptomycin at 37°C with 5% CO2. Microglia cultures were stimulated by adding BK (Sigma, St Louis, MO, USA) directly into the cell culture dishes. BK actions on B2R were investigated using HOE 140 (B2R antagonist). The effect of B1R activation on BV2 microglia was investigated by using DABK. Control groups were treated with saline. Forty‐eight hours after BK (25 μm), DABK (10 μm) or saline treatment, microglia were first washed with PBS, and then harvested in 100 μl of lysis buffer (50 mm TrisHCl, 150 mm NaCl, 10 mm EDTA, 0.1% Triton‐X, 5% glycerol, protease inhibitors, phosphatase inhibitors). Cells were incubated in the lysis buffer for 30 min on ice and the supernatant was separated by centrifugation at 13000 g for 30 min at 4°C. GDNF levels within the cell lysates were then measured using an enzyme‐linked immunosorbent assay (ELISA) (as described below).
For immunocytochemical staining, BV2 cells were cultured onto 18 mm glass coverslips and treated with either BK (25 μm) or saline. Forty‐eight hours after treatment, microglia were fixed in 4% paraformaldehyde for 15 min at room temperature, washed with PBS and then permeabilized with 0.1% Triton X‐100 for 10 min. Next, microglia were incubated in blocking solution (PBS + 10% normal donkey serum) for 1 h at 4°C, and then incubated with anti‐GDNF antibody (1:500; Alomone, Jerusalem, Israel) in 1% normal donkey serum overnight at 4°C. After overnight incubation, microglia were labelled with Cy3‐conjugated AffiniPure Donkey anti‐rabbit IgG (1:1000; Jackson Immuno Research Laboratories Inc., Westgrove, PA, USA) for 2 h at room temperature. Cells were mounted onto slides using Fluoromount mounting medium (Sigma).
ELISA
Measurement of GDNF in cell lysates was performed using a GDNF‐specific ELISA kit (detection range 15.6–1000 pg ml−1) with GDNF standards (15.6–1000 pg ml−1) and samples run in duplicate (Part# TB221; Promega, Madison WI, USA). Samples were acidified and diluted prior to ELISA to allow detection within the readable range of both free and total GDNF. An antibody‐sandwich format was used where 96‐well half‐bottom ELISA plates were coated with anti‐GDNF monoclonal antibody, which then bound soluble GDNF from samples. A second, specific polyclonal antibody bound the captured GDNF. A species‐specific secondary antibody (anti‐chicken IgY, HRP conjugate) was incubated in the wells and, finally, a chromogenic substrate was added to produce a colorimetric change proportional to the amount of GDNF. All washes were performed using TBST (20 mm Tris, 137 mN NaCl, 0.05% Tween20). Sample absorbance readings were normalized to a buffer‐only control, and the GDNF concentration was calculated using GDNF standard curve (r 2 = 0.9978).
Immunohistochemistry
Double immunostaining for kinin receptors: B2R and peripherin; B2R and choline acetyl transferase (ChAT)
Neonatal mice were anaesthetized and perfused by way of the descending aorta with 0.1 m PBS followed by fixative (4% formaldehyde, 0.1 m PBS, pH 7.3, at 4°C). Spinal cords were dissected out of the animals and post‐fixed for 2 h at 4°C in the same fixative. All tissues were cryoprotected in 20% sucrose at 4°C overnight, embedded in Tissue‐Tek® optimum cutting temperature (OCT) compound (VWR; Radnor, PA, USA) and flash frozen in isopropyl alcohol kept on dry ice. Using a cryostat (CM 1850 UV; Leica Microsystems, Wetzlar, Germany), 20 μm spinal cord frozen sections were sliced and mounted onto Superfrost Plus slides (VWR International Ltd, Lutterworth, UK). The sections were washed three times with 0.1 m PBS plus 0.1% Triton X‐100 (PBS+TX) and blocked with 10% goat serum in PBS+TX for 30 min. Subsequently, the sections were incubated with primary antibodies diluted in 10% goat serum in PBS+TX. The sections were probed with the goat polyclonal anti‐B2R (C‐20, dilution: 1:100, sc‐15050; Santa Cruz Biotechnology Inc., Santa Cruz, CA, USA) at 4°C for 48 h. For experiments involving double immunostaining for kinin receptors and peripherin, the sections were incubated for 48 h with the primary antibodies for kinin receptors (anti‐B2R), then incubated for an additional 24 h with a combination of the anti‐B2R antibodies and chicken polyclonal anti‐peripherin (ab39374; Abcam, Cambridge, MA, USA). For experiments involving double immunostaining for kinin receptors and ChAT, the sections were incubated for 48 h with the primary antibodies for kinin receptors, then incubated for an additional 24 h with a combination of the anti‐B2R antibodies and chicken polyclonal anti‐ChAT (AB15468; Millipore, Temecula, CA, USA). Following primary antibody incubations, the sections were washed three times with PBS+TX and then incubated with the appropriate secondary antibody for 2 h at room temperature. The secondary antibodies used were Alexa Fluor 488 donkey anti‐goat IgG (dilution: 1:1000; Invitrogen, Eugene, OR, USA) and DyLightTM594‐conjugated AffiniPure Donkey Anti‐ChickenIgY++ (IgG) (dilution: 1:1000; 703‐515‐155; Jackson Immuno Research Laboratories Inc.). Following a second set of three washes, the sections were cover‐slipped with Fluoromount (Diagnostic Biosystems, Pleasanton, CA, USA). The primary antibodies were characterized by their specificity to detect the protein of interest using their respective blocking peptides. For all experiments, primary antibodies were excluded from one slide that served as a negative control.
Post hoc immunohistochemistry on sham or injured spinal cords
Spinal cords from animals that underwent sham surgery or spinal cord compression injury were isolated and subjected to immunohistochemistry protocols as described above. The spinal cord sections were probed with primary antibodies for kinin receptor B2R, GDNF, glial fibrillary acidic protein and Iba1 or CD11b. The secondary antibodies used were Alexa Fluor 488 donkey anti‐goat IgG (dilution: 1:1000; Invitrogen) and DyLightTM594‐conjugated AffiniPure Donkey Anti‐ChickenIgY++ (IgG) (dilution: 1:1000; 703‐515‐155; Jackson Immuno Research Laboratories Inc.).
Post hoc histology on sham or injured spinal cords
Using animals that underwent compressional SCI, serial transverse frozen sections of the spinal cords 1 mm rostral to 1 mm caudal of the injury site were sliced at 20 μm using a cryostat (CM 1850 UV; Leica Microsystems) and mounted onto Superfrost Plus (VWR International) slides. Cresyl violet counterstain was prepared fresh by thoroughly mixing 1.25 g of cresyl violet acetate (Sigma) with 250 ml of warmed distilled H2O and 0.75 ml of acetic acid (glacial; Fisher Scientific, Pittsburgh, PA, USA). The solution was then cooled and filtered to remove crystals. Slides were warmed on a warm plate at 37°C for 30 min followed by three consecutive sets of 10 min 0.1 m PBS washes. Slides were then transferred into the fresh cresyl violet solution for a maximum of 30 s and immediately washed for 2 min in distilled H2O, then three times in 0.1 m PBS for 2 min. Sections were then dehydrated using an ascending ethanol row at concentrations of 50%, 75% and 100% for 2 min each, air‐dried and cover slipped using Permount (Fisher Scientific). Sections were imaged using the 20× objective with an upright brightfield microscope (BX51; Olympus, Richmond Hill, ON, Canada).
Retrograde labelling of motoneurons and immunostaining with anti‐peripherin antibody
We used a combination of dye tracing and immunohistochemistry to confirm the identity of motoneurons labelled by anti‐peripherin antibody. For dye tracing, the spinal cords were isolated, pinned down on a silicone surface in a dissecting dish and superfused with carbogenated aCSF (17°C). The cut L5 ventral root was drawn into a suction pipette filled with fluorescein‐labelled dextran, MW 3000 (Invitrogen). After 12 h, the spinal cords were fixed in 4% paraformaldehyde in 0.1 m PBS (pH 7.4) for 2 h, followed by cryoprotection in 20% sucrose, 0.1 m PBS at 4°C overnight, and quick‐frozen in clear OCT. Using a cryostat (CM 1850 UV; Leica Microsystems), 20 μm spinal cord frozen sections were sliced and mounted onto Superfrost Plus slides. The sections were washed three times with 0.1 m PBS plus 0.1% Triton X‐100 (PBS+TX) and blocked with 10% donkey serum in PBS+TX for 30 min. The sections were incubated with primary antibody chicken anti‐peripherin diluted (1:100) in 10% donkey serum in PBS+TX at 4°C overnight. They were washed three times with PBS+TX, then incubated with the secondary antibody DayLightTM594‐conjugated AffiniPure Donkey Anti‐ChickenIgY++ (IgG) (dilution: 1:1000) for 2 h at room temperature. Another set of three washes with PBS+TX was conducted after which the sections were mounted and cover‐slipped with Fluoromount (Diagnostic Biosystems, Pleasanton, CA, USA). All washes in the immunohistochemistry protocols were 10 min in duration.
Fluorescence image acquisition
We acquired digital images using an AxioImager microscope with Colibri LED illumination (excitation wavelength: 558 nm, emission: 585 nm; Carl Zeiss, Toronto, Ontario, Canada). Z‐stacks consisting of optical slices at 1.0 μm spacing were recorded with a 20× Plan Apochromat objective (NA 0.5) or at 0.5 μm spacing with a 40× Plan Apochromat objective (NA 0.75). Digital images were acquired and processed using Axiovision software (Carl Zeiss); original images were not modified. We also made use of an Eclipse Ti C1SI spectral confocal microscope (Nikon, Chiyoda, Tokyo, Japan) equipped with lasers 405, 488, 561, 638 nm and an emission bandwidth spanning 400–750 nm. Z‐stacks consisting of optical slices at 0.75 μm spacing were recorded with a 40× Plan Fluor oil immersion objective (NA 1.30) or at 0.5 μm spacing with a 60× Plan Apochromat water immersion objective (NA 1.20) Digital images were acquired using E2‐C1 software and converted using Nis Elements imaging software (Nikon).
Calcium imaging experiments and data analysis
Dye loading of interneurons projecting into VLF
In three experiments, cell bodies of ventral horn interneurons in the L2 segment projecting into VLF were retrogradely loaded with calcium green 1 dextran dye (3000 MW) using established techniques (O'Donovan et al. 1993; Bonnot et al. 2002a, b; Mandadi et al. 2013 b). A suction electrode (PE 90) was positioned ventromedially, and a small section of white matter rostral to L2 segment was drawn up into the electrode. It was backfilled with dye (10 mm) dissolved in 0.2% Triton X‐100 (6 μl) and left attached to the spinal cord for 12–14 h in oxygenated aCSF at 17°C, allowing for retrograde loading of cell bodies of VLF interneurons. Following the 12–14 h of labelling, the spinal cord was allowed to acclimatize to room temperature to allow imaging to take place.
Optical imaging
The spinal cord was transversely sliced at L2 using a vibratome (VT1000; Leica Microsystems) following the labelling process. The sliced spinal cord, with intact segments between sacral segment 4 (S4) and lumbar segment L2, was pinned upright on a silicone elastomer wedge (Sylgard, Dow Corning, Midland, MI, USA) and placed in a chamber with the lumbar surface facing downward. The chamber was viewed with an inverted epifluorescence microscope (IX71; Olympus Canada, Richmond Hill, Ontario, Canada) and continuously superfused with aCSF. The tissue was illuminated with a 75 W xenon light source (excitation filter, 470–490 nm; emission filter, 520–560 nm) to visualize labelled pre‐motor interneurons in the transverse plane of the L2 ventral horn of the spinal cord.
Data analysis
Activity‐dependent changes in fluorescence were detected using an intensified CCD camera (Stanford Photonics, Salt Lake City, UT, USA) digitized on a Dazzle (A/D converter; Corel Corp., Ottawa, Canada) and stored electronically using Adobe Premiere (Adobe Systems Inc., San Jose, CA, USA). Changes in fluorescence were monitored on‐line using an image‐processing unit (Hamamatsu Photonics, Hamamatsu City, Japan), at the same time as the software analysed the data (Metamorph; Universal Imaging, West Chester, PA). In brief, regions of interest were placed around ventrally labelled interneurons where changes in average pixel intensity were quantified before and during an episode of activity by dividing the change in fluorescence by the background (%ΔF/F). The measured data were smoothed using a Savitzky‐Golay digital filter (MatLab; MathWorks Inc., Natick, MA, USA). To derive the optical fluorescence images, we used Metamorph imaging software (Molecular Devices). The final averaged fluorescence was displayed as a pseudocoloured image where the look‐up table was stretched (from 0–255 to 0–17) to maximize contrast.
Statistical analysis
All data are reported as the mean ± SD. Non‐parametric t tests or one‐way ANOVAs were used to determine statistical significance using Dunnett's post hoc test for multiple comparisons. P < 0.05 was considered statistically significant. The frequency, power and coherence values were normalized and analysed with a repeated measures two‐way ANOVA and a Bonferonni post test. Prism, version 5.0 (GraphPad Software Inc., San Diego, CA, USA) or SigmaPlot, version 13 (Systat Software Inc., Chicago, IL, USA) was used to run statistical tests.
Results
B2R was expressed in both the dorsal and ventral horn neurons of the spinal cords isolated from neonatal mice
In naïve neonatal mice (P0–P2), B2R expression was observed in both the dorsal and ventral horns, most intensely in the superficial region of the dorsal horn (Fig. 1 Ai) and in the motoneurons within the ventral horn (Fig. 1 Aiv). B2R expression in the dorsal horn co‐localized with peripherin (Fig. 1 Aii and iii), a marker for the unmyelinated nociceptive afferents. Peripherin also co‐localized with B2R expression in ventral horn neurons (Fig. 1 Av and vi). The peripherin‐positive ventral horn neurons co‐localized with the tracer dye fluorescein that retrogradely labelled motoneurons (Fig. 1 B). These results show that the neuronal expression of B2R is localized not only in the primary afferents projecting into the superficial dorsal horn, but also in the ventral horn motoneurons.
Figure 1. Expression of B2R in spinal cord sections from naïve wild‐type (WT) neonatal mice .
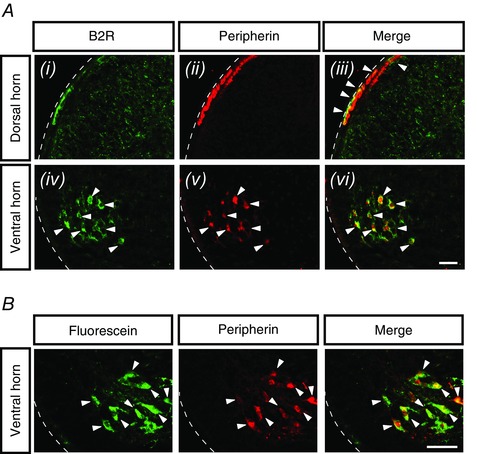
A, representative images of spinal cord sections from WT mice showing B2R expression (green channel) in the dorsal horn (Ai) and ventral horn (Aiv); peripherin labelling (red channel) in the dorsal horn (Aii) and ventral horn (Av); merged images of B2R and peripherin in the dorsal horn (Aiii) and ventral horn (Avi). Arrowheads indicate regions where B2R co‐localized with peripherin in the dorsal horn (Aiii) along with ventral horn neurons (Aiv–vi). The dotted white lines mark the outer edges of the spinal cord in transverse sections. All images are at 20× with the scale bar representing 50 μm (n = 6). B, representative images of spinal cord sections from WT mice show retrograde labelling of motoneurons with fluorescein (top, green channel), peripherin labelling of motoneurons (middle, red channel) and merged image showing co‐localization of fluorescein and peripherin in the motoneurons (bottom, co‐localization indicated by arrow heads). Images are at 40× with the scale bar representing 50 μm (n = 2).
Activation of B2R by BK in the neonatal spinal cord disrupted the sensorimotor function of fictive locomotion
Because we observed that B2R was expressed in ventral horn neurons that may form part of locomotor networks, as well as dorsal horn neurons, we next investigated the hypothesis that the B2R agonist BK could modulate CPG function. A fictive locomotor rhythm was generated by applying a combination of NMDA (5 μm), DA (50 μm) and 5‐HT (10 μm) in en bloc spinal cord preparations isolated from naïve P0–P2 mice. The locomotor rhythm data include neurogram recordings from the left and right L2 ventral roots (flexors) and the left L5 ventral root (extensors) (Fig. 2 A). We investigated kinin‐induced modulation by bath‐applying BK (0.25 μm or 25 μm) once a stable control rhythm was obtained. In this way, a disruption of the locomotor network was indicated by a significant reduction in power.
Figure 2. Modulation of fictive locomotor rhythm by BK .
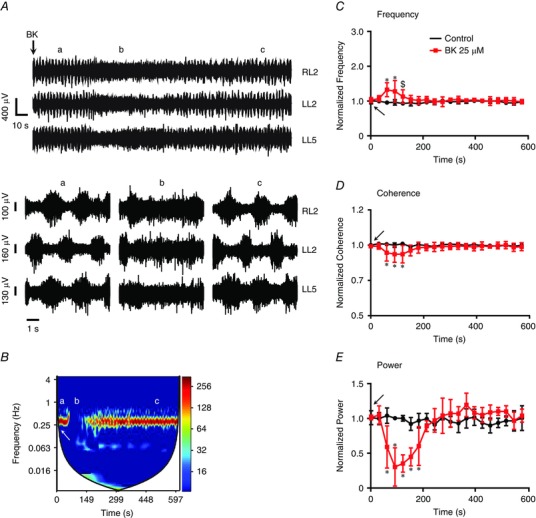
A, representative neurograms (10 s and 1 s time scale) from RL2, LL2 and LL5 ventral roots before ‘a’, during ‘b’ and after ‘c’ application of 25 μm BK. In both time scales, the rhythmic neurograms were transiently disrupted by BK, which returned to normal rhythmic patterns. Representative cross‐wavelet spectrograms of L2 neurogram recordings during rhythmic activity from the spinal cord of wild‐type (WT) (B) mice. The cross‐wavelet spectra are shown in the left‐hand y‐axis as the frequency (Hz), whereas the right‐hand y‐axis is power in a colour‐coded logarithmic scale and the x‐axis is time (s). Application of 25 μm BK (white arrow) resulted in a transient disruption ‘b’ of the fictive locomotor rhythm as seen in the spectrograms. Graphs illustrate the parameters of the fictive locomotor rhythm expressed as 10‐min traces of normalized frequency (C), normalized coherence (D) and normalized power (E) under control (black) and BK (red) conditions. There was a transient and significant increase in the frequency, and a decrease in coherence and power of the locomotor rhythm, following bath application of 25 μm BK (black arrows). Repeated measures ANOVA, *P < 0.05; n = 7. Error bars indicate the SD.
BK at 0.25 μm did not alter the fictive locomotor rhythm (Table 1). In a separate set of experiments in which a higher dose of 25 μm BK was applied first, we observed a significant increase in burst frequency of the locomotor rhythm (Fig. 2 B–C and Table 1). The increase in frequency was followed by a disruption of locomotor network function, as indicated by a significant decrease in rhythm coherence and the power of the rhythm (Fig. 2 D and E and Table 1). The changes to the locomotor rhythm induced by 25 μm BK were transient (Fig. 2 A–E) and a subsequent application of 25 μm BK induced no further response (data not shown). The effect of BK on the locomotor rhythm was investigated using HOE 140 (a B2R antagonist) to test whether the effects were mediated by B2R. Our data showed that the effects of BK were blocked in the presence of HOE 140, which prevented any transient effects on frequency, power or coherence (P > 0.1) (Fig. 3). To rule out any effects of B1R, we directly tested the effects of the B1R agonist DABK. We did not observe any significant change in rhythm parameters following bath application of DABK to a preexisting locomotor rhythm (P > 0.1; data not shown). This observation is consistent with immunocytochemical data indicating that B1R is not present in the dorsal or ventral horn of naïve neonatal spinal cord preparations (P. J. Whelan, unpublished observations).
Table 1.
Comparison of the normalized values of the fictive locomotor rhythm parameters (frequency, coherence and power) between wild‐type (WT) and trpv1−/− neonatal mouse spinal cord preparations bath applied with BK
| WT | trpv1−/− | |||||||||||
|---|---|---|---|---|---|---|---|---|---|---|---|---|
| RL2 vs. LL2 | LL2 vs. LL5 | RL2 vs. LL2 | LL2 vs. LL5 | |||||||||
| Norm. freq. | Norm. coh. | Norm. pwr. | Norm. freq. | Norm. coh. | Norm. pwr. | Norm. freq. | Norm. coh. | Norm. pwr. | Norm. freq. | Norm. coh. | Norm. pwr. | |
| Naïve SC; 0.25 μm BK (n = 7) | 1.06 ± 0.03 | 0.99 ± 0.03 | 0.96 ± 0.08 | 1.04 ± 0.32 | 0.99 ± 0.03 | 0.96 ± 0.11 | 1.02 ± 0.16 | 0.97 ± 0.05 | 0.96 ± 0.16 | 1.06 ± 0.03 | 0.98 ± 0.03 | 0.96 ± 0.11 |
| Naïve SC; 25 μm BK (n = 7) | 1.38 ± 0.40 | 0.93 ± 0.03 | 0.39 ± 0.66 | 1.36 ± 0.16 | 0.91 ± 0.03 | 0.44 ± 0.26 | 1.31 ± 0.05 | 0.92 ± 0.03 | 0.45 ± 0.26 | 1.36 ± 0.24 | 0.93 ± 0.03 | 0.62 ± 0.03 |
SC, isolated spinal cord; Norm. freq., normalized frequency; Norm. coh., normalized coherence; Norm. pwr., normalized power; RL2, right lumbar segment 2; LL2, left lumbar segment 2; LL5(left lumbar segment 5. Values shown in bold: P > 0.05. Values shown in italic: P < 0.05.
Figure 3. Inhibition of BK‐induced modulation of fictive locomotor rhythm in the presence of the B2R antagonist HOE 140 .
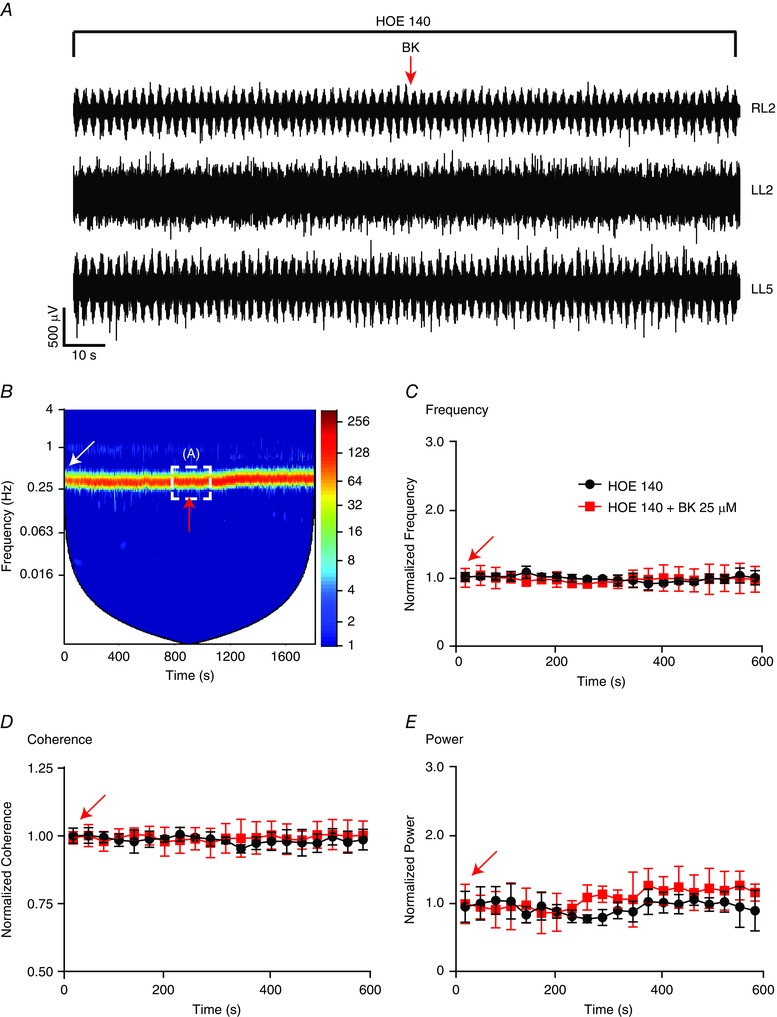
A, representative neurograms from RL2, LL2 and LL5 ventral roots following application of 25 μm BK (indicated by red arrow) in the presence of HOE 140 1 μm). B, representative cross‐wavelet spectrogram of L2 neurogram recordings during rhythmic activity from the spinal cord of wild‐type (WT) mice during HOE 140 application (indicated by white arrow). The cross‐wavelet spectra are shown in the left‐hand y‐axis as the frequency (Hz), whereas the right‐hand y‐axis is power in a colour‐coded logarithmic scale and the x‐axis is time (s). A and B, in the presence of HOE 140 (1 μm), an application of 25 μm BK (indicated by red arrow) resulted in no change to the fictive locomotor rhythm. The dotted white line boxed area in the spectrogram in (B) corresponds to the raw trace represented in (A). Graphs illustrate the parameters of the fictive locomotor rhythm expressed as 10‐min traces of normalized frequency (C), normalized coherence (D) and normalized power (E) under HOE 140 (black) and BK+ HOE 140 (red) conditions. There was no significant change to any of the three rhythm parameters (P > 0.1; repeated measures ANOVA) n = 5. Error bars indicate the SD.
The functional effects of BK on the locomotor pattern could arise from action on neuronal B2R at both the dorsal horn and ventral horn levels.
BK action on B2R in the dorsal horn nociceptors sensitized TRPV1‐dependent sensory input of noxious heat
We next investigated the action of BK on B2R in either the dorsal horn nociceptors or ventral horn motoneurons individually. To test the effects of BK on B2R in the dorsal horn nociceptors, we used HL preparations. These preparations allowed us to apply the peripheral afferent input of noxious heat. Under control conditions, a stable fictive locomotor rhythm was generated by applying a combination of NMDA (5 μm), DA (50 μm) and 5‐HT (10 μm) to the spinal cord compartment, at the same time as the hind paw compartment was maintained at a normal skin temperature of ∼32–34°C. The hind paw was subjected to a noxious heat stimulus (∼45–50°C) followed by application of 0.25 μm BK (Fig. 4 G). In the HL preparations from wild‐type mice, application of 0.25 μm BK in the spinal cord compartment in conjunction with noxious heat stimulus to the hind paw resulted in a significant increase in the burst frequency (P < 0.05) (Fig. 4 A and B and Table 2). The increase in frequency was followed by a disruption of the rhythm that was measured as a significant decrease in coherence (P < 0.05) (Table 2) and power (P < 0.05) (Fig. 4 C and Table 2). The changes to the locomotor rhythm induced by 0.25 μm BK in conjunction with noxious heat were transient, after which the locomotor rhythm returned to control levels (Fig. 4 A–C).
Figure 4. BK induces transient disruption of the fictive locomotor rhythm in the presence of noxious heat in the spinal cords isolated from wild‐type (WT) but not from trpv1−/− neonatal mice .
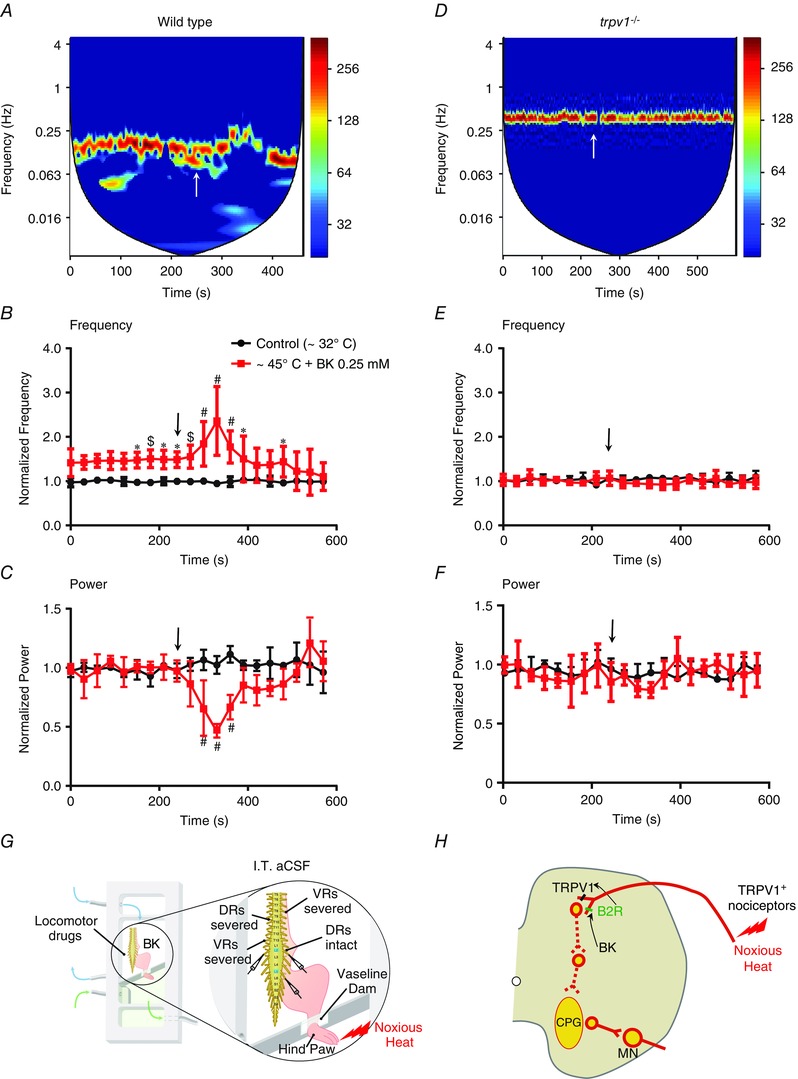
Representative cross‐wavelet spectrograms of segmental L2 neurograms during ventral root‐evoked rhythmic activity obtained from the spinal cords of WT (A) or trpv1−/− (D) mice. The cross‐wavelet spectra left‐hand y‐axis represents the frequency (Hz), the right‐hand y‐axis is power in a colour‐coded logarithmic scale and the x‐axis is time (s). Application of 0.25 μm BK (white arrow) in the presence of noxious heat (∼45–50°C) resulted in a transient disruption of the fictive locomotor rhythm as seen in the spectrograms of WT mice (A) but not trpv1−/− mice (D). Graphs show parameters of fictive locomotor rhythm as 10‐min traces of normalized frequency in WT (B) or trpv1−/− mice (E), and normalized power in WT (C) or trpv1−/− mice (F) under control (black) and BK (red) conditions. In preparations from WT mice during the application of noxious heat alone, note the significant increase in the frequency (B) but no significant change in the power (C) of the locomotor rhythm. However, bath application of 0.25 μm BK (Black arrows) during the noxious heat application induced a further increase in frequency (B) followed by a disruption of the locomotor rhythm measured as a decrease in power (C). The changes to the fictive locomotor rhythm parameters as a result of a combination of heat and BK were transient (repeated measures ANOVA, *P < 0.05, $P < 0.01, #P < 0.001; n = 6). Error bars indicate the SD. In preparations from trpv1−/‐ mice, application of noxious heat alone or a combination of noxious heat and 0.25 μm BK did not lead to significant changes in the frequency (E) or power (F) of the fictive locomotor rhythm (repeated measures ANOVA; n = 6). Error bars indicate the SD. G, schematic illustrating the HL preparation used to obtain data presented in (A) to (F). The preparations were isolated at P2 following intrathecal aCSF (I.T. aCSF) treatment. The dorsal roots (DRs) on the side ipsilateral to noxious heat application to the caudal hind paw compartment were intact (DRs intact), whereas the DRs on the contralateral side were severed (DRs severed). The ventral roots (VRs) on both sides were severed (VRs severed). Neurograms were recorded from the ventral roots of lumbar segments L2 and L5 ipsilateral to the hind paw and the L2 ventral root contralateral to the hind paw. The rostral spinal cord compartment was exposed to locomotor drugs and BK. The rostral and caudal compartments were separated by a petroleum jelly dam. H, schematic showing the sensorimotor networks of the neonatal spinal cord and the mechanism of action whereby the BK‐induced effects on B2R enhances noxious heat activation of TRPV1+ nociceptors followed by a downstream disruption of locomotor networks.
Table 2.
Comparison of the normalized values of the fictive locomotor rhythm parameters (frequency, coherence and power) between wild‐type (WT) and trpv1−/− neonatal HL preparations for which the spinal cords were treated with BK and the hind paw was stimulated with noxious heat
| WT | trpv1−/− | |||||||||||
|---|---|---|---|---|---|---|---|---|---|---|---|---|
| RL2 vs. LL2 | LL2 vs. LL5 | RL2 vs. LL2 | LL2 vs. LL5 | |||||||||
| Norm. freq. | Norm. coh. | Norm. pwr. | Norm. freq. | Norm. coh. | Norm. pwr. | Norm. freq. | Norm. coh. | Norm. pwr. | Norm. freq. | Norm. coh. | Norm. pwr. | |
| HL; Heat (n = 6) | 1.54 ± 0.21 | 0.97 ± 0.05 | 0.92 ± 0.29 | 1.51 ± 0.24 | 0.98 ± 0.03 | 0.91 ± 0.29 | 0.98 ± 0.34 | 0.98 ± 0.11 | 0.87 ± 0.32 | 1.05 ± 0.34 | 1.00 ± 0.16 | 0.90 ± 0.34 |
| HL; Heat + 0.25 μm BK (n= 6) | 2.51 ± 0.69 | 0.91 ± 0.05 | 0.45 ± 0.08 | 2.29 ± 0.32 | 0.92 ± 0.03 | 0.55 ± 0.37 | 0.97 ± 0.29 | 0.99 ± 0.16 | 0.92 ± 0.16 | 1.03 ± 0.24 | 1.03 ± 0.11 | 0.90 ± 0.29 |
HL, hind limb attached to the spinal cord; Norm. freq., normalized frequency; Norm. coh., normalized coherence; Norm. pwr., normalized power; RL2, right lumbar segment 2; LL2, left lumbar segment 2; LL5, left lumbar segment 5). Values shown in bold: P > 0.05. Values shown in italic: P < 0.05.
Our previous work has demonstrated that noxious heat (>42°C) applied to the paw increased locomotor frequency without a significant reduction in the regularity of the locomotor rhythm (Mandadi & Whelan, 2009). In the present study, however, low concentrations of BK in combination with noxious heat increased the frequency of the rhythm and also disrupted the rhythm by significantly decreasing coherence and power (Table 2).
Using the HL preparation, we previously demonstrated that peripheral application of capsaicin leads to a TRPV1‐mediated increase in excitability of locomotor networks. We also demonstrated that TRPV1 in the neonatal mouse spinal cord is restricted to the superficial dorsal horn (Mandadi et al., 2009, 2013 b). We therefore investigated whether the low dose BK induced sensitization of the dorsal horn is dependent on TRPV1 expressing afferents. The HL preparations from trpv1−/− mice showed not only inhibition of the effects of noxious heat on locomotor frequency and stability (Fig. 4 D–F and Table 2), but also inhibition of the sensitization to noxious heat induced by BK (Fig. 4 D–F and Table 2). These findings suggest that the actions of BK on B2R sensitize TRPV1 at the dorsal horn and disrupt downstream locomotor network function in the ventral horn (Fig. 4 H).
In a separate set of control experiments, we confirmed the expression of B2R in the dorsal and ventral horn of the spinal cords isolated from trpv1−/− mice (data not shown). We also confirmed that BK induced a disruption of locomotor rhythm similar to that observed in the spinal cords from wild‐type mice (Table 1).
BK depolarized the motoneurons via B2R activation in the ventral horn of the neonatal spinal cord
The effects of BK on B2R in the motoneurons were investigated by using isolated spinal cord preparations from naïve mice. The motoneurons were synaptically‐isolated from premotor interneurons by applying glutamatergic, GABAergic and glycinergic blockers to block fast neurotransmission (see Materials and methods). An application of 25 μm BK, a B2R agonist, induced a strong depolarization of the motoneurons in both the L2 and L5 segments (867.67 ± 272.47 μV; n = 3) (Fig. 5 A and B). We next applied 50 μm DA, resulting in strong depolarization of the motoneurons (Han et al. 2007) (1030.83 ± 722.59 μV; n = 3) (Fig. 5 A and B;). B2R antagonist HOE 140 (1 μm) completely inhibited the depolarization of motoneurons by 25 μm BK but not by 50 μm DA (Fig. 5 B). These results provide evidence for the functional expression of B2R in motoneurons (Fig. 1 iv–vi). Colocalization of B2R expression with the motoneuron marker, ChAT, further supports motoneuron expression of functional B2R (Fig. 5 C).
Figure 5. Motoneurons express functional B2R in the spinal cord isolated from naïve wild‐type (WT) neonatal mice .
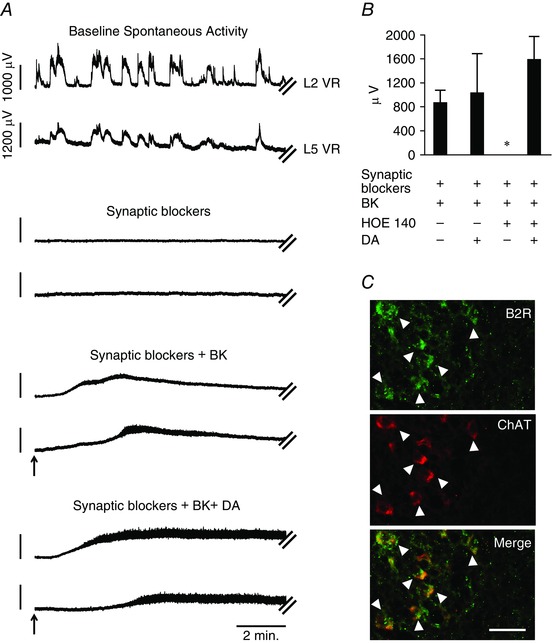
A, representative segmental L2 and L5 ventral root neurogram recordings during spontaneous activity obtained from the spinal cords of WT mice (top panel). An application of blockers of all fast synaptic neurotransmission inhibits all spontaneous activity (second panel). In the presence of blockers of fast synaptic neurotransmission, any depolarization measured from the L2 and L5 ventral roots represents activation of motoneuron pools of the L2 and L5 segments. Application of 25 μm BK (arrow) evoked strong depolarizations from the synaptically isolated motoneurons measured from the L2 and L5 neurograms (third panel). Application of 50 μm DA (arrow) evoked a further depolarization of the DC potential recorded from the L2 and L5 neurograms (bottom panel; n = 3). B, summarized responses of BK or DA induced responses in motoneurons from both L2 and L5 segments in the presence of blockers of fast synaptic neurotransmission. Response to BK was inhibited completely in the presence of the B2R antagonist HOE 140 at 1 μm. Error bars indicate the SD. C, representative images of spinal cord sections show B2R expression in ventral horn neurons (top) and ChAT positive motoneurons (middle), and a merged image shows colocalization between B2R and ChAT (bottom, co‐localization indicated by arrowheads). Images are at 40× with the scale bar representing 50 μm (n = 3).
BK depolarized the interneurons of the VLF
Following confirmation of BK actions on neuronal B2R, we next investigated the possibility of expression of functional B2R in the interneurons of VLF that provide a measure of CPG activity within the ventral horn. We measured BK‐mediated activation of VLF interneurons by recording neurograms and calcium transients. The responses from the VLF interneurons were obtained in the presence of the blockers of glutamatergic, GABA‐ergic and glycinergic neurotransmission (see Materials and methods). Using calcium imaging, we observed that an application of 25 μm BK, a B2R agonist, induced an increase in intracellular calcium transients in interneurons retrogradely labelled with calcium dye via the interneuronal projections in the VLF (% ΔF/F0 = 2.69 ± 0.27; n = 6 cells from n = 3 spinal cord preparations) (Fig. 6 A). Electrophysiological experiments confirmed the calcium imaging results of B2R expression in VLF projecting interneurons. An application of 25 μm BK induced a strong depolarization of the interneurons in the VLF (315.40 ± 280.89 μV; n = 3) (Fig. 6 B). A subsequent application of 50 μm DA also induced a strong depolarization of the interneurons (366.90 ± 252.26 μV; n = 3) (Fig. 6 B), suggesting that the preparations remained viable and responsive to subsequent activation. The prolonged increases in intracellular calcium are consistent with sustained calcium signalling following BK in isolated DRG cultured neurons (Thayer et al. 1988 a). These results support our hypothesis that ventral horn interneurons with projections into the VLF express functional B2R. The most parsimonious explanation of our findings is that the release of BK depolarizes ventral horn interneurons and motoneurons, and disrupts motor networks, which in turn, directly affect network interneurons.
Figure 6. Interneurons projecting into the VLF express functional B2R in the spinal cord isolated from naïve wild‐type (WT) neonatal mice .
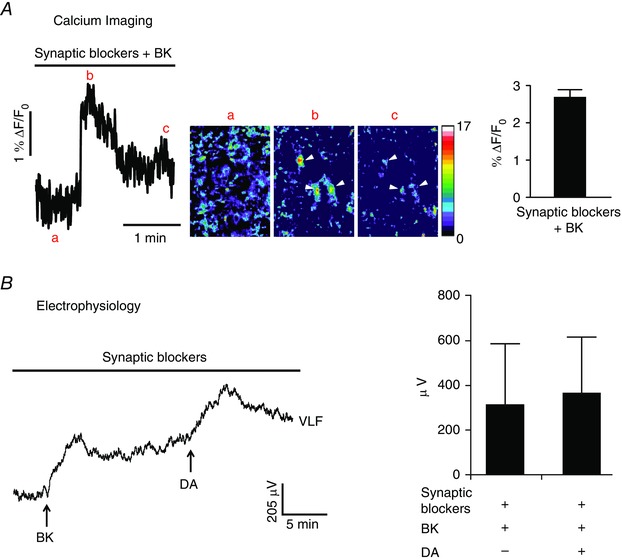
A, representative calcium imaging trace (left) showing that, in the presence of blockers of fast synaptic neurotransmission, there was an increase in calcium transients from ‘a’ to ‘b’ in response to an application of 25 μm BK followed by desensitization of the BK response to ‘c’. Pseudocolour images of the traces at positions ‘a’, ‘b’ and ‘c’ ( ‘a’ shows baseline image; ‘b’ shows interneurons responding to BK indicated by arrowheads; ‘c’ shows desensitization of the BK response in the interneurons indicated by the arrowheads; a pseudocolour scale is shown to the right in ‘c’). The graph summarizes BK‐induced calcium responses from the VLF interneurons at L2 segment (right; calcium responses presented as %ΔF/F; n = 6 interneurons). Error bars indicate the SD. B, representative neurogram recordings from the VLF rostral to the L2 segment of the spinal cords of WT mice (left). In the presence of blockers of fast synaptic neurotransmission, any depolarization measured from the VLF is indicative of activation of interneurons projecting into the VLF rostral to the L2 segment. Application of 25 μm BK (arrow) evoked depolarization of synaptically isolated VLF interneurons (left). Subsequent application of 50 μm DA (arrow) induced further depolarization of the synaptically isolated VLF interneurons (left). Graph shows the summarized VLF responses induced by 25 μm BK or 50 μm DA in the presence of blockers of all fast synaptic neurotransmission (right; n = 3).
Spinal cord injury induced microglial proliferation may lead to increased microglial GDNF expression mediated by BK action on B2R
So far, we have examined BK effects on motor networks during the acute phase. We next investigated the mechanisms underlying BK effects over a longer‐time frame. To examine long‐term effects of BK activity following SCI, we first tested the effects of neonatal SCI on microglia proliferation because of their key role in dorsal horn plasticity following nerve and spinal cord injury (Coull et al. 2005; Ferrini et al. 2013). We identified microglia by immunofluorescence labelling of the ionized calcium‐binding adapter molecule (Iba1). We found that, 48 h following spinal cord injury (Fig. 7 A), the neonatal spinal cord showed a significant increase in the number of Iba‐1 positive cells, suggesting a proliferation of microglia in both the dorsal and ventral horn (Fig. 7 B). There was also a significant increase in the GDNF expression in the dorsal horn (Fig. 7 A) of the spinal cord but not in the ventral horn (data not shown). We determined that GDNF is co‐localized with CD11b‐positive microglia but not with glial fibrillary acidic protein‐positive astrocytes (Fig. 8). Taken together, these findings suggest that SCI induces a robust microglial response that occurs concomitantly with an increase in GDNF expression.
Figure 7. Post hoc analysis of spinal cord sections from neonatal mice that have undergone sham surgery and spinal cord injury by compression .
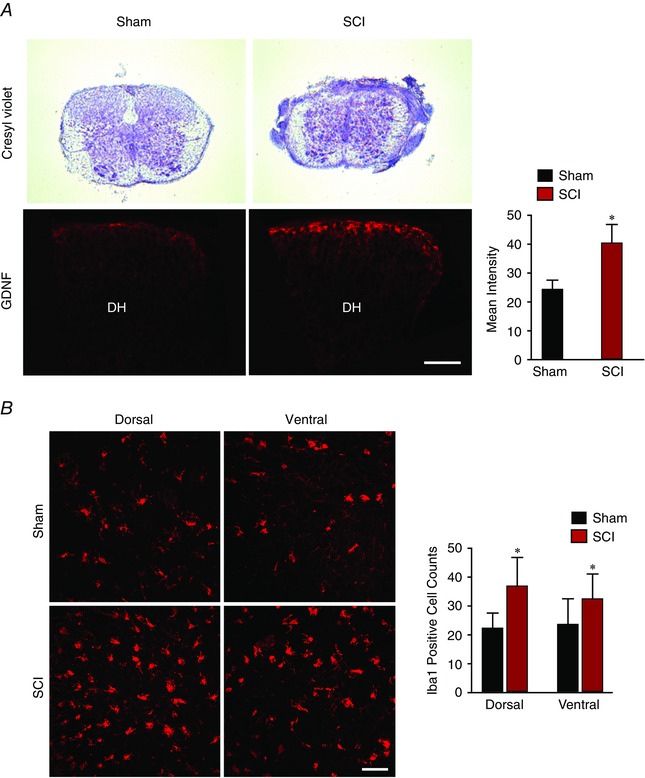
A, representative images of cresyl violet staining of spinal cord sections obtained from wild‐type (WT) mice that have undergone sham surgery (top left) and spinal cord injury (top right). The percentage mean ± SD of lesion size from nine injured spinal cords was 43.25 ± 8.28%. Representative images of spinal cord sections show that GDNF expression in the dorsal horn was significantly increased in mice that underwent spinal cord injury (bottom right) compared to mice with sham surgery (bottom left). All images are at 20× with the scale bar representing 50 μm (n = 3). Error bars indicate the SD. B, representative images of spinal cord sections from WT mice show the significant increase in proliferation of microglia (histogram) in the spinal cords obtained from mice that have undergone spinal cord injury compared to mice with sham surgery. Images are at 40× with the scale bar representing 50 μm (n = 5).
Figure 8. Co‐localization of GDNF expression in the microglia but not astrocytes in the dorsal horn of the spinal cord sections from naïve wild‐type (WT) neonatal mice .
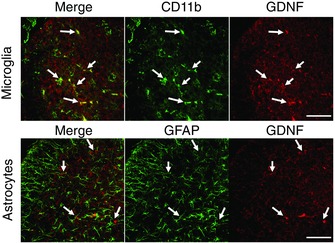
Representative images of spinal cord sections obtained from WT mice showing co‐localization of GDNF expression in the microglia of the dorsal horn (top). Representative images of spinal cord sections showing an absence of co‐localization of GDNF expression in the astrocytes of the dorsal horn (bottom). All images are at 60× with the scale bar representing 60 μm (n = 3).
Given the cellular link between BK and GDNF (Vellani et al. 2004), we next examined the consequence of BK treatment on GDNF expression in a BV2 microglia cell line. At a concentration of 25 μm, BK induced a significant increase in the GDNF protein levels in BV2 cells (Fig. 9). Having determined that B1R and B2R are expressed on BV2 microglia (data not shown), we next examined which receptor subtype was required for the increase in GDNF expression. We found that the increase in GDNF was blocked (P > 0.1) when BK was incubated with HOE 140 in the BV2 microglia line (Fig. 9). DABK, a B1R agonist, did not increase GDNF expression (P > 0.1). Taken together, these results raise the possibility that, following SCI, increased microglial GDNF expression in the spinal cord could be induced by the action of BK on B2R in microglia.
Figure 9. BK‐induced increase in expression of GDNF in the BV2 microglial cell line .
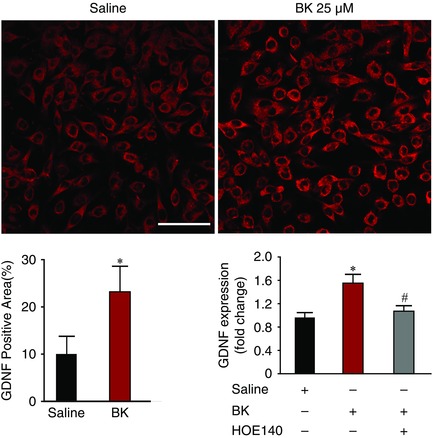
Representative images of BV2 cell cultures showing increased area of GDNF expression (top). Quantification of the increased GDNF expression area (bottom left). The increased expression of GDNF protein induced by BK (25 μm) measured by ELISA was inhibited by the B2R antagonist HOE 140 (5 μm; bottom right). All images are at 60× with the scale bar = 50 μm (n = 4).
Discussion
In the present study, we have made use of the kallikrein–kinin system to model pathological activation of sensorimotor networks. Following SCI, there is evidence for acute release and progressive accumulation of BK (Xu et al. 1991). However, the functional implications of acute and chronic effects of BK on sensorimotor networks in the developing spinal cord are unknown. In the present study, we demonstrate for the first time an acute, excitatory effect of BK on sensorimotor circuit elements that control locomotor function in the developing spinal cord. We demonstrate an important role for BK signalling in microglia as a potential mechanism for the protracted effects of excitotoxicity in a model of neonatal SCI. Longer‐term plasticity following SCI involved an increased proliferation of microglia and increased the expression of GDNF, mediated by BK actions on microglia. Our data position BK as a key substrate in the excitotoxic cascade of cytokines released following SCI.
We found that application of a high dose of BK, a potent B2R agonist, to the spinal cord induces a general increase in rhythm frequency followed by disruption of locomotor networks characterized by a reduction in co‐ordinated rhythmic activity. A similar increased frequency and disruption of locomotor rhythm was observed by the application of a subthreshold dose of BK, although only during activation of nociceptors by noxious heat. These data indicate that exposure of neonates to BK induces heat hypersensitivity resulting in the disruption of locomotor rhythm. We used spinal cord preparations from trpv1−/− mice (Caterina et al. 2000) to determine whether thermal hypersensitivity of the sensorimotor networks to BK was mediated via TRPV1, the ion channel known to detect noxious heat (Caterina et al. 1997). Noxious heat alone, or a combination of noxious heat and BK, did not affect the locomotor rhythm in the HL‐attached to spinal cord preparations isolated from the trpv1−/− mice. Using neonatal spinal cord preparations, we have previously shown that activation of nociceptors expressing TRPV1 can potently modulate drug‐induced locomotor rhythms under physiological conditions (Mandadi et al. 2009). Notably, we observed that activation of peripheral nociceptors resulted in an increase in locomotor rhythm frequency under noxious conditions (Mandadi et al. 2009). Because the TRPV1 ion channels are solely expressed in the superficial dorsal horn of the neonatal spinal cord (Mandadi et al. 2009; Cavanaugh et al. 2011; Mandadi et al. 2013 b), the BK‐induced thermal hypersensitivity probably resulted from an interaction between B2R with TRPV1 ion channels within the superficial laminae. This interaction is probably mediated via a protein kinase C‐linked pathway that has been causally implicated with bradykinin‐mediated hypersensitivity effects (Huang et al. 2006). A direct effect of BK‐induced sensitization of motoneurons (Bouhadfane et al. 2015) may also contribute towards an increased motor output observed during the BK‐induced thermal hypersensitivity.
Although connections from the dorsal horn onto ventral horn cells are documented (Jankowska, 1992; Bannatyne et al. 2006), specific inputs from pain afferents onto identified CPG interneurons have not been well‐defined. If modality‐specific interneurons could be identified and activated at physiological rates, we would expect modulation of the CPG similar to that observed when afferents were directly activated. We hypothesize that if the firing pattern of these cells were at rates activated during pathological conditions then we would expect profound network disruptions. Of additional interest is our data using capsaicin that, when applied directly to the spinal cord, also caused a transient network disruption (Mandadi et al. 2009; 2013 b). Capsaicin induces a high firing rate in dorsal horn interneurons as a result of TRPV1‐dependent augmentation of afferent transmission that raises firing rates beyond the dynamic range where network activity is modulated (Eckert et al. 2006), likely leading to a network crash (Marder et al. 2014). This is of interest because motor networks within the spinal cord are critical for generating normal stepping and our data raise the concern that hypersensitivity in nociceptive afferents may interfere with their function.
Our data also provide evidence for the potent direct activation of motoneurons and VLF‐projecting interneurons by BK acting on B2R. Unlike the transient effect on locomotor rhythm with intact synaptic neurotransmission, BK induced a prolonged depolarization and increased intracellular calcium in motor networks isolated from synaptic neurotransmission. The transient nature of BK effects on ongoing locomotor rhythm may result from the combination of drugs (NMA, 5‐HT and DA) inducing a high conductance state, as demonstrated in other systems (Alaburda et al. 2005). By contrast, a direct effect of BK, when tested on motoneurons and interneurons isolated from fast synaptic neurotransmission, showed a characteristic sustained depolarization. However, BK action on cultured DRG neurons shows desensitization by tachyphylaxis, whereby a repeat application of BK resulted in diminished responses (Thayer et al. 1988 b). Thus, sustained intracellular calcium signalling of BK may underlie the potential excitotoxicity despite an overall transient disruption of locomotor networks. Following SCI, the initial insult leads to a release of glutamate and cytokines, including BK, that are implicated in excitotoxicity and cell death during the first hours following SCI (Xu et al. 1991; Pan et al. 2001; Ferguson et al. 2008; Han & Whelan, 2010). Several lines of evidence from our work suggest that BK contributes to excitotoxicity by enhancing depolarization of motoneurons and interneurons within the ventral horn. First, ChAT and B2R are co‐expressed in motoneurons and B2R is expressed in ventrally‐located interneurons. Second, application of BK leads to direct depolarization of motoneurons and VLF‐projecting interneurons. This is congruent with a recent study demonstrating mechanisms whereby BK acts directly on motor networks within the spinal cord (Bouhadfane et al. 2015). Some recent work in the hippocampus suggests that B2R activation has a neuroprotective effect against NMDA‐induced excitotoxicity following stroke (Martins et al. 2012). Although our work implicates BK in disrupting locomotor activity, more studies are needed to confirm the detrimental role of B2R activation following SCI. Long‐term effects of BK in our model of neonatal SCI point to a role for increased GDNF induced by BK signalling in microglia. A significant increase in GDNF was observed only in the dorsal horn but not the ventral horn after SCI. The difference in GDNF expression could result from the greater proliferation of microglia observed in the dorsal horn compared to the ventral horn in our experimental model of SCI. Longitudinal studies are required to demonstrate the temporal effects of kinins following SCI, especially during development. Further studies using B2R or B1R knockout mice can resolve these unanswered questions. Our work highlights a complex role for GDNF following spinal cord injury. In the adult spinal cord, GDNF can be neuroprotective following neurotrauma (Awad et al. 2015) but, through upregulation of B1R (Vellani et al. 2004), GDNF can also contribute to the onset of chronic pain. Such interaction in neonates will require further investigation.
Conclusions
Our data offer several insights on the interplay between inflammation and hypersensitivity of kinin receptor systems in the developing sensorimotor system. The expression of kinin receptors within the pain and motor systems ensures that, under pathological conditions, (i) pain pathways are sensitized and (ii) the motor systems themselves enter a state of heightened excitability as a result of the activation of kinin receptors on ventral horn interneurons and motoneurons. We observed that BK caused a rapid and transient disruption of sensorimotor networks. These events may alter responses of spinal motor networks to further trauma via central inflammatory cascades. One such signalling cascade that could result in longer‐term effects of BK is its action on B2R in the proliferating microglia in the injured spinal cord. Future studies are required to examine the consequences of neonatal inflammatory kinin release on responses to future trauma during the maturation of spinal networks. Of great interest would be the identification of relay interneurons within the dorsal horn that underlie the pathological and normal activation of CPGs by noxious inputs (Zhang & Bao, 2006). The use of genetic tools to identify specific interneurons will yield important results regarding this area of knowledge (Goulding, 2009; Alaynick et al. 2011). Our identification of neuron–glia interactions mediated by kinin signalling in microglia following pediatric SCI creates new therapeutic targets for reducing excitotoxic and longer‐term damage.
Additional information
Competing interests
The authors declare that they have no competing interests.
Author contributions
SM, PW and TT were involved in designing and conceiving the experiments. SM, SS, PH, HLP and JE were involved in data acquisition, interpretation and analysis of data. SM and PW were involved in drafting the work. SM, PW, TT, SS, JE, PH and HLP critically revised the document. All authors have approved the final version of the manuscript and agree to be accountable for all aspects of the work. All persons designated as authors qualify for authorship, and all those who qualify for authorship are listed.
Acknowledgements
This work was supported by grants from Pfizer Canada (PW, SM) and the Natural Sciences and Engineering Research Council (NSERC) (PW‐DG, TT‐DG). Studentships from the following agencies supported the following: Alberta Innovates Health Solutions (PH, SS), NSERC PGS‐D (SS) and NSERC CGS‐M (HLP). We acknowledge microscopy support from the RUN core, Hotchkiss Brain Institute.
References
- Alaburda A, Russo R, MacAulay N & Hounsgaard J (2005). Periodic high‐conductance states in spinal neurons during scratch‐like network activity in adult turtles. J Neurosci 25, 6316–6321. [DOI] [PMC free article] [PubMed] [Google Scholar]
- Alaynick WA, Jessell TM & Pfaff SL (2011). SnapShot: spinal cord development. Cell 146, 178–178.e1. [DOI] [PMC free article] [PubMed] [Google Scholar]
- Awad BI, Carmody MA & Steinmetz MP (2015). Potential role of growth factors in the management of spinal cord injury. World Neurosurg 83, 120–131. [DOI] [PubMed] [Google Scholar]
- Bannatyne BA, Edgley SA, Hammar I, Jankowska E & Maxwell DJ (2006). Differential projections of excitatory and inhibitory dorsal horn interneurons relaying information from group II muscle afferents in the cat spinal cord. J Neurosci 26, 2871–2880. [DOI] [PMC free article] [PubMed] [Google Scholar]
- Bonnot A, Whelan PJ, Mentis GZ & O'Donovan MJ (2002. a). Locomotor‐like activity generated by the neonatal mouse spinal cord. Brain Res Rev 40, 141–151. [DOI] [PubMed] [Google Scholar]
- Bonnot A, Whelan P, Mentis G & O'Donovan M (2002. b). Spatiotemporal pattern of motoneuron activation in the rostral lumbar and the sacral segments during locomotor‐like activity in the neonatal mouse spinal cord. J Neurosci 22, RC203. [DOI] [PMC free article] [PubMed] [Google Scholar]
- Bouhadfane M, Kaszás A, Rózsa B, Harris‐Warrick RM, Vinay L & Brocard F (2015). Sensitization of neonatal rat lumbar motoneuron by the inflammatory pain mediator bradykinin. Elife 4, e06195. [DOI] [PMC free article] [PubMed] [Google Scholar]
- Boulland J‐L, Lambert FM, Züchner M, Ström S & Glover JC (2013). A neonatal mouse spinal cord injury model for assessing post‐injury adaptive plasticity and human stem cell integration. PLoS ONE 8, e71701. [DOI] [PMC free article] [PubMed] [Google Scholar]
- Caterina MJ, Leffler A, Malmberg AB, Martin WJ, Trafton J, Petersen‐Zeitz KR, Koltzenburg M, Basbaum AI & Julius D (2000). Impaired nociception and pain sensation in mice lacking the capsaicin receptor. Science 288, 306–313. [DOI] [PubMed] [Google Scholar]
- Caterina MJ, Schumacher MA, Tominaga M, Rosen TA, Levine JD & Julius D (1997). The capsaicin receptor: a heat‐activated ion channel in the pain pathway. Nature 389, 816–824. [DOI] [PubMed] [Google Scholar]
- Cavanaugh DJ, Chesler AT, Braz JM, Shah NM, Julius D & Basbaum AI (2011). Restriction of transient receptor potential vanilloid‐1 to the peptidergic subset of primary afferent neurons follows its developmental downregulation in nonpeptidergic neurons. J Neurosci 31, 10119–10127. [DOI] [PMC free article] [PubMed] [Google Scholar]
- Coull JAM, Beggs S, Boudreau D, Boivin D, Tsuda M, Inoue K, Gravel C, Salter MW & de Koninck Y (2005). BDNF from microglia causes the shift in neuronal anion gradient underlying neuropathic pain. Nature 438, 1017–1021. [DOI] [PubMed] [Google Scholar]
- Couture R, Harrisson M, Vianna RM & Cloutier F (2001). Kinin receptors in pain and inflammation. Eur J Pharmacol 429, 161–176. [DOI] [PubMed] [Google Scholar]
- DomBourian MG, Turner NA, Gerovac TA, Vemuganti R, Miranpuri GS, Türeyen K, Satriotomo I, Miletic V & Resnick DK (2006). B1 and TRPV‐1 receptor genes and their relationship to hyperalgesia following spinal cord injury. Spine 31, 2778–2782. [DOI] [PubMed] [Google Scholar]
- Eckert WA, Julius D & Basbaum AI (2006). Differential contribution of TRPV1 to thermal responses and tissue injury‐induced sensitization of dorsal horn neurons in laminae I and V in the mouse. Pain 126, 184–197. [DOI] [PubMed] [Google Scholar]
- Fedirchuk B, Wenner P, Whelan PJ, Ho S, Tabak J & O'donovan MJ (1999). Spontaneous network activity transiently depresses synaptic transmission in the embryonic chick spinal cord. J Neurosci 19, 2102–2112. [DOI] [PMC free article] [PubMed] [Google Scholar]
- Ferguson AR, Christensen RN, Gensel JC, Miller BA, Sun F, Beattie EC, Bresnahan JC & Beattie MS (2008). Cell death after spinal cord injury is exacerbated by rapid TNF alpha‐induced trafficking of GluR2‐lacking AMPARs to the plasma membrane. J Neurosci 28, 11391–11400. [DOI] [PMC free article] [PubMed] [Google Scholar]
- Ferrini F, Trang T, T‐AM Mattioli, Laffray S, Del'Guidice T, L‐E Lorenzo, Castonguay A, Doyon N, Zhang W, Godin AG, Mohr D, Beggs S, Vandal K, J‐M Beaulieu, Cahill CM, Salter MW & de Koninck Y (2013). Morphine hyperalgesia gated through microglia‐mediated disruption of neuronal Cl− homeostasis. Nat Neurosci 16, 183–192. [DOI] [PMC free article] [PubMed] [Google Scholar]
- Goulding M (2009). Circuits controlling vertebrate locomotion: moving in a new direction. Nat Rev Neurosci 10, 507–518. [DOI] [PMC free article] [PubMed] [Google Scholar]
- Han P & Whelan PJ (2010). Tumor necrosis factor alpha enhances glutamatergic transmission onto spinal motoneurons. J Neurotrauma 27, 287–292. [DOI] [PubMed] [Google Scholar]
- Han P, Nakanishi ST, Tran MA & Whelan PJ (2007). Dopaminergic modulation of spinal neuronal excitability. J Neurosci 27, 13192–13204. [DOI] [PMC free article] [PubMed] [Google Scholar]
- Huang J, Zhang X & McNaughton PA (2006). Inflammatory pain: the cellular basis of heat hyperalgesia. Curr Neuropharmacol 4, 197–206. [DOI] [PMC free article] [PubMed] [Google Scholar]
- Humphreys JM & Whelan PJ (2012). Dopamine exerts activation‐dependent modulation of spinal locomotor circuits in the neonatal mouse. J Neurophysiol 108, 3370–3381. [DOI] [PubMed] [Google Scholar]
- Jankowska E (1992). Interneuronal relay in spinal pathways from proprioceptors. Prog Neurobiol 38, 335–378. [DOI] [PubMed] [Google Scholar]
- Julius D & Basbaum AI (2001). Molecular mechanisms of nociception. Nature 413, 203–210. [DOI] [PubMed] [Google Scholar]
- Lopes P & Couture R (1997). Localization of bradykinin‐like immunoreactivity in the rat spinal cord: effects of capsaicin, melittin, dorsal rhizotomy and peripheral axotomy. Neuroscience 78, 481–497. [DOI] [PubMed] [Google Scholar]
- Mandadi S & Roufogalis BD (2008). ThermoTRP channels in nociceptors: taking a lead from capsaicin receptor TRPV1. Curr Neuropharmacol 6, 21–38. [DOI] [PMC free article] [PubMed] [Google Scholar]
- Mandadi S & Whelan PJ (2009). A new method to study sensory modulation of locomotor networks by activation of thermosensitive cutaneous afferents using a hindlimb attached spinal cord preparation. J Neurosci Methods 182, 255–259. [DOI] [PubMed] [Google Scholar]
- Mandadi S, Hong P & Whelan P (2012). Role of bradykinin and glial derived neurotrophic factor in TRPV1‐mediated modulation of sensorimotor function in a neonatal mouse spinal cord. 14th World Congress on Pain, Milan, Italy. Online
- Mandadi S, Hong P, Dhoopar AS & Whelan P (2013. a). Control of neonatal spinal networks by nociceptors: a potential role for TRP channel based therapies. J Pharm Pharm Sci 16, 313–320. [DOI] [PubMed] [Google Scholar]
- Mandadi S, Hong P, Leduc‐Pessah H, Ejdrygiewicz J, Trang T & Whelan PJ (2014). Interactions of kinins and TRPV1 in a model of neonatal mouse spinal cord inflammation. Program Number 498.09. 2014 Neuroscience Program Meeting Planner. Washington DC: Society for Neuroscience, 2014. Online.
- Mandadi S, Hong P, Tran MA, Braz JM, Colarusso P, Basbaum AI & Whelan PJ (2013. b). Identification of multisegmental nociceptive afferents that modulate locomotor circuits in the neonatal mouse spinal cord. J Comp Neurol 521, 2870–2887. [DOI] [PubMed] [Google Scholar]
- Mandadi S, Nakanishi ST, Takashima Y, Dhaka A, Patapoutian A, McKemy DD & Whelan PJ (2009). Locomotor networks are targets of modulation by sensory transient receptor potential vanilloid 1 and transient receptor potential melastatin 8 channels. Neuroscience 162, 1377–1397. [DOI] [PMC free article] [PubMed] [Google Scholar]
- Marceau F, Hess JF & Bachvarov DR (1998). The B1 receptors for kinins. Pharmacol Rev 50, 357–386. [PubMed] [Google Scholar]
- Marder E, O'Leary T & Shruti S (2014). Neuromodulation of circuits with variable parameters: single neurons and small circuits reveal principles of state‐dependent and robust neuromodulation. Annu Rev Neurosci 37, 329–346. [DOI] [PubMed] [Google Scholar]
- Martins AH, Alves JM, Perez D, Carrasco M, Torres‐Rivera W, Eterović VA, Ferchmin PA & Ulrich H (2012). Kinin‐B2 receptor mediated neuroprotection after NMDA excitotoxicity is reversed in the presence of kinin‐B1 receptor agonists. PLoS ONE 7, e30755. [DOI] [PMC free article] [PubMed] [Google Scholar]
- Mizumura K, Sugiura T, Katanosaka K, Banik RK & Kozaki Y (2009). Excitation and sensitization of nociceptors by bradykinin: what do we know? Exp Brain Res 196, 53–65. [DOI] [PubMed] [Google Scholar]
- Mor Y & Lev‐Tov A (2007). Analysis of rhythmic patterns produced by spinal neural networks. J Neurophysiol 98, 2807–2817. [DOI] [PubMed] [Google Scholar]
- Nakanishi ST & Whelan PJ (2012). A decerebrate adult mouse model for examining the sensorimotor control of locomotion. J Neurophysiol 107, 500–515. [DOI] [PubMed] [Google Scholar]
- O'Donovan MJ, Ho S, Sholomenko G & Yee W (1993). Real‐time imaging of neurons retrogradely and anterogradely labelled with calcium‐sensitive dyes. J Neurosci Methods 46, 91–106. [DOI] [PubMed] [Google Scholar]
- Pan W, Kastin AJ, Gera L & Stewart JM (2001). Bradykinin antagonist decreases early disruption of the blood–spinal cord barrier after spinal cord injury in mice. Neurosci Lett 307, 25–28. [DOI] [PubMed] [Google Scholar]
- Rajpal S, Gerovac TA, Turner NA, Tilghman JI, Allcock BK, McChesney SL, Miranpuri GS, Park SW & Resnick DK (2007). Antihyperalgesic effects of vanilloid‐1 and bradykinin‐1 receptor antagonists following spinal cord injury in rats. J Neurosurg Spine 6, 420–424. [DOI] [PubMed] [Google Scholar]
- Regoli D & Barabé J (1980). Pharmacology of bradykinin and related kinins. Pharmacol Rev 32, 1–46. [PubMed] [Google Scholar]
- Sharples SA, Humphreys JM, Jensen AM, Dhoopar S, Delaloye N, Clemens S & Whelan PJ (2015). Dopaminergic modulation of locomotor network activity in the neonatal mouse spinal cord. J Neurophysiol 113, 2500–2510. [DOI] [PMC free article] [PubMed] [Google Scholar]
- Sugiura T, Tominaga M, Katsuya H & Mizumura K (2002). Bradykinin lowers the threshold temperature for heat activation of vanilloid receptor 1. J Neurophysiol 88, 544–548. [DOI] [PubMed] [Google Scholar]
- Thayer SA, Perney TM & Miller RJ (1988. a). Regulation of calcium homeostasis in sensory neurons by bradykinin. J Neurosci 8, 4089–4097. [DOI] [PMC free article] [PubMed] [Google Scholar]
- Thayer SA, Perney TM & Miller RJ (1988. b). Regulation of calcium homeostasis in sensory neurons by bradykinin. J Neurosci 8, 4089–4097. [DOI] [PMC free article] [PubMed] [Google Scholar]
- Trupp M, Rydén M, Jörnvall H, Funakoshi H, Timmusk T, Arenas E & Ibáñez CF (1995). Peripheral expression and biological activities of GDNF, a new neurotrophic factor for avian and mammalian peripheral neurons. J Cell Biol 130, 137–148. [DOI] [PMC free article] [PubMed] [Google Scholar]
- Vellani V, Zachrisson O & McNaughton PA (2004). Functional bradykinin B1 receptors are expressed in nociceptive neurones and are upregulated by the neurotrophin GDNF. J Physiol (Lond) 560, 391–401. [DOI] [PMC free article] [PubMed] [Google Scholar]
- Whelan P, Bonnot A & O'Donovan MJ (2000). Properties of rhythmic activity generated by the isolated spinal cord of the neonatal mouse. J Neurophysiol 84, 2821–2833. [DOI] [PubMed] [Google Scholar]
- Xu J, Hsu CY, Junker H, Chao S, Hogan EL & Chao J (1991). Kininogen and kinin in experimental spinal cord injury. J Neurochem 57, 975–980. [DOI] [PubMed] [Google Scholar]
- Zhang X & Bao L (2006). The development and modulation of nociceptive circuitry. Curr Opin Neurobiol 16, 460–466. [DOI] [PubMed] [Google Scholar]