

Key points
How the brain extracellular fluid influences the activity of GABAergic interneurons in vivo is not known.
This issue is examined in the hippocampal brain slice by comparing GABAergic interneuron activity in human versus artificial cerebrospinal fluid.
Human cerebrospinal fluid (hCSF) substantially increases the excitability of fast‐spiking and non‐fast‐spiking CA1 interneurons.
CA1 pyramidal cells are even more strongly excited by hCSF.
The tonic excitation of pyramidal cells, in combination with an increased responsiveness of interneurons to excitatory input, is likely to promote the generation of synchronized network activity in the hippocampus.
Abstract
GABAergic interneurons intricately regulate the activity of hippocampal and neocortical networks. Their function in vivo is likely to be tuned by neuromodulatory substances in the brain extracellular fluid. However, in vitro investigations of GABAergic interneuron function do not account for such effects, as neurons are kept in artificial extracellular fluid. To examine the neuromodulatory influence of brain extracellular fluid on GABAergic activity, we recorded from fast‐spiking and non‐fast‐spiking CA1 interneurons, as well as from pyramidal cells, in the presence of human cerebrospinal fluid (hCSF), using a matched artificial cerebrospinal fluid (aCSF) as control. We found that hCSF increased the frequency of spontaneous firing more than twofold in the two groups of interneurons, and more than fourfold in CA1 pyramidal cells. hCSF did not affect the resting membrane potential of CA1 interneurons but caused depolarization in pyramidal cells. The increased excitability of interneurons and pyramidal cells was accompanied by reductions in after‐hyperpolarization amplitudes and a left‐shift in the frequency–current relationships. Our results suggest that ambient concentrations of neuromodulators in the brain extracellular fluid powerfully influence the excitability of neuronal networks.
Key points
How the brain extracellular fluid influences the activity of GABAergic interneurons in vivo is not known.
This issue is examined in the hippocampal brain slice by comparing GABAergic interneuron activity in human versus artificial cerebrospinal fluid.
Human cerebrospinal fluid (hCSF) substantially increases the excitability of fast‐spiking and non‐fast‐spiking CA1 interneurons.
CA1 pyramidal cells are even more strongly excited by hCSF.
The tonic excitation of pyramidal cells, in combination with an increased responsiveness of interneurons to excitatory input, is likely to promote the generation of synchronized network activity in the hippocampus.
Abbreviations
- aCSF
artificial cerebrospinal fluid
- AHP
after‐hyperpolarization
- AP
action potential
- APHW
action potential half width
- fAHP
fast after‐hyperpolarization
- f–I
frequency–current
- Fmax
maximum firing frequency
- FS
fast‐spiking
- hCSF
human cerebrospinal fluid
- I Fmax/2
amount of injected current required to reach half of maximum firing frequency
- mAHP
medium after‐hyperpolarization
- NFS
non‐fast‐spiking
- Rin
input resistance
- sEPSP
spontaneous excitatory postsynaptic potential
- τm
membrane time constant
- Vm
membrane potential
- Vrest
resting membrane potential
Introduction
The hippocampus and neocortex host a diverse population of GABAergic interneurons that together regulate the activity of principal neurons. Within this population, a subgroup of interneurons with fast‐spiking (FS) phenotype form powerful perisomatic‐targeting inhibitory synapses on principal neurons and are thought to contribute significantly to the generation of oscillatory network activity (Buzsaki et al. 1983; Cobb et al. 1995; Mann et al. 2005). FS interneurons are known to frequently express the calcium‐binding protein parvalbumin and display a number of distinct electrophysiological properties, including low input resistance (R in), short membrane time constants (τm), narrow action potentials (APs) and high maximum firing frequency (>150 Hz) in response to depolarizing current pulses (Gonzalez‐Burgos et al. 2004; Doischer et al. 2008). These, and yet other, functional properties allow FS interneurons to rapidly convert excitatory input into a strong inhibitory output capable of potently regulating AP firing in principal cells (Hu et al. 2014). Among other subgroups of GABAergic interneurons found in the hippocampus and neocortex are those expressing cholecystokinin, somatostatin and vasointestinal peptide (Freund & Buzsaki, 1996; Markram et al. 2004; Tricoire et al. 2011). These interneurons typically produce broader APs at lower frequency than FS interneurons, and commonly display a higher R in. Although functional differences exist between these interneuron subtypes, they can be classified as non‐fast‐spiking (NFS) (Kawaguchi & Kondo, 2002; Petilla Interneuron Nomenclature Group et al. 2008; Andersson et al. 2012). The rich diversity and non‐random distribution of functional properties among cortical interneurons suggest that distinct cell types perform specialized sets of computations in neural networks (Buzsaki et al. 2004; Klausberger & Somogyi, 2008).
A critical component determining how GABAergic interneurons operate in a neural network is neuromodulation. Many different neuromodulators are known to alter intrinsic and/or synaptic properties of neurons, frequently achieving their effect through activation of G‐protein coupled receptors on the target cell (Hille, 1992; Gainetdinov et al. 2004; LeBeau et al. 2005). Neuromodulators constitute a diverse group of neuroactive substances ranging from the classical transmitters dopamine, noradrenaline, serotonin, histamine and acetylcholine, to different neuropeptides, hormones, gliotransmitters and cytokines. Although some of these substances typically modulate the state of neuronal circuits with temporal and spatial specificity, many of them seem to also be present in low ambient concentrations in the extracellular fluid (Jackson, 1980; Post et al. 1988). Some of these neuromodulators may potentially be released directly into ventricular cerebrospinal fluid (CSF) via CSF‐contacting neurons (Vigh et al. 2004; Veening & Barendregt, 2010). While effects of individual neuromodulators on various cell types have been studied extensively, it is not well established how neuromodulators in real brain extracellular fluid collectively impact neuronal function in vivo. When recording from neurons in in vitro brain slices, switching from a matched artificial cerebrospinal fluid (aCSF) to human cerebrospinal fluid (hCSF) offers the opportunity to study the collective contribution of neuromodulators in shaping functional properties of neurons. We recently showed that hCSF strongly increases the excitability of hippocampal and neocortical pyramidal neurons via G‐protein dependent mechanisms (Bjorefeldt et al. 2015). Like pyramidal cells, GABAergic interneurons are influenced by a wide range of neuromodulators that together determine the operational state of the cell (Bacci et al. 2005). It is assumed that the neuromodulation taking place in vivo operates, at least in part, through non‐synaptic (volume) transmission via the interstitial and cerebrospinal fluid (Agnati et al. 1995; Syková & Vargová, 2008; Veening & Barendregt, 2010). However, whether ambient neuromodulators are in fact present at sufficient concentration to significantly modulate GABAergic interneuron activity has not been shown.
Here we examined the neuromodulatory influence of hCSF on functional properties of FS and NFS GABAergic interneurons in rat hippocampal brain slices. A number of CA1 pyramidal cells were included and used as reference material in this study.
Methods
Artificial and human cerebrospinal fluid
All hCSF samples were collected via lumbar puncture performed by neurologists at the Sahlgrenska University Hospital in Gothenburg, Sweden. The majority of hCSF came from patients diagnosed with normal pressure hydrocephalus, while a lesser amount was contributed by healthy volunteers and used as control. Data obtained with hCSF from patients and healthy volunteers were pooled since they similarly increased spontaneous firing and excitability in both interneurons and pyramidal cells. Samples from each source were combined to create two pools of 550 and 150 ml hCSF, respectively. Patient samples (n = 10, age and sex unknown) were acquired from the clinical routine at the Department of Clinical Neuroscience, Sahlgrenska University Hospital. Healthy hCSF was obtained from male and female volunteers (n = 10, mean age 26 years, range 20–30 years) after written informed consent, and with permission from the local ethical committee at the University of Gothenburg. All clinical procedures were carried out in accordance with the principles of the Declaration of Helsinki. All hCSF samples were rapidly stored at –80°C after acquisition and each sample was thawed to room temperature once for pooling, then a second time on the experimental day. The total concentration of electrolytes and glucose, as well as pH and osmolality, was measured in both hCSF pools (Table 2) according to methodology previously described in Bjorefeldt et al. 2015. A matched aCSF was then designed based on the measurements obtained from each hCSF pool (Table 2). Both hCSF pools displayed normal electrolyte and glucose content, pH, osmolality and colouring. The ionized fraction of Ca2+ and Mg2+ in hCSF was estimated to account for 90% of the measured total concentration (Joborn et al. 1991). It should be noted that HCO3 − is not included in the measurements presented in Table 2. Prior to experimentation, frozen hCSF was thawed to room temperature in a bowl of warm (37°C) water. During, and prior to, electrophysiological recordings, aCSF and hCSF were bubbled with a gas mixture of 95% O2 and 5% CO2. The amount of hCSF used in a single experiment was 12 ml.
Table 2.
Composition of artificial and human cerebrospinal fluids
| Osmolality | ||||||||
|---|---|---|---|---|---|---|---|---|
| pH | (mosmol kg−1) | Na+ | K+ | Cl− | Ca2+ | Mg2+ | Glucose | |
| hCSF1 | 7.35 | 293 | 149 | 2.8 | 124.9 | 1.17 | 1.12 | 3.72 |
| aCSF1 | 7.42 ± 0.03 | 288 ± 1 | 147.8 ± 0.4 | 2.79 ± 0.02 | 123.4 ± 0.8 | 1.15 ± 0.02 | 1.13 ± 0.01 | 3.7 ± 0.02 |
| hCSF2 | 7.35 | 287 | 146.1 | 2.89 | 122.9 | 1.13 | 1.14 | 3.31 |
| aCSF2 | 7.41 ± 0.02 | 284 ± 1 | 144.6 ± 0.3 | 2.91 ± 0.01 | 122.8 ± 0.21 | 1.11 ± 0.01 | 1.11 ± 0.02 | 3.37 ± 0.04 |
Concentrations of electrolytes and glucose are in mm. hCSF1: CSF pool from normal pressure hydrocephalus (NPH) patients (n = 10 individuals). aCSF1: aCSF designed to match the NPH pool. Measurements were taken from aCSF solutions prepared on experimental day (n = 5). hCSF2: CSF pool from healthy volunteers (n = 10 individuals). aCSF2: aCSF designed to match the healthy CSF pool. Measurements were taken from aCSF solutions prepared on experimental day (n = 3).
Slice preparation
Experiments were performed in the CA1 region of acute hippocampal brain slices from 20‐ to 30‐day‐old (P20–30) Wistar rats, conducted in accordance with regulations of the Swedish Animal Welfare law and approved by the local ethical committee for animal research at the University of Gothenburg, Sweden. Male and female rats were anaesthetized via inhalation of isoflurane (Abbott) and then decapitated. The brain was quickly removed and put in ice‐cold (0–3°C) slicing solution containing (in mm): 220 glycerol, 2.5 KCl, 1.2 CaCl2, 7 MgCl2, 26 NaHCO3, 1.2 NaH2PO4 and 11 d‐glucose. Sagittal slices (300–400 μm) were prepared from dorsal hippocampi using a vibratome (HM650V, Microm, Walldorf, Germany). Brain slices were stored in aCSF containing (in mm): 129 NaCl, 3 KCl, 2 CaCl2, 4 MgCl2, 26 NaHCO3, 1.25 NaH2PO4, 10 d‐glucose. Slicing and storage solutions were continuously bubbled with a mixture of 95% O2 and 5% CO2. After 1–5 h of storage at room temperature (22–25°C), a hippocampal slice was transferred to a recording chamber perfused with aCSF (32–34˚C) at a rate of 3 ml min–1.
Electrophysiology
Whole‐cell current clamp recordings were made from CA1 interneurons with their somata located in stratum pyramidale or extending ≤50 μm into stratum oriens. We chose this region because our primary aim was to find fast‐spiking interneurons, and the majority of these interneurons have their somata in the stratum pyramidale and in the border region between stratum pyramidale and stratum oriens (Pawelzik et al. 2002). Cells were visually identified using differential interference contrast microscopy (E600FN, Nikon, Tokyo, Japan) together with a CCD camera (XC‐73CE, Sony). Recordings were made using borosilicate glass micropipettes (1.5 mm/0.86 mm) with resistances of 3–6 MΩ. The pipette capacitance was cancelled in cell‐attached mode. The intracellular solution contained (in mm): 127 potassium gluconate, 8 KCl, 10 Hepes, 15 phosphocreatine, 4 Mg‐ATP, 0.3 Na‐GTP and 0.3% biocytin (pH 7.3, 295 mosmol kg−1). After obtaining whole‐cell configuration, no current or voltage was applied to the cell for the first few minutes. Series resistance (5–25 MΩ) was not allowed to fluctuate more than 20% throughout recordings. The liquid junction potential was measured to –9 mV, according to methodology previously described by Neher (Neher, 1992), and was not corrected for.
Histology
Interneurons filled with biocytin (Sigma‐Aldrich, St. Louis, MO, USA) were fixed overnight (4°C) in phosphate‐buffered saline (0.9% NaCl) containing paraformaldehyde (4%), pH 7.3. Slices were washed in phosphate buffer (0.1 m, pH 7.3) then incubated in 0.25% Triton X‐100 together with 5% normal goat serum (NGS, Invitrogen) overnight at room temperature. They were then washed a second time and incubated in streptavidin‐CY5 (1:300, Invitrogen), 0.25% Triton X‐100 and 5% NGS for 2 h at room temperature. After a final wash, slices were mounted on slides and coverslipped with ProLong Gold (Molecular Probes). Streptavidin‐CY5‐labelled cells were examined and imaged on a Zeiss confocal microscope (LSM 510) using ×20 and ×63 oil immersion objectives.
Data acquisition and analysis
Data were acquired at a sampling frequency of 10 kHz and filtered at 3 kHz using an EPC‐9 amplifier together with the PatchMaster software (HEKA Elektronik). Data analysis was performed in IGOR Pro (version 6, WaveMetrics, Lake Oswego, OR, USA). R in was extracted from the slope of the voltage–current relationship in response to 10 pA step hyperpolarizing current injections (–100 to 0 pA, 300 ms) from –70 mV. τm was calculated by fitting an exponential function to the voltage response produced from hyperpolarizing current injection (–100 pA, 300 ms). Sag ratio was calculated by dividing the steady‐state amplitude during a hyperpolarizing current injection (–100 pA, 300 ms) with the maximum amplitude. Action potential half width (APHW) was measured at half maximal AP amplitude, as measured from AP threshold. Resting membrane potential (V rest) was recorded at zero current injection (I = 0). Spontaneous AP properties (Fig. 3) were extracted from plotting the first derivative of voltage (dV/dt) against membrane potential (V m; phase‐plane plot) for 10 consecutive APs recorded in aCSF and hCSF. AP threshold was defined as the V m at which dV/dt exceeded 20 mV ms–1. AP amplitude was measured as the voltage difference between AP threshold and peak of overshoot. Fast and medium after‐hyperpolarizations (AHPs) were measured after 5 and 50 ms, respectively (Storm, 1987). In frequency–current (f–I) plots, firing frequency (Hz) was calculated from the total number of APs produced during step depolarizing current injections (800 ms, 50 pA increments) ranging from –50 to 650 pA. Rheobase and slope were extracted from f–I plots in each experiment. 1st AP threshold in f–I plots was defined as the V m at which dV/dt exceeded 20 mV ms–1 and measured at minimal depolarizing current step where one or more APs were generated in both aCSF and hCSF. Sinusoidal current injection (100 pA) was delivered over a period of 3 s at frequencies of 5 and 40 Hz. sEPSP frequency was averaged from three 1 s long sweeps (–70 mV) in aCSF and hCSF.
Figure 3. hCSF reduces after‐hyperpolarizing potentials of spontaneous APs in FS and NFS interneurons .
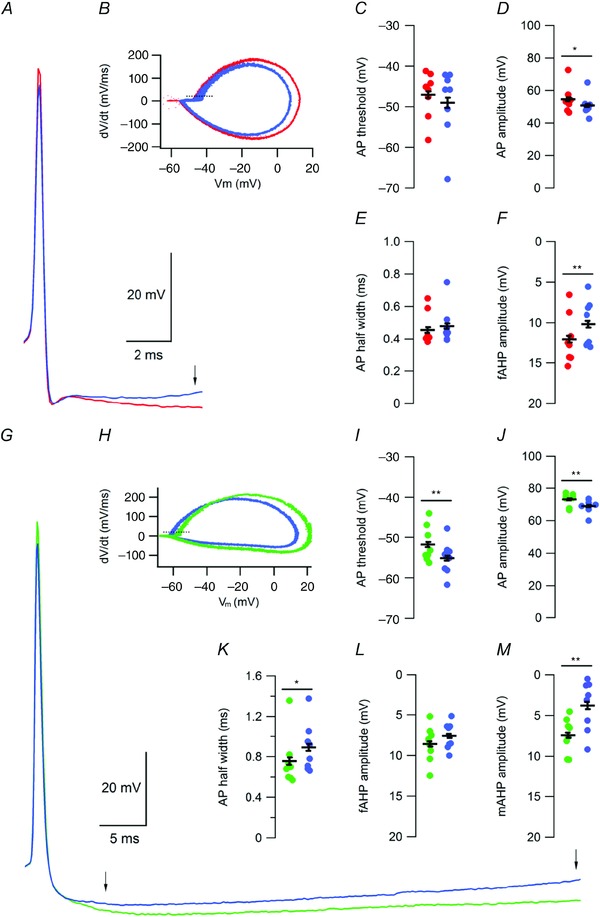
A, example of spontaneous AP waveform of FS interneurons recorded in aCSF (red) and hCSF (blue). Arrow indicates point of fAHP amplitude measurement. B, representative phase‐plane plot constructed from spontaneous APs recorded over 60 s in aCSF (red) and hCSF (blue), in FS interneurons. Dashed line indicates a dV/dt of 20 mV ms−1. C–F, summary graphs showing effect of hCSF on spontaneous AP threshold (C), amplitude (D), half width (E) and fAHP amplitude (F). G, example of spontaneous AP waveform of NFS interneurons recorded in aCSF (green) and hCSF (blue). Arrows indicate point of fAHP (left arrow) and mAHP (right arrow) amplitude measurement. H, representative phase‐plane plot constructed from spontaneous APs recorded over 60 s in aCSF (green) and hCSF (blue), in NFS interneurons. Dashed line indicates a dV/dt of 20 mV ms−1. I–M, summary graphs showing effect of hCSF on spontaneous AP threshold (I), amplitude (J), half width (K), fAHP amplitude (L) and mAHP amplitude (M). Error bars represent SEM. *P < 0.05; **P < 0.01.
Statistics
Statistical significance was determined using Student's paired t test and the software SPSS statistics (version 22, IBM). Significance levels are given as ***P < 0.001; **P < 0.01; *P < 0.05. All data are presented as means ± SEM.
Results
Functional characterization of CA1 interneurons
Interneurons with their somata located in CA1 stratum pyramidale, or extending ≤50 μm into stratum oriens, were functionally characterized using a series of electrophysiological protocols (Markram et al. 2004; Andersson et al. 2012), and their morphology was determined post hoc (Fig. 1). Interneurons were initially divided into FS or NFS groups according to their maximum firing frequency in response to depolarizing current injection (cells firing at ˃150 Hz were considered FS). After further examination of interneuron properties in the two groups, we confirmed the existence of two functionally distinct classes of CA1 interneurons (Table 1). The FS group of interneurons displayed low R in with weak or non‐existent voltage sag in response to hyperpolarizing current pulses compared to interneurons in the NFS group (Fig. 1 C). FS interneurons also showed a much steeper response to increased depolarization, with higher maximum firing frequency and narrower APs than NFS interneurons (Fig. 1 D–F). Also, we included a number of CA1 pyramidal cells as a reference group for comparison of FS and NFS properties (Table 1, Fig. 7), and for reassessment of previously described effects of hCSF on hippocampal pyramidal cells (Bjorefeldt et al. 2015).
Figure 1. Functional characteristics of FS and NFS interneurons in CA1 stratum pyramidale .
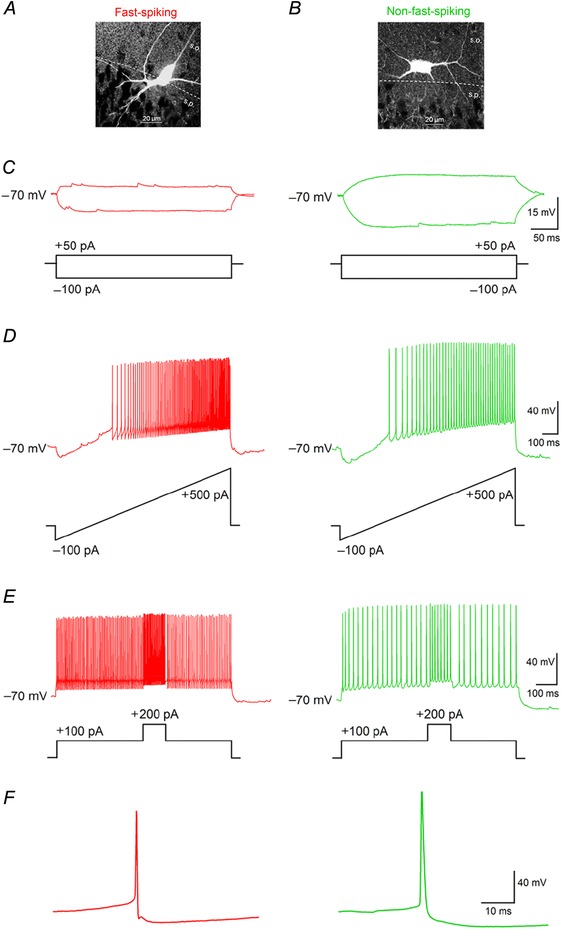
A and B, examples of interneuron morphology in the FS (A) and NFS (B) group. C, typical voltage response to hyperpolarizing and subthreshold depolarizing current in FS (red) and NFS (green) interneurons. D, current ramp protocol response in FS and NFS groups. Note the steeper firing response to increased depolarization in FS cells. E, response of FS and NFS interneurons to a step‐in‐step protocol. Note the differential increase in firing produced by the step‐in‐step current pulse. F, examples of typical spontaneous AP waveform in FS and NFS interneurons at V rest. s.o., stratum oriens; s.p., stratum pyramidale. Scale bars, 20 μm.
Table 1.
Intrinsic membrane properties quantified in CA1 interneurons and pyramidal cells
| R in (MΩ) | Sag ratio | τm (ms) | APHW (ms) | F max (Hz) | |
|---|---|---|---|---|---|
| FS | 105.1 ± 6.4 | 0.95 ± 0.02 | 7.1 ± 0.7 | 0.46 ± 0.04 | 221.8 ± 21.2 |
| NFS | 179.2 ± 17.2 | 0.87 ± 0.03 | 14.5 ± 1.3 | 0.76 ± 0.09 | 80.7 ± 3.9 |
| PC | 74.7 ± 4.3 | 0.78 ± 0.01 | 14.2 ± 0.8 | 0.88 ± 0.02 | 49.5 ± 3.0 |
FS, fast‐spiking CA1 interneurons; NFS, non‐fast‐spiking CA1 interneurons; PC, CA1 pyramidal cells.
Figure 7. Effects of hCSF on CA1 pyramidal cells .
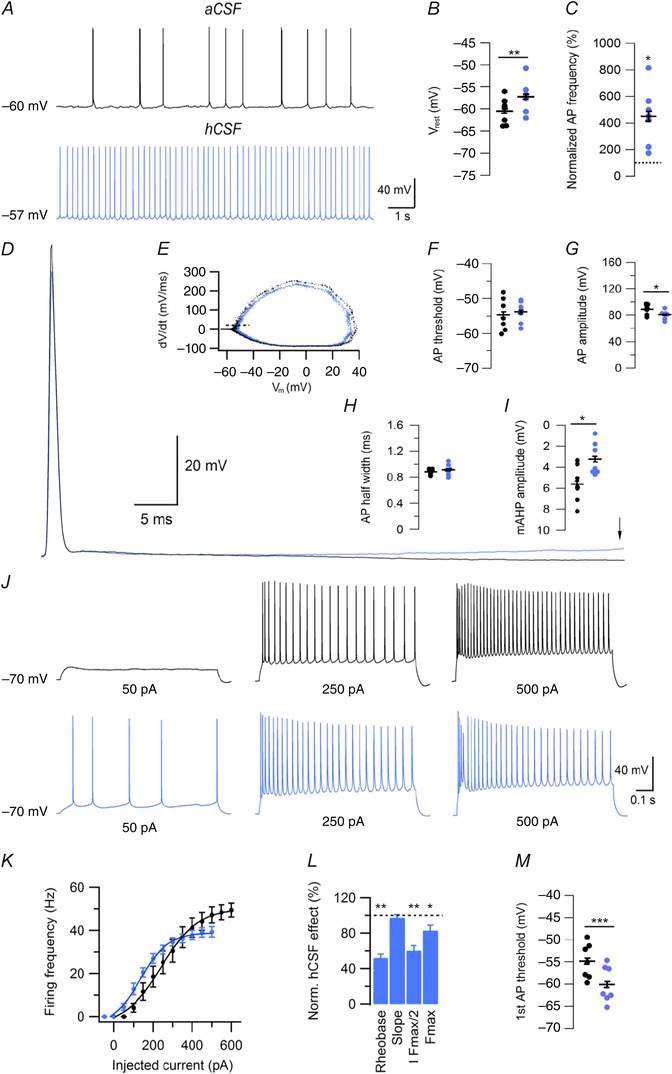
A, example traces of spontaneous firing in aCSF and hCSF (after 10 min), at V rest, in CA1 pyramidal cells. B, summary bar graph showing effect of hCSF on V rest. C, summary bar graph showing normalized effect of hCSF on spontaneous firing frequency at V rest. D, example of spontaneous AP waveform of CA1 pyramidal cells recorded in aCSF (black) and hCSF (blue). Arrow indicates point of mAHP amplitude measurement. E, representative phase‐plane plot constructed from spontaneous APs recorded over 60 s in aCSF (black) and hCSF (blue). F–I, summary graphs showing effect of hCSF on spontaneous AP threshold (F), amplitude (G), half width (H) and mAHP amplitude (I). J, example traces of CA1 pyramidal cell firing in response to depolarizing current at indicated magnitude in aCSF (black) and hCSF (blue). K, summary graph of frequency–current relationship in aCSF (black) and hCSF (blue). L, summary bar graph showing normalized effect of hCSF on rheobase, slope, I F max/2 and F max. M, summary bar graph showing threshold of first AP recorded in response to depolarizing current from –70 mV in aCSF and hCSF. Error bars represent SEM. *P < 0.05; **P < 0.01; ***P < 0.001.
hCSF increases spontaneous firing in FS and NFS interneurons
We first evaluated the effect of hCSF on spontaneous firing in FS and NFS interneurons. Interneurons showing a minimum frequency of 0.5 Hz at V rest (I = 0) were included in the assessment of hCSF effects on spontaneous firing. All of the FS interneurons examined fulfilled this criteria whereas approximately 50% of NFS interneurons were either silent or fired at less than 0.5 Hz. The average spontaneous firing frequency at V rest in FS and NFS interneurons was 20.8 ± 11.2 Hz and 4.7 ± 1.3 Hz at baseline (aCSF), respectively. hCSF had no significant effect on V rest itself in either FS (–55.1 ± 2.4 mV vs. –56.1 ± 3.1 mV, n = 8, P = 0.36, Student's paired t test, Fig. 2 A and B) or NFS (–60.9 ± 1.3 mV vs. –62.0 ± 1.4 mV, n = 8, P = 0.16, Student's paired t test, Fig. 2 D and E) interneurons. However, hCSF substantially increased spontaneous firing in both FS (to 273.3 ± 60.6%, n = 8, P = 0.008, Student's paired t test, Fig. 2 A and C) and NFS (to 232.6 ± 49.2%, n = 8, P = 0.02, Student's paired t test, Fig. 2 D and F) cells. In a subset of these experiments (4 out of 8 FS and 4 out of 8 NFS) hCSF was also washed out. These washout experiments indicated that the effect of hCSF on spontaneous firing was reversible (255.2 ± 61.2% reduced to 140.5 ± 21.5% after 10 min of washout, n = 8, P = 0.04, Student's paired t test). We also tested whether there was any difference between the hCSF obtained from healthy volunteers and normal pressure hydrocephalus patients. However, both sources of hCSF caused an increase in spontaneous firing of comparable magnitude (healthy volunteers: 243.4 ± 36.4%, n = 2 FS + 2 NFS, normal pressure hydrocephalus patients: 256.2 ± 50.1%, n = 6 FS + 6 NFS, P = 0.9, Student's unpaired paired t test).
Figure 2. hCSF increases spontaneous firing in FS and NFS interneurons .
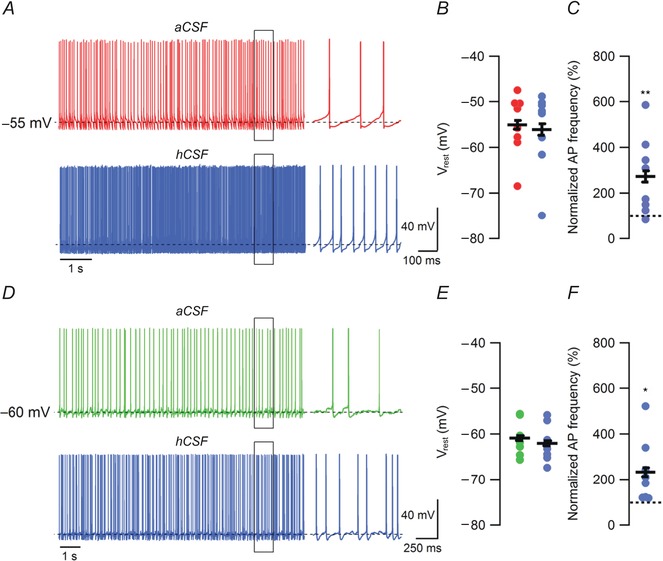
A, example traces of spontaneous firing in aCSF and hCSF (after 10 min), at V rest, in FS interneurons. APs expanded in time from highlighted area (black rectangle) are shown to the right. B, summary bar graph showing effect of hCSF on V rest in FS interneurons. C, summary bar graph showing normalized effect of hCSF on spontaneous firing frequency at V rest in FS interneurons. D, example traces of spontaneous firing in aCSF and hCSF (after 10 min), at V rest, in NFS interneurons. APs expanded in time from highlighted area (black rectangle) are shown to the right. E, summary bar graph showing effect of hCSF on V rest in NFS interneurons. F, summary bar graph showing normalized effect of hCSF on spontaneous firing frequency at V rest in NFS interneurons. Error bars represent SEM. *P < 0.05; **P < 0.01.
hCSF reduces after‐hyperpolarizing potentials of spontaneous APs in FS and NFS interneurons
To examine the mechanisms behind the increased spontaneous firing of FS and NFS interneurons, we analysed the effects of hCSF on several properties of spontaneous APs (Fig. 3). In the FS group, we found no significant effect of hCSF on either threshold (–47 ± 2 mV vs.–49.0 ± 3.1 mV, n = 8, P = 0.14, Student's paired t test, Fig. 3 B and C) or half width (0.46 ± 0.04 ms vs. 0.48 ± 0.04 ms, n = 8, P = 0.19, Student's paired t test, Fig. 3 A and E). AP amplitude was, however, reduced from 54.6 ± 2.9 mV to 50.8 ± 2.3 mV in hCSF (n = 8, P = 0.01, Student's paired t test, Fig. 3 A and D). We observed a significant reduction of the fast after‐hyperpolarization (fAHP) amplitude of spontaneous APs in hCSF (from 12 ± 1.1 mV to 10.2 ± 1 mV, n = 8, P = 0.009, Student's paired t test, Fig. 3 A and F), expected to contribute to the increased spontaneous firing of FS interneurons.
As for NFS interneurons, we found that hCSF lowered the AP threshold at V rest (–51.8 ± 1.6 mV vs. –55.2 ± 1.5 mV, n = 8, P = 0.009, Student's paired t test, Fig. 3 H and I) and increased the AP half width (0.76 ± 0.09 ms vs. 0.89 ± 0.09 ms, n = 8, P = 0.01, Student's paired t test, Fig. 3 G and K). hCSF also decreased AP amplitude in NFS interneurons from 73.2 ± 1.4 mV to 69 ± 1.5 mV (n = 8, P = 0.005, Student's paired t test, Fig. 3 G and J). We found no effect of hCSF on fAHP amplitude in NFS interneurons (8.6 ± 0.8 mV to 7.6 ± 0.6 mV, n = 8, P = 0.1, Student's paired t test, Fig. 3 G and L), but the lower firing frequency of NFS compared to FS interneurons allowed for quantification of a medium AHP (mAHP). We found that hCSF reduced the mAHP amplitude from 7.4 ± 0.8 mV to 3.8 ± 1.1 mV (n = 8, P = 0.009, Student's paired t test, Fig. 3 G and M).
These results show that hCSF reduces AHP amplitudes in both FS and NFS interneurons. This effect is likely to contribute to the increased spontaneous firing observed in both groups of interneurons, as it will allow the V m of these cells to reach threshold more rapidly. In NFS interneurons, an additional contribution may consist of a slightly lowered AP threshold.
Increased excitatory synaptic input onto FS and NFS interneurons in hCSF
We next examined whether hCSF had any effect on the frequency of spontaneous excitatory postsynaptic potentials (sEPSPs) onto FS and NFS interneurons, which could also contribute to their increased spontaneous firing in hCSF. We found that hCSF increased the sEPSP frequency in FS interneurons to 176.7 ± 18.6% (46.4 ± 9.1 Hz in aCSF, n = 8, P = 0.001, Student's paired t test, Fig. 4 A and B). In NFS interneurons, we found that hCSF caused a more modest increase in sEPSP frequency (to 127.5 ± 7.1%, 21.3 ± 7.4 Hz in aCSF, n = 8, P = 0.037, Student's paired t test, Fig. 4 C and D). Thus, an increased frequency of excitatory synaptic input onto these neurons, particularly in the case of FS interneurons, may, together with reduction of fast and medium AHP amplitudes, lead to the increased spontaneous firing observed in hCSF.
Figure 4. Increased frequency of spontaneous excitatory synaptic input onto FS and NFS interneurons in hCSF .
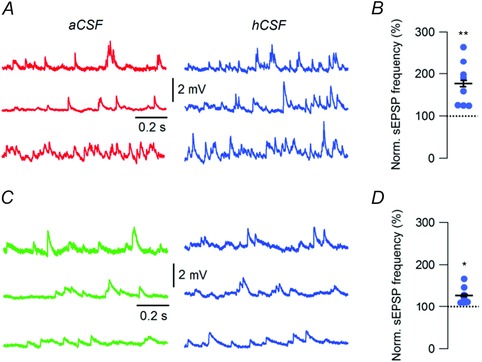
A, example traces of sEPSPs from three different FS interneurons recorded at –70 mV in aCSF and hCSF. B, summary bar graph showing normalized sEPSP frequency in aCSF and hCSF, for FS interneurons. C, example traces of sEPSPs from three different NFS interneurons recorded at –70 mV in aCSF and hCSF. D, summary bar graph showing normalized sEPSP frequency in aCSF and hCSF, for NFS interneurons. Error bars represent SEM. *P < 0.05; **P < 0.01.
hCSF alters the transfer function of FS and NFS interneurons
To examine whether hCSF affects the input–output function of FS and NFS interneurons, f–I curves were constructed from a series of depolarizing current pulses at 50 pA increments. In FS interneurons, hCSF reduced the rheobase to 65.2 ± 6.6% (n = 8, P = 0.0002, Student's paired t test, Fig. 5 A–C) and decreased the slope (gain) to 89.8 ± 4.4% (n = 8, P = 0.04, Student's paired t test, Fig. 5 B and C). hCSF also reduced the amount of injected current required to reach half of maximum firing frequency (I F max/2) to 84 ± 5.9% (n = 8, P = 0.017, Student's paired t test, Fig. 5 B and C) without significantly altering the maximum firing frequency (F max) (85.9 ± 11.6%, n = 8, P = 0.26, Student's paired t test, Fig. 5 B and C). We again measured AP threshold, this time at the minimum, but equal, amount of injected current required to evoke at least one AP in aCSF and hCSF (1st AP threshold). Here, hCSF significantly hyperpolarized the threshold from –47.9 ± 1.8 mV to –54.4 ± 2.9 mV, n = 8, P = 0.016, Student's paired t test, Fig. 5 D. No significant effect of hCSF on the R in of FS interneurons was observed (105.1 ± 6.4 MΩ vs. 112 ± 18.5 MΩ, n = 8, P = 0.7, Student's paired t test).
Figure 5. hCSF alters the input–output function of FS and NFS interneurons .
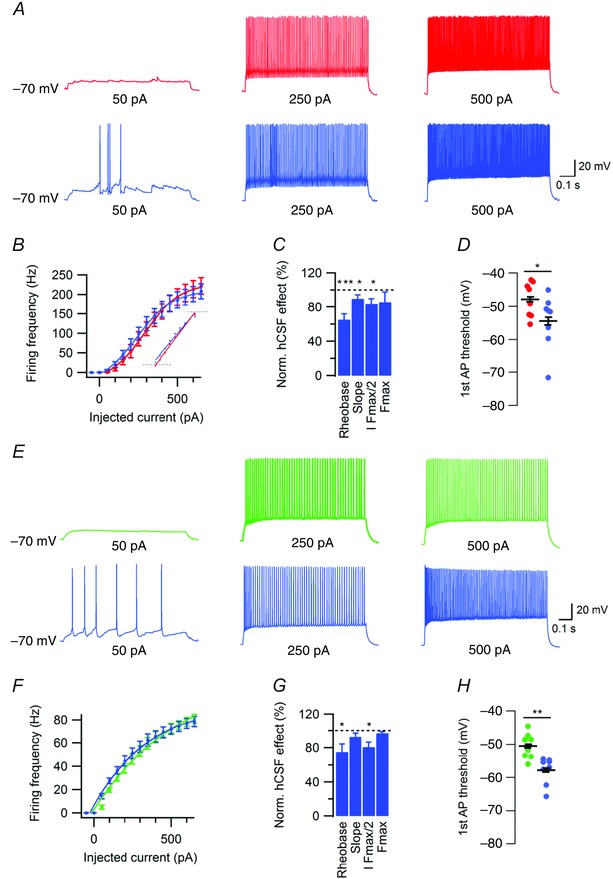
A, example traces of FS interneuron firing in response to depolarizing current at indicated magnitude in aCSF (red) and hCSF (blue). B, summary graph of frequency–current relationship in FS interneurons in aCSF (red) and hCSF (blue). Inset shows average slope (gain) in aCSF and hCSF. C, summary bar graph showing normalized effect of hCSF on rheobase, slope, I F max/2 and F max in FS interneurons. D, summary bar graph showing threshold of first AP recorded in response to depolarizing current from –70 mV in aCSF and hCSF. E, example traces of NFS interneuron firing in response to depolarizing current at indicated magnitude in aCSF (green) and hCSF (blue). F, summary graph of frequency–current relationship in NFS interneurons in aCSF (green) and hCSF (blue). G, summary bar graph showing normalized effect of hCSF on rheobase, slope, I F max/2 and F max in NFS interneurons. H, summary bar graph showing threshold of first AP recorded in response to depolarizing current from –70 mV in aCSF and hCSF. Error bars represent SEM. *P < 0.05; **P < 0.01; ***P < 0.001.
In NFS interneurons, hCSF also reduced rheobase (75 ± 9.4%, n = 8, P = 0.03, Student's paired t test, Fig. 5 E–G) but did not significantly affect the slope (92.7 ± 4.2%, n = 8, P = 0.16, Student's paired t test, Fig. 5 F and G). I F max/2 was reduced to 80.9 ± 5.7% (n = 8, P = 0.02, Student's paired t test, Fig. 5 F and G) while F max remained unaltered (97.1 ± 1.7%, n = 8, P = 0.13, Student's paired t test, Fig. 5 F and G). As in FS interneurons, hCSF caused a hyperpolarizing shift in the first AP threshold from –50.5 ± 1.4 to –57.8 ± 1.4 mV (n = 8, P = 0.001, Student's paired t test, Fig. 5 H). There was no significant effect of hCSF on the R in of NFS interneurons (179.2 ± 17.2 MΩ vs. 188.4 ± 26.5 MΩ, n = 8, P = 0.58, Student's paired t test).
In summary, hCSF caused a left‐shift of the input–output function of both FS and NFS interneurons, with an additional decrease in slope seen in FS interneurons. The left‐shift seen in f–I curves can probably be largely attributed to the effect of hCSF on AP threshold.
hCSF increases responsiveness of FS and NFS interneurons to theta and gamma frequency sinusoidal current stimulus
Given the inherent sensitivity of hippocampal neurons to synaptic input in the theta (4–10 Hz) and gamma (30–80 Hz) range, we next examined how hCSF affected the responsiveness of FS and NFS interneurons to sinusoidal current delivered at these frequencies. We found that FS interneurons in hCSF fired twice as many APs during each theta cycle at 5 Hz (194.4 ± 35%, n = 6, P = 0.005, Student's paired t test, Fig. 6 A and B). For gamma frequency stimulus (40 Hz) at equal amplitude, 1 out of 6 FS interneurons examined produced firing in aCSF, whereas 4 out of 6 cells fired during the gamma stimulus episode (3 s) in hCSF (n = 6, Fig. 6 C and D).
Figure 6. Increased responsiveness of FS and NFS interneurons to sinusoidal current stimulation at theta and gamma frequency in hCSF .
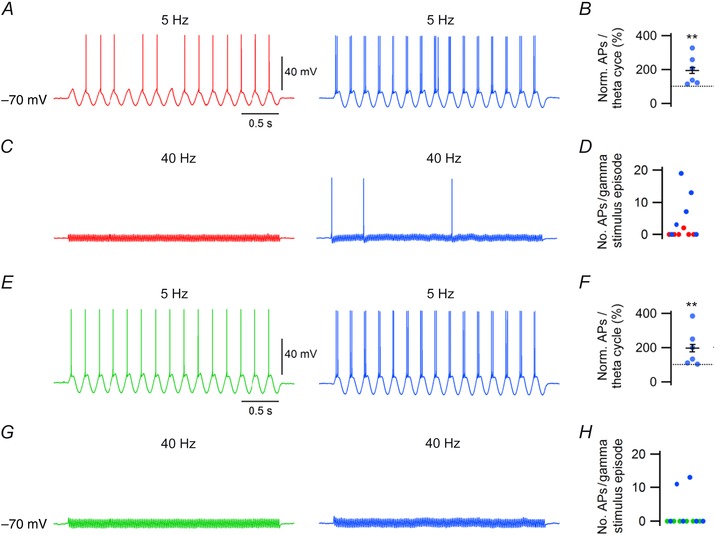
A, example traces of FS interneuron firing in response to 5 Hz sinusoidal current stimulation at –70 mV in aCSF (red) and hCSF (blue). B, summary bar graph showing normalized AP firing in response to each theta cycle in aCSF and hCSF. C, example traces of FS interneuron responses to 40 Hz sinusoidal current stimulation at –70 mV in aCSF (red) and hCSF (blue). D, graph showing number of APs fired by individual FS neurons during a 3 s gamma stimulus episode in aCSF and hCSF. E, example traces of NFS interneuron firing in response to 5 Hz sinusoidal current stimulation at –70 mV in aCSF (green) and hCSF (blue). F, summary bar graph showing normalized AP firing in response to each theta cycle in aCSF and hCSF. G, example traces of NFS interneuron responses to 40 Hz sinusoidal current stimulation at –70 mV in aCSF (green) and hCSF (blue). H, graph showing number of APs fired by individual NFS neurons during a 3 s gamma stimulus episode in aCSF and hCSF. Error bars represent SEM. **P < 0.01.
NFS interneurons also showed increased firing during each theta cycle in hCSF (197 ± 44.1%, n = 6, P = 0.008, Student's paired t test, Fig. 6 E and F). Similar to FS interneurons, none of the NFS cells examined reached suprathreshold depolarization at 40 Hz stimulation. In hCSF, 2 out of 6 NFS cells fired at 40 Hz (n = 6, Fig. 6 G and H).
Effects of hCSF on CA1 pyramidal cells
To allow for closer comparison of hCSF effects on FS, NFS and pyramidal cells we re‐examined the effects on CA1 pyramidal cells at the same recording temperature as used for interneurons in this study (32–34°C). We found that, in contrast to interneurons, but consistent with our previous study on pyramidal cells (Bjorefeldt et al. 2015), hCSF depolarized V rest (–60.5 ± 1.1 mV vs. –57.2 ± 1.4 mV, n = 7, P = 0.026, Student's paired t test, Fig. 7 A and B). hCSF also powerfully increased spontaneous firing in CA1 pyramidal cells (to 450 ± 81.5% from a frequency of 0.85 ± 0.13 Hz in aCSF, n = 7, P = 0.007, Student's paired t test, Fig. 7 A and C). Analysis of spontaneous AP properties at V rest showed no effect of hCSF on AP threshold (–54.6 ± 1.7 mV vs. –53.8 ± 1.2 mV, n = 7, P = 0.42, Student's paired t test, Fig. 7 E and F) or half width (0.88 ± 0.02 ms vs. 0.91 ± 0.03 ms, n = 7, P = 0.32, Student's paired t test, Fig. 7 D and H), but caused a decrease in AP amplitude (88.7 ± 2.9 mV vs. 80.6 ± 2.5 mV, n = 7, P = 0.03, Student's paired t test, Fig. 7 D and G). As in NFS interneurons, hCSF significantly reduced the mAHP amplitude in CA1 pyramidal cells (5.6 ± 0.7 mV vs. 3.2 ± 0.6 mV, n = 7, P = 0.019, Student's paired t test, Fig. 7 D and I). f–I curves showed that hCSF produced a clear left‐shift of the input–output function in CA1 pyramidal cells, with a decreased rheobase (52.1 ± 4.1%, n = 7, P = 0.003, Student's paired t test, Fig. 7 J–L), I F max/2 (60.5 ± 5.6%, n = 7, P = 0.004, Student's paired t test, Fig. 7 K and L) and F max (83.1 ± 6.0%, n = 7, P = 0.03, Student's paired t test, Fig. 7 K and L), but without affecting the slope (97.4 ± 3.3%, n = 7, P = 0.36, Student's paired t test, Fig. 7 K and L). hCSF caused a hyperpolarized shift in threshold of the first AP (from –54.9 ± 1.5 mV to –60.1 ± 1.6 mV, n = 7, P = 0.0002, Student's paired t test, Fig. 7 M), which probably contributed to the reduced rheobase. All these effects of hCSF on pyramidal cells at 32–34°C are consistent with our previous results at room temperature (Bjorefeldt et al. 2015). To ascertain that the increased excitability caused by the hCSF was unrelated to the whole‐cell configuration we also measured, at room temperature, spontaneous firing in the cell‐attached configuration before and after hCSF. In CA1 pyramidal cells hCSF increased the frequency of spontaneous action currents to 276 ± 72% (n = 6, P = 0.015, Student's paired t test) indicating that the hCSF‐induced increased excitability is present also when the intracellular environment is unperturbed. This is also consistent with our previous results showing that hCSF causes a pronounced increase of the fEPSP magnitude, and of spontaneous action potential‐dependent EPSCs (Bjorefeldt et al. 2015). We did, however, note one divergent result in the present study as compared to our previous findings at room temperature. That is, we did not observe a significant effect of hCSF on the R in of CA1 pyramidal cells (74.7 ± 4.3 MΩ vs. 72 ± 5.6 MΩ, n = 7, P = 0.41, Student's paired t test). Baseline R in values were, however, lower (approximately 25%) than those observed previously in recordings at room temperature (cf. Bjorefeldt et al. 2015). Finally, in three experiments sinusoidal current was injected at theta and gamma frequencies (as in Fig. 6). hCSF increased CA1 pyramidal cell firing per theta cycle (to 374 ± 155%, n = 3) and elicited firing in 2 out of 3 cells in response to gamma frequency stimulus (0 out of 3 cells fired in aCSF).
Discussion
By comparing hCSF with a matched aCSF we show that neuromodulatory factors specific for hCSF increase the excitability of FS and NFS hippocampal CA1 interneurons, two broad groups of GABAergic interneurons. We also verify previous results (Bjorefeldt et al. 2015) showing that hCSF strongly increases the excitability of CA1 pyramidal cells. hCSF increased the frequency of spontaneous firing more than twofold among the interneurons and more than fourfold among the pyramidal cells, suggesting that ambient concentrations of neuromodulators in the brain extracellular fluid powerfully control the excitability of neuronal networks.
The increase in spontaneous firing frequency was, in all three groups of neurons, accompanied by a reduction of AHP amplitude and a left‐shift in the input–output relationship. There were, however, some notable differences between the groups. Whereas pyramidal cells were depolarized, the V rest of FS and NFS interneurons was not significantly affected by the hCSF. One candidate neuromodulator in the hCSF, acetylcholine, is known to reliably depolarize hippocampal CA1 pyramidal cells through muscarinic acetylcholine receptor activation (Cole & Nicoll, 1984; Colino & Halliwell, 1993). On the other hand, effects of acetylcholine on CA1 interneurons are more heterogeneous, varying also between interneurons of the same morphological subtype (Widmer et al. 2006; McQuiston, 2014; Bell et al. 2015).
The reduction of AHP amplitudes in FS, NFS and pyramidal cells by hCSF probably contributed to increase the spontaneous firing frequency. Some of the main ionic currents known to regulate mAHPs in hippocampal neurons are carried by hyperpolarization‐activated cyclic nucleotide (HCN) channels (h‐current, I h), Ca2+‐activated potassium (SK) channels (I AHP), Kv7 channels (m‐current, I m) and non‐inactivating (persistent) sodium channels (I NaP) (Storm, 1989; Savic et al. 2001; Gu et al. 2005; Vervaeke et al. 2006). Several neuromodulators are known to act on these channels to modify neuronal firing behaviour. In pyramidal cells and NFS interneurons, the reduced mAHP amplitude is consistent with a reduction of I AHP and/or I m. I AHP is known to be negatively modulated by a number of neuromodulators, including serotonin, histamine, noradrenaline and acetylcholine (Haas & Konnerth, 1983; McCormick & Williamson, 1989). On the other hand, negative modulation of I m is mostly attributed to cholinergic activation of muscarinic receptors (Brown & Adams, 1980). In addition, a reduced mAHP might result from enhancement of an inward current such as I h. Positive modulation of I h has been described as a cholinergic effect (Colino & Halliwell, 1993; Fisahn et al. 2002). However, cholinergic effects also include enhancement of I NaP (Yamada‐Hanff & Bean, 2013), which can be expected to increase mAHP amplitude (Vervaeke et al. 2006). In the case of FS interneurons, the high spontaneous firing frequency may only allow partial activation of above‐mentioned currents, and modulation of other channels may thus contribute to the reduction in fAHP amplitude seen in hCSF.
We also found that hCSF lowered the AP threshold in both interneurons and pyramidal cells in experiments where depolarizing current was injected from –70 mV. However, during spontaneous firing at V rest, hCSF only lowered the AP threshold in NFS interneurons. One scenario consistent with this result is that hCSF increases an inward voltage‐dependent current more strongly activated at potentials negative to V rest (possibly I h), to contribute to a hyperpolarizing shift of the AP threshold. The fact that hCSF additionally lowered AP threshold in NFS interneurons during spontaneous firing could potentially be explained by the more hyperpolarized V rest of these cells, which may have allowed for stronger activation of this inward current. It is possible that a reduction of I m by hCSF could also explain the reduced firing threshold from hyperpolarized potentials. However, such a mechanism may have been expected to affect the AP threshold also at V rest (Shah et al. 2008).
The more potent excitatory effect of hCSF on pyramidal cells compared to that on interneurons suggests that recordings in conventional aCSF underestimate the excitation/inhibition relationship in the network. Indeed, in CA1 pyramidal cells, we previously found that hCSF markedly increased the frequency of spontaneous excitatory synaptic currents without significantly affecting the spontaneous inhibitory synaptic currents (Bjorefeldt et al. 2015). This result does not seem consistent with the present finding of an increased spontaneous firing frequency of FS and NFS interneurons in hCSF. This issue could be explored more closely, for example, by examining the effect of hCSF on evoked IPSCs. It is possible that hCSF contains neuromodulators that decrease the probability of AP‐dependent GABAergic release, thus counteracting an increased frequency of action potentials. Since GABAergic connections onto pyramidal cells are multi‐release site connections (Groc et al. 2003) such reduction of GABAergic release probability is expected to decrease the average amplitude of the sIPSCs. Consistent with this expectation we also observed in our previous study (Bjorefeldt et al. 2015) a significant depression of the sIPSC amplitude in the hCSF by about 20%. It is also important to note that spontaneous GABAergic input onto CA1 pyramidal cells may be dominated by action potential‐independent, miniature, IPSCs (Cossart et al. 2000), substantially masking effects on action‐potential dependent IPSCs. Finally, since we in the present study recorded from FS and NFS interneurons in the pyramidal cell layer, it is possible that other GABAergic interneurons, also contributing to spontaneous IPSC frequency in CA1 pyramidal cells, decrease their firing in hCSF.
Our re‐examination of hCSF effects on CA1 pyramidal cells at higher temperature (32–34°C) in this study showed good overall reproducibility of previous findings at room temperature (cf. Bjorefeldt et al. 2015). However, at room temperature there was a clear reduction in R in among CA1 pyramidal cells, an effect that we did not observe at higher temperatures in the present study. We also noted that the average R in in pyramidal cells was substantially lower at the higher temperature. This finding is consistent with previous results showing that R in decreases with increasing temperatures in a voltage‐independent manner (Thompson et al. 1985). One possibility is that the reduction in R in caused by hCSF at room temperature was due to positive modulation of temperature‐sensitive leak channels, and a reduced basal activity of these channels at higher temperatures may have masked an effect on R in.
An obvious limitation of this study is the fact that the identity of the active neuromodulators and their precise target receptors remain to be identified. Our previous characterization of the effect of hCSF on pyramidal cells (Bjorefeldt et al. 2015) indicated that the majority of active neuromodulators were small (<8 kDa) and acted via G‐protein coupled receptors to increase excitability. One interesting possibility is that the effects of hCSF on hippocampal neurons were caused by neuromodulators involved in the regulation of wakefulness. During active waking periods, the activity of neuromodulatory neurons in subcortical monoaminergic‐ and cholinergic nuclei result in widespread release of histamine, noradrenaline, serotonin, dopamine and acetylcholine in many brain areas (Saper et al. 2001). Their actions have been found to increase neuronal responsiveness to excitatory input (Metherate et al. 1988; Servan‐Schreiber et al. 1990; Brown et al. 2001), promote plasticity (Gu, 2002; Carcea & Froemke, 2013) and support network oscillations at theta and/or gamma frequencies (Fisahn et al. 1998; Hajós et al. 2008; Walling et al. 2011). These effects appear to be in line with either observed or predicted effects of hCSF. Since CSF was sampled from human subjects during a state of wakefulness (in absence of anaesthesia), the neuromodulatory composition of the samples could have been largely influenced by prior, and ongoing, activity in neuromodulatory neurons regulating wakefulness. The effects of hCSF on hippocampal neurons could thus be indicative of how neuromodulation in vivo directs neurons into an ‘on‐line’ information processing state. However, other types of neuromodulators, such as small neuropeptides, could potentially also be involved in the effects of hCSF.
The current findings of how hCSF modulates the activity of hippocampal interneurons and pyramidal cells have important implications at the network level. In the hippocampus, as well as other brain areas, FS interneurons are believed to play a prominent role in rhythmogenesis (Freund, 2003; Whittington & Traub, 2003). These cells are highly interconnected through chemical and electrical synapses, and also strongly innervate themselves via GABAergic autapses (Tamas et al. 1997; Bacci et al. 2003). Consequently, FS interneurons have a special ability to self‐synchronize their inhibitory output, creating distinct temporal windows during which pyramidal cells can fire as they recover from synaptic inhibition. The powerful excitation of pyramidal cells by hCSF can be expected to greatly improve the recruitment of FS interneurons. In this way, hCSF is likely to promote the generation of synchronized neuronal activity in the hippocampal network. Consistent with this prediction, we found that the hCSF‐induced increase in excitability of both interneurons and pyramidal cells was also significant during rhythmic stimuli at theta and gamma frequency range.
In conclusion, our results highlight the importance of ambient neuromodulation in shaping the neuronal activity observed in vivo. They further support the concept of volume transmission as a significant means of information transfer in the brain. Future efforts should aim to more closely examine likely candidates of this modulation, as well as further investigate the impact of hCSF on synchronized oscillatory network activity.
Additional information
Competing interests
None declared.
Author contributions
A.B. performed the experiments (all carried out at the Department of Physiology, Institute of Neuroscience and Physiology, University of Gothenburg, Sweden) and analysed the data. A.B. and E.H. designed experiments, interpreted data and wrote the article. P.W. and H.Z. supplied hCSF from patients and healthy volunteers and assisted in the preparation of the manuscript. All authors have approved the final version of the manuscript and agree to be accountable for all aspects of the work. All persons designated as authors qualify for authorship, and all those who qualify for authorship are listed.
Funding
This work was supported by the Swedish Research Council (K2013‐12600, K2010‐63P‐21562‐01‐4, K2011‐61X‐20401‐05‐6), ALF‐medel (Agreement concerning research and education of doctors, ALFGBG 136991/ALFGBG 144341), Swedish Brain Foundation (FO2011‐003), the Alzheimer's Foundation and the Wolfson Foundation.
References
- Agnati LF, Zoli M, Stromberg I & Fuxe K (1995). Intercellular communication in the brain: wiring versus volume transmission. Neuroscience 69, 711–726. [DOI] [PubMed] [Google Scholar]
- Andersson R, Johnston A & Fisahn A (2012). Dopamine D4 receptor activation increases hippocampal gamma oscillations by enhancing synchronization of fast‐spiking interneurons. PLoS One 7, e40906. [DOI] [PMC free article] [PubMed] [Google Scholar]
- Bacci A, Huguenard JR & Prince DA (2003). Functional autaptic neurotransmission in fast‐spiking interneurons: a novel form of feedback inhibition in the neocortex. J Neurosci 23, 859–866. [DOI] [PMC free article] [PubMed] [Google Scholar]
- Bacci A, Huguenard JR & Prince DA (2005). Modulation of neocortical interneurons: extrinsic influences and exercises in self‐control. Trends Neurosci 28, 602–610. [DOI] [PubMed] [Google Scholar]
- Bell LA, Bell KA & McQuiston AR (2015). Activation of muscarinic receptors by ACh release in hippocampal CA1 depolarizes VIP but has varying effects on parvalbumin‐expressing basket cells. J Physiol 593, 197–215. [DOI] [PMC free article] [PubMed] [Google Scholar]
- Bjorefeldt A, Andreasson U, Daborg J, Riebe I, Wasling P, Zetterberg H & Hanse E (2015). Human cerebrospinal fluid increases the excitability of pyramidal neurons in the in vitro brain slice. J Physiol 593, 231–243. [DOI] [PMC free article] [PubMed] [Google Scholar]
- Brown DA & Adams PR (1980). Muscarinic suppression of a novel voltage‐sensitive K+ current in a vertebrate neurone. Nature 283, 673–676. [DOI] [PubMed] [Google Scholar]
- Brown RE, Stevens DR & Haas HL (2001). The physiology of brain histamine. Prog Neurobiol 63, 637–672. [DOI] [PubMed] [Google Scholar]
- Buzsaki G, Geisler C, Henze DA & Wang XJ (2004). Interneuron diversity series: Circuit complexity and axon wiring economy of cortical interneurons. Trends Neurosci 27, 186–193. [DOI] [PubMed] [Google Scholar]
- Buzsaki G, Leung LW & Vanderwolf CH (1983). Cellular bases of hippocampal EEG in the behaving rat. Brain Res 287, 139–171. [DOI] [PubMed] [Google Scholar]
- Carcea I & Froemke RC (2013). Cortical plasticity, excitatory‐inhibitory balance, and sensory perception. Prog Brain Res 207, 65–90. [DOI] [PMC free article] [PubMed] [Google Scholar]
- Cobb SR, Buhl EH, Halasy K, Paulsen O & Somogyi P (1995). Synchronization of neuronal activity in hippocampus by individual GABAergic interneurons. Nature 378, 75–78. [DOI] [PubMed] [Google Scholar]
- Cole AE & Nicoll RA (1984). Characterization of a slow cholinergic post‐synaptic potential recorded in vitro from rat hippocampal pyramidal cells. J Physiol 352, 173–188. [DOI] [PMC free article] [PubMed] [Google Scholar]
- Colino A & Halliwell JV (1993). Carbachol potentiates Q current and activates a calcium‐dependent non‐specific conductance in rat hippocampus in vitro. Eur J Neurosci 5, 1198–1209. [DOI] [PubMed] [Google Scholar]
- Cossart R, Hirsch JC, Cannon RC, Dinoncourt C, Wheal HV, Ben‐Ari Y, Esclapez M & Bernard C (2000). Distribution of spontaneous currents along the somato‐dendritic axis of rat hippocampal CA1 pyramidal neurons. Neuroscience 99, 593–603. [DOI] [PubMed] [Google Scholar]
- Doischer D, Hosp JA, Yanagawa Y, Obata K, Jonas P, Vida I & Bartos M (2008). Postnatal differentiation of basket cells from slow to fast signaling devices. J Neurosci 28, 12956–12968. [DOI] [PMC free article] [PubMed] [Google Scholar]
- Fisahn A, Pike FG, Buhl EH & Paulsen O (1998). Cholinergic induction of network oscillations at 40 Hz in the hippocampus in vitro . Nature 394, 186–189. [DOI] [PubMed] [Google Scholar]
- Fisahn A, Yamada M, Duttaroy A, Gan JW, Deng CX, McBain CJ & Wess J (2002). Muscarinic induction of hippocampal gamma oscillations requires coupling of the M1 receptor to two mixed cation currents. Neuron 33, 615–624. [DOI] [PubMed] [Google Scholar]
- Freund TF (2003). Interneuron diversity series: Rhythm and mood in perisomatic inhibition. Trends Neurosci 26, 489–495. [DOI] [PubMed] [Google Scholar]
- Freund TF & Buzsaki G (1996). Interneurons of the hippocampus. Hippocampus 6, 347–470. [DOI] [PubMed] [Google Scholar]
- Gainetdinov RR, Premont RT, Bohn LM, Lefkowitz RJ & Caron MG (2004). Desensitization of G protein‐coupled receptors and neuronal functions. Annu Rev Neurosci 27, 107–144. [DOI] [PubMed] [Google Scholar]
- Gonzalez‐Burgos G, Krimer LS, Urban NN, Barrionuevo G & Lewis DA (2004). Synaptic efficacy during repetitive activation of excitatory inputs in primate dorsolateral prefrontal cortex. Cereb Cortex 14, 530–542. [DOI] [PubMed] [Google Scholar]
- Groc L, Gustafsson B & Hanse E (2003). Early establishment of multiple release site connectivity between interneurons and pyramidal neurons in the developing hippocampus. Eur J Neurosci 17, 1873–1880. [DOI] [PubMed] [Google Scholar]
- Gu N, Vervaeke K, Hu H & Storm JF (2005). Kv7/KCNQ/M and HCN/h, but not KCa2/SK channels, contribute to the somatic medium after‐hyperpolarization and excitability control in CA1 hippocampal pyramidal cells. J Physiol 566, 689–715. [DOI] [PMC free article] [PubMed] [Google Scholar]
- Gu Q (2002). Neuromodulatory transmitter systems in the cortex and their role in cortical plasticity. Neuroscience 111, 815–835. [DOI] [PubMed] [Google Scholar]
- Haas HL & Konnerth A (1983). Histamine and noradrenaline decrease calcium‐activated potassium conductance in hippocampal pyramidal cells. Nature 302, 432–434. [DOI] [PubMed] [Google Scholar]
- Hajós M, Siok CJ, Hoffmann WE, Li S & Kocsis B (2008). Modulation of hippocampal theta oscillation by histamine H3 receptors. J Pharmacol Exp Ther 324, 391–398. [DOI] [PubMed] [Google Scholar]
- Hille B (1992). G protein‐coupled mechanisms and nervous signaling. Neuron 9, 187–195. [DOI] [PubMed] [Google Scholar]
- Hu H, Gan J & Jonas P (2014). Interneurons. Fast‐spiking, parvalbumin+ GABAergic interneurons: from cellular design to microcircuit function. Science 345, 1255263. [DOI] [PubMed] [Google Scholar]
- Jackson I (1980). Significance and function of neuropeptides in cerebrospinal fluid In Neurobiology of Cerebrospinal Fluid 1, ed Wood JH, pp. 625–650. Plenum Press, New York. [Google Scholar]
- Joborn C, Hetta J, Niklasson F, Rastad J, Wide L, Agren H, Akerström G & Ljunghall S (1991). Cerebrospinal fluid calcium, parathyroid hormone, and monoamine and purine metabolites and the blood‐brain barrier function in primary hyperparathyroidism. Psychoneuroendocrinology 16, 311–322. [DOI] [PubMed] [Google Scholar]
- Kawaguchi Y & Kondo S (2002). Parvalbumin, somatostatin and cholecystokinin as chemical markers for specific GABAergic interneuron types in the rat frontal cortex. J Neurocytol 31, 277–287. [DOI] [PubMed] [Google Scholar]
- Klausberger T & Somogyi P (2008). Neuronal diversity and temporal dynamics: the unity of hippocampal circuit operations. Science 321, 53–57. [DOI] [PMC free article] [PubMed] [Google Scholar]
- LeBeau FE, El Manira A & Griller S (2005). Tuning the network: modulation of neuronal microcircuits in the spinal cord and hippocampus. Trends Neurosci 28, 552–561. [DOI] [PubMed] [Google Scholar]
- McCormick DA & Williamson A (1989). Convergence and divergence of neurotransmitter action in human cerebral cortex. Proc Natl Acad Sci USA 86, 8098–8102. [DOI] [PMC free article] [PubMed] [Google Scholar]
- McQuiston AR (2014). Acetylcholine release and inhibitory interneuron activity in hippocampal CA1. Front Synaptic Neurosci 6, 20. [DOI] [PMC free article] [PubMed] [Google Scholar]
- Mann EO, Radcliffe CA & Paulsen O (2005). Hippocampal gamma‐frequency oscillations: from interneurones to pyramidal cells, and back. J Physiol 562, 55–63. [DOI] [PMC free article] [PubMed] [Google Scholar]
- Markram H, Toledo‐Rodriguez M, Wang Y, Gupta A, Silberberg G & Wu C (2004). Interneurons of the neocortical inhibitory system. Nat Rev Neurosci 5, 793–807. [DOI] [PubMed] [Google Scholar]
- Metherate R, Tremblay N & Dykes RW (1988). The effects of acetylcholine on response properties of cat somatosensory cortical neurons. J Neurophysiol 59, 1231–1252. [DOI] [PubMed] [Google Scholar]
- Neher E (1992). Correction for liquid junction potentials in patch clamp experiments. Methods Enzymol 207, 123–131. [DOI] [PubMed] [Google Scholar]
- Pawelzik H, Hughes DI & Thomson AM (2002). Physiological and morphological diversity of immunocytochemically defined parvalbumin‐ and cholecystokinin‐positive interneurones in CA1 of the adult rat hippocampus. J Comp Neurol 443, 346–367. [DOI] [PubMed] [Google Scholar]
- Petilla Interneuron Nomenclature Group; Ascoli GA, Alonso‐Nanclares L, Anderson SA, Barrionuevo G, Benavides‐Piccione R, Burkhalter A, Buzsaki G, Cauli B, Defelipe J, Fairen A, Feldmeyer D, Fishell G, Fregnac Y, Freund TF, Gardner D, Gardner EP, Goldberg JH, Helmstaedter M, Hestrin S, Karube F, Kisvarday ZF, Lambolez B, Lewis DA, Marin O, Markram H, Munoz A, Packer A, Petersen CC, Rockland KS, Rossier J, Rudy B, Somogyi P, Staiger JF, Tamas G, Thomson AM, Toledo‐Rodriguez M, Wang Y, West DC & Yuste R (2008). Petilla terminology: nomenclature of features of GABAergic interneurons of the cerebral cortex. Nat Rev Neurosci 9, 557–568. [DOI] [PMC free article] [PubMed] [Google Scholar]
- Post RM, Rubinow DR, Kling MA, Berrettini W & Gold PW (1988). Neuroactive substances in cerebrospinal fluid. Normal and pathological regulatory mechanisms. Ann N Y Acad Sci 531, 15–28. [DOI] [PubMed] [Google Scholar]
- Saper CB, Chou TC & Scammell TE (2001). The sleep switch: hypothalamic control of sleep and wakefulness. Trends Neurosci 24, 726–731. [DOI] [PubMed] [Google Scholar]
- Savic N, Pedarzani P & Sciancalepore M (2001). Medium afterhyperpolarization and firing pattern modulation in interneurons of stratum radiatum in the CA3 hippocampal region. J Neurophysiol 85, 1986–1997. [DOI] [PubMed] [Google Scholar]
- Servan‐Schreiber D, Printz H & Cohen JD (1990). A network model of catecholamine effects: gain, signal‐to‐noise ratio, and behavior. Science 249, 892–895. [DOI] [PubMed] [Google Scholar]
- Shah MM, Migliore M, Valencia I, Cooper EC & Brown DA (2008). Functional significance of axonal Kv7 channels in hippocampal pyramidal neurons. Proc Natl Acad Sci USA 105, 7869–7874. [DOI] [PMC free article] [PubMed] [Google Scholar]
- Storm JF (1987). Action potential repolarization and a fast after‐hyperpolarization in rat hippocampal pyramidal cells. J Physiol 385, 733–759. [DOI] [PMC free article] [PubMed] [Google Scholar]
- Storm JF (1989). An after‐hyperpolarization of medium duration in rat hippocampal pyramidal cells. J Physiol 409, 171–190. [DOI] [PMC free article] [PubMed] [Google Scholar]
- Syková E & Vargová L (2008). Extrasynaptic transmission and the diffusion parameters of the extracellular space. Neurochem Int 52, 5–13. [DOI] [PubMed] [Google Scholar]
- Tamas G, Buhl EH & Somogyi P (1997). Massive autaptic self‐innervation of GABAergic neurons in cat visual cortex. J Neurosci 17, 6352–6364. [DOI] [PMC free article] [PubMed] [Google Scholar]
- Thompson SM, Masukawa LM & Prince DA (1985). Temperature dependence of intrinsic membrane properties and synaptic potentials in hippocampal CA1 neurons in vitro. J Neurosci 5, 817–824. [DOI] [PMC free article] [PubMed] [Google Scholar]
- Tricoire L, Pelkey KA, Erkkila BE, Jeffries BW, Yuan X & McBain CJ (2011). A blueprint for the spatiotemporal origins of mouse hippocampal interneuron diversity. J Neurosci 31, 10948–10970. [DOI] [PMC free article] [PubMed] [Google Scholar]
- Veening JG & Barendregt HP (2010). The regulation of brain states by neuroactive substances distributed via the cerebrospinal fluid; a review. Cerebrospinal Fluid Res 7, 1. [DOI] [PMC free article] [PubMed] [Google Scholar]
- Vervaeke K, Hu H, Graham LJ & Storm JF (2006). Contrasting effects of the persistent Na+ current on neuronal excitability and spike timing. Neuron 49, 257–270. [DOI] [PubMed] [Google Scholar]
- Vigh B, Manzano e Silva MJ, Frank CL, Vincze C, Czirok SJ, Szabo A, Lukats A & Szel A (2004). The system of cerebrospinal fluid‐contacting neurons. Its supposed role in the nonsynaptic signal transmission of the brain. Histol Histopathol 19, 607–628. [DOI] [PubMed] [Google Scholar]
- Walling SG, Brown RA, Milway JS, Earle AG & Harley CW (2011). Selective tuning of hippocampal oscillations by phasic locus coeruleus activation in awake male rats. Hippocampus 21, 1250–1262. [DOI] [PubMed] [Google Scholar]
- Whittington MA & Traub RD (2003). Interneuron diversity series: inhibitory interneurons and network oscillations in vitro. Trends Neurosci 26, 676–682. [DOI] [PubMed] [Google Scholar]
- Widmer H, Ferrigan L, Davies CH & Cobb SR (2006). Evoked slow muscarinic acetylcholinergic synaptic potentials in rat hippocampal interneurons. Hippocampus 16, 617–628. [DOI] [PubMed] [Google Scholar]
- Yamada‐Hanff J & Bean BP (2013). Persistent sodium current drives conditional pacemaking in CA1 pyramidal neurons under muscarinic stimulation. J Neurosci 33, 15011–15021. [DOI] [PMC free article] [PubMed] [Google Scholar]