

Abstract
Improvements in cognitive test scores upon repeated assessment due to practice effects (PEs) are well documented, but there is no empirical evidence on whether alternative specifications of PEs result in different estimated associations between exposure and rate of cognitive change. If alternative PE specifications produce different estimates of association between an exposure and rate of cognitive change, this would be a challenge for nearly all longitudinal research on determinants of cognitive aging. Using data from 3 cohort studies—the Three-City Study–Dijon (Dijon, France, 1999–2010), the Normative Aging Study (Greater Boston, Massachusetts, 1993–2007), and the Washington Heights-Inwood Community Aging Project (New York, New York, 1999–2012)—for 2 exposures (diabetes and depression) and 3 cognitive outcomes, we compared results from longitudinal models using alternative PE specifications: no PEs; use of an indicator for the first cognitive visit; number of prior testing occasions; and square root of the number of prior testing occasions. Alternative specifications led to large differences in the estimated rates of cognitive change but minimal differences in estimated associations of exposure with cognitive level or change. Based on model fit, using an indicator for the first visit was often (but not always) the preferred model. PE specification can lead to substantial differences in estimated rates of cognitive change, but in these diverse examples and study samples it did not substantively affect estimated associations of risk factors with change.
Keywords: aging, cognitive change, longitudinal research, practice effects
In longitudinal cohort studies of older adults, changes in neuropsychological test performance may arise from increased familiarity with the assessment tools in addition to changes in underlying cognitive function (1, 2). Such changes in cognitive performance due to practice from repeated assessments are termed “practice” or “retest” effects. They can be explained through many mechanisms, including reduced anxiety on successive testing occasions, episodic memory for test content—for example, words used in a word recall test (3, 4)—or greater procedural memory for test structure and rules. PEs may be equivalent in magnitude to several years of age-related decline, but in the opposite direction. Omitting PE specification can thus lead to incorrect estimates of the shape and pace of age-related cognitive change (5).
There are several approaches to analytically account for PEs, including ignoring them altogether. PEs may confer a one-time benefit or a jump up in performance between the first cognitive visit and subsequent visits. This conceptualization can be parameterized using a binary indicator for the first visit, an approach that is relatively common in epidemiologic studies (6–8). A related approach drops the first cognitive visit, but this strategy does not take advantage of all available data. Alternatively, test-takers may learn more on each testing occasion, hopping up to improve their performance with each successive visit. This could be parameterized by a term for number of prior tests (9, 10). However, measurement burst studies and learning curve models (11, 12) suggest a middle ground—that PEs are large and persistent but that the largest benefits occur at first exposure and diminishing returns accrue with subsequent visits (11, 12), analogous to diminishing skips after each point of contact with the water of a rock skipping across a lake. To account for this possibility, PEs could be represented as the square root of the number of prior testing occasions, reflecting progressively smaller improvements at successive visits (9, 13–15). Much empirical work on PEs occurs in neuropsychology, where PEs are of intrinsic interest (1, 4, 5, 13, 14, 16–20). Specification of PEs is also necessary in epidemiologic research on cognitive aging, but in most epidemiologic studies PEs are considered nuisance parameters, potentially biasing estimated associations between risk factors and rate of cognitive decline.
Despite recommendations based on theoretical work (14, 20–22), there is no agreement on how to empirically model PEs in studies where the main objective is to identify predictors or determinants of cognitive decline. Adequately accounting for PEs is challenging because there is no way to determine a priori the relative contributions of aging and PEs to the observed change. Differences in test performance between 2 successive visits may reflect a combination of practice and aging, regardless of whether this difference is net positive, zero, or negative. Further, in many studies, test intervals are constant across time. When the delay in retest spacing is identical for all study participants, PEs are collinear with aging, and separate effects are not identifiable without additional assumptions (21). If alternative PE specifications result in different estimates of association between exposure and rate of cognitive change, this will be a challenge for nearly all longitudinal research on the determinants of cognitive aging.
We examined the practical question of whether alternate specifications of PEs modify inferences on determinants of cognitive change. Our objectives were to compare 1) goodness of fit and 2) estimated associations of exposure with level and slope of cognitive performance across longitudinal models with different PE specifications. We analyzed data from 3 cohort studies: the Three-City Study–Dijon (3C-Dijon), the Normative Aging Study (NAS), and the Washington Heights-Inwood Community Aging Project (WHICAP). Based on our findings, we propose recommendations on handling PEs when the primary interest is in determinants of cognitive change. This work was undertaken by the Methods in Longitudinal Research on Dementia (MELODEM) initiative (23).
METHODS
Participants
The 3C-Dijon study enrolled 4,931 community-dwelling individuals who were aged ≥65 years and selected from the Dijon, France, electoral rolls between 1999 and 2001. Health-related data (including cognitive testing data) were collected during face-to-face interviews using standardized questionnaires at inclusion and approximately 2, 4, 7, and 10 years later (24). Our analyses included 4,768 enrollees of 3C-Dijon without dementia at baseline who completed ≥1 cognitive visits (unbalanced data), among whom 2,093 enrollees completed all 5 cognitive visits (balanced data).
The NAS is a longitudinal study of aging in men established by the US Veterans Administration (now the Department of Veterans Affairs) in the early 1960s (25). Participants have completed in-person visits with cognitive testing every 3–5 years since 1993 (26). We included persons with data on the relevant cognitive test and exposures among 1,121 men who completed ≥1 cognitive visits (unbalanced data) or the subset of up to 474 men who completed ≥3 cognitive visits (balanced data).
WHICAP is a community-based study of Medicare-eligible older adults recruited in New York City (27). We used data from 1,828 WHICAP participants recruited in 1999 without dementia at baseline who completed ≥1 cognitive visits (unbalanced data); 537 participants completed ≥4 cognitive visits (balanced data). Details of the WHICAP sampling strategies and recruitment outcomes have been previously reported (28, 29).
In primary analyses, we restricted samples to those participants who completed all repeated cognitive measurements (5 visits in 3C-Dijon, 4 visits in WHICAP, 3 visits in NAS) in order to have balanced data. This approach has advantages for understanding how specification of PEs influences estimates of associations between exposures and cognitive change, but it also entails a selected sample. In sensitivity analyses, we analyzed all available observations, allowing unbalanced data, recognizing that this introduces potential selective attrition bias (30).
Outcomes
Measures of verbal fluency and verbal episodic memory were chosen out of the available cognitive tests in each cohort because we expected that PEs would be present for memory tests and scores on these tests were approximately normally distributed, without floor or ceiling effects which could obscure PEs. We used 1 common cognitive outcome across cohorts, semantic verbal fluency (animal naming), as well as cohort-specific cognitive outcomes for memory. Verbal fluency is typically ascribed to executive functioning (31), to language (32), or to its own factor (33). We chose semantic verbal fluency because it is sensitive to PEs and has minimal ceiling effects. For 3C-Dijon, semantic fluency was assessed with the 30-second Isaac's Set Test (34). For NAS, we used 60-second semantic fluency for animals and immediate recall of a 10-word list. For WHICAP, we used 60-second semantic fluency for animals (35) and the Buschke Selective Reminding Test (36), which is scored as the sum of words recalled over the course of 6 trials from a 12-word list.
Predictors and covariates
We considered 2 dichotomous exposure variables: baseline diabetes and baseline depressive symptoms. They were chosen because of their importance in cognitive aging research and because we considered it plausible a priori that they would modify PEs.
In 3C-Dijon, diabetes at baseline was defined as self-reported history of diabetes, use of diabetes medication, or abnormal fasting glycemia (≥7 mmol/L). Depressive symptoms were assessed by means of the French Center for Epidemiologic Studies Depression Scale, with cutpoints at 17 for men and 23 for women, based on previous work (37).
WHICAP participants self-reported diabetes at baseline. Depressive symptoms were assessed using a 10-item Center for Epidemiologic Studies Depression Scale. The scale was scored using categorical factor analysis, and an optimal cutpoint on the resulting factor score was determined with receiver operating characteristic analysis in a subset of the sample using self-reported diagnosed depression (Diagnostic and Statistical Manual of Mental Disorders, Fourth Edition) as the criterion.
In the NAS, diabetes was defined on the basis of self-report or use of medication for diabetes at baseline. Depressive symptoms were assessed using the Brief Symptom Inventory Depression Scale (38), administered at or within 1 year of the baseline cognitive visit and with scores dichotomized as previously described (39).
All models adjusted for sex (except for NAS, which enrolled only men) and baseline age. We did not include additional covariates because our focus was on PEs rather than ruling out possible confounders.
Statistical analyses
We compared models with 4 alternative PE specifications: 1) no PEs; 2) an indicator variable for the first cognitive visit, coded so that coefficients were positive for a boost in performance after initial testing (e.g., 0, 1, 1, …, 1); 3) number of prior visits (e.g., 0, 1, 2, 3, …); and 4) square root of the number of prior visits (e.g., 0, 1, 1.4, 1.7, …). We fitted models with random intercepts and slopes, imposing no assumption about the correlation of the intercept and slope deviations (40). We present results using time since baseline as the time factor in the primary analyses (alternative specifications using current age are presented in Web Tables 1 and 2, available at http://aje.oxfordjournals.org/) adjusted for age at baseline (baseage) and sex. For example, one version of the system of equations with depression (dep) for the exposure that we considered is
| (1) |
| (2) |
| (3) |
Yij is the cognitive score for patient i (i = 1, …, N) on occasion j (j = 1, …, t), PEij represents the PE variable, timeij represents continuous years since baseline, and baseagei represents age at baseline, centered at 75 years. In this main-effects-only model, β2 estimates the effect of exposure on cognitive level. Next, we fitted a model with an interaction between time and exposure (e.g., β6(timeij) × (depi)) to estimate the effect of exposure on rate of cognitive change. We also evaluated interactions between PEs and exposure by adding a term—β7(PEij) × (depi)—using only the visit 1 indicator model (other parameterizations of PEs are highly collinear with the interaction between time and exposure). All models we examined invoked the assumption that PEs did not differ on the basis of time delay between successive visits.
We evaluated the significance of each PE specification using a Wald test on β3. We used the Akaike Information Criterion (AIC) to compare goodness of fit between the PE specifications in each analysis, since the models were not nested (41). A smaller AIC indicates better goodness of fit; however, there is no accepted test for differences (42). We then compared coefficient estimates for rate of cognitive change in the reference group and for associations of baseline depression or diabetes with cognitive level and cognitive change across alternative PEs specifications.
Statistical analyses were performed with R, version 3.1.0 (R Foundation for Statistical Computing, Vienna, Austria) (43), for the 3C-Dijon data. SAS, version 9.3 (SAS Institute, Inc., Cary, North Carolina), was used for the NAS data, and STATA MP, version 13.1 (StataCorp LP, College Station, Texas), was used for WHICAP.
RESULTS
Description of cohorts
Median follow-up times were similar across the cohorts (Table 1). Delays between visits were longer in the NAS (median, 3.7 years; interquartile range (IQR), 3.0–4.0) than in the 2 other cohort studies (medians of 2.4 years (IQR, 2.1–3.0) in WHICAP and 1.8 years (IQR, 1.7–2.2) in 3C-Dijon). In 3C-Dijon, the mean verbal fluency at visit 2 was higher than that at visit 1, and in NAS and WHICAP, differences between visits 2 and 1 were smaller than those between subsequent visits (Figure 1).
Table 1.
Characteristics of Participants (Balanced Data) From the Three-City Study–Dijon (Dijon, France, 1999–2010), the Normative Aging Study (Greater Boston, Massachusetts, 1993–2007), and the Washington Heights-Inwood Community Aging Project (New York City, New York, 1999–2012)
| Characteristic | 3C-Dijon (n = 2,093) |
NAS (n = 474)a |
WHICAP (n = 541) |
||||||
|---|---|---|---|---|---|---|---|---|---|
| Median (IQR) | No. | % | Median (IQR) | No. | % | Median (IQR) | No. | % | |
| Age at baseline, years | 72 (69–76) | 66 (62–71) | 74 (70–79) | ||||||
| Duration of follow-up, years | 8.6 (8.4–8.9) | 7.5 (6.1–9.0) | 8.1 (7.3–10.3) | ||||||
| No. of repeat visits included in primary analyses | 5 | N/A | 3 | N/A | 4 | N/A | |||
| Cognitive test score | |||||||||
| MMSE (at baseline)b | 28 (27–29) | 27 (26–28) | |||||||
| Semantic Fluency Testc | 14 (12–16) | 19 (16–22) | 14 (11–18) | ||||||
| Buschke Selective Reminding Test—total recall | 41 (33–47) | ||||||||
| 10-word list—immediate recall | 19 (17–22) | ||||||||
| Male sex | 735 | 35 | 474 | 100 | 153 | 28 | |||
| Diabetes at baseline | 151 | 7 | 23 | 5 | 73 | 13 | |||
| Depression at baseline | 240 | 12 | 36 | 11 | 168 | 31 | |||
Abbreviations: 3C-Dijon, Three-City Study–Dijon; IQR, interquartile range; MMSE, Mini-Mental State Examination; N/A, not applicable; NAS, Normative Aging Study; WHICAP, Washington Heights-Inwood Community Aging Project.
a Sample size differed by cognitive test in the NAS; sample size here corresponds to persons with information on diabetes and immediate recall of the 10-word list (the maximum sample size), with the exception of the frequency of depression, which refers to the 336 persons with information on depression and immediate recall of the 10-word list.
b The MMSE in the NAS has a maximum score of 29, as the question about county is omitted (counties have little political or geographical meaning in the Greater Boston area).
c 3C-Dijon used animal fluency for 30 seconds; WHICAP and NAS used animal fluency for 60 seconds.
Figure 1.
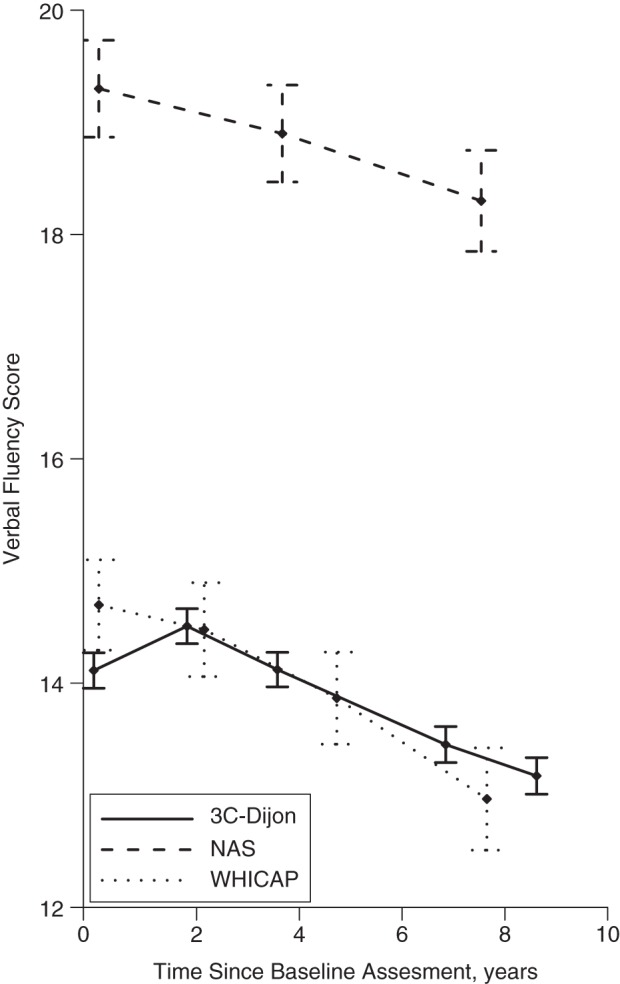
Mean values on tests of verbal fluency at each cognitive visit, by number of years elapsed since baseline, in the Three-City Study–Dijon (3C-Dijon) (Dijon, France, 1999–2010; 30-second animal naming), the Normative Aging Study (NAS) (Greater Boston, Massachusetts, 1993–2007; 60-second animal naming), and the Washington Heights-Inwood Community Aging Project (WHICAP) (New York, New York, 1999–2012; 60-second animal naming). Bars, 95% confidence intervals.
Influence of PE specifications on predicted values
Figure 2 shows predicted cognitive trajectories under the 4 alternative PE specifications, from 3C-Dijon data for males of mean age without baseline depression (reference group in equation 1). With no PEs included in the model specification, predicted trajectories were linear. A visit 1 indicator produced a trajectory shaped like an inverted check mark, with a “hop” between visits 1 and 2, followed by linear decline. Predicted baseline values from the visit 1 indicator model were lower than predictions from no PE specification; subsequent predicted values were generally higher. Similarly, the “hop” model also estimated a steeper slope of cognitive change. In a model including number of prior visits, the shape was piecewise, but predicted values were closer to those of the no-PEs model. Adjusting for the square root of the number of prior tests corresponds with the assumption of diminishing returns for repeated visits, so the “bump” associated with practice was smaller between visits 2 and 3 than between visits 1 and 2.
Figure 2.
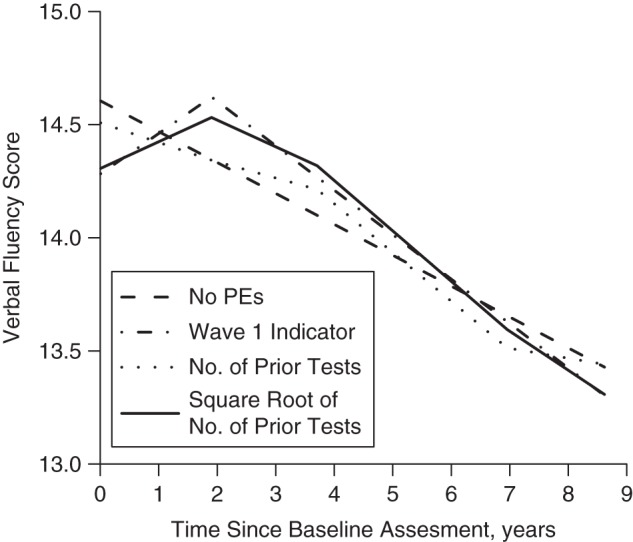
Predicted values on a test of verbal fluency (30-second animal naming) in the Three-City Study–Dijon (Dijon, France, 1999–2010), based on 4 alternative specifications of practice effects (PEs). Predictions are for the reference category of male sex, no depressive symptoms, mean age at baseline 74 years, and 5 follow-up visits with mean delays of 0, 1.8, 3.7, 6.9, and 8.6 years.
Influence of PE specifications on exposure-outcome association
The estimated associations of depression and diabetes with level of cognitive performance are shown in Tables 2 and 3, respectively. The time coefficients were sensitive to the choice of modeling PEs. For example, with no PE specification in 3C-Dijon (Table 3), the estimated rate of change in verbal fluency was −0.14 words/year. Adding an indicator for the first cognitive visit changed the estimated rate of change to −0.20 words/year, and the estimated PE was 0.72 words, equivalent to nearly 3.5 years of cognitive decline. Similar results were obtained for immediate recall in the NAS, with a change in the time coefficient from −0.08 to −0.15 and a PE coefficient of 0.57, equivalent to almost 4 years of change. The magnitude and statistical significance of the exposure parameters were similar regardless of the parameterization of PEs, however.
Table 2.
Associations Between Depression and Cognitive Change Obtained Using Different Specifications of Practice Effects (Balanced Data), With Years Elapsed Since Baseline as the Time Scale, in the Three-City Study–Dijon (Dijon, France, 1999–2010), the Normative Aging Study (Greater Boston, Massachusetts, 1993–2007), and the Washington Heights-Inwood Community Aging Project (New York City, New York, 1999–2012)
| Variable | Specification of Practice Effects |
|||||||||||||||
|---|---|---|---|---|---|---|---|---|---|---|---|---|---|---|---|---|
| No Practice Effects |
Visit 1 Indicator |
No. of Prior Tests |
Square Root of No. of Prior Tests |
|||||||||||||
| β | 95% CI | P Value | AIC | β | 95% CI | P Value | AIC | β | 95% CI | P Value | AIC | β | 95% CI | P Value | AIC | |
| Verbal Fluency in 3C-Dijon | ||||||||||||||||
| Depressiona | −0.56 | −0.94, −0.17 | 0.01 | 52,227.0 | −0.55 | −0.94, −0.17 | 0.01 | 52,136.0 | −0.55 | −0.94, −0.16 | 0.01 | 52,205.0 | −0.55 | −0.94, −0.16 | 0.01 | 52,146.0 |
| PEs | 0.72 | 0.58, 0.87 | <0.01 | 0.59 | 0.35, 0.82 | <0.01 | 0.80 | 0.63, 0.97 | <0.01 | |||||||
| Timeb | −0.14 | −0.15, −0.12 | <0.01 | −0.20 | −0.22, −0.18 | <0.01 | −0.40 | −0.50, −0.29 | <0.01 | −0.30 | −0.34, −0.26 | <0.01 | ||||
| Verbal Fluency in WHICAP | ||||||||||||||||
| Depression | −0.49 | −1.22, 0.23 | 0.18 | 12,007.5 | −0.49 | −1.22, 0.23 | 0.19 | 12,006.4 | −0.49 | −1.22, 0.24 | 0.19 | 12,008.0 | −0.49 | −1.22, 0.24 | 0.19 | 12,006.2 |
| PEs | 0.37 | −0.05, 0.79 | 0.08 | 0.39 | −0.24, 1.03 | 0.23 | 0.48 | −0.04, 1.00 | 0.07 | |||||||
| Time | −0.23 | −0.28, −0.18 | <0.01 | −0.27 | −0.34, −0.21 | <0.01 | −0.38 | −0.63, −0.13 | <0.01 | −0.33 | −0.45, −0.21 | <0.01 | ||||
| Verbal Fluency in NAS | ||||||||||||||||
| Depression | 0.11 | −1.21, 1.43 | 0.87 | 5,605.0 | 0.11 | −1.22, 1.43 | 0.87 | 5,606.7 | 0.13 | −1.19, 1.45 | 0.85 | 5,606.1 | 0.11 | −1.21, 1.43 | 0.87 | 5,607.0 |
| PEs | 0.21 | −0.53, 0.96 | 0.57 | −0.42 | −1.27, 0.43 | 0.33 | −0.01 | −0.92, 0.91 | 0.98 | |||||||
| Time | −0.14 | −0.2, −0.07 | <0.01 | −0.16 | −0.27, −0.05 | <0.01 | −0.03 | −0.25, 0.19 | 0.78 | −0.13 | −0.31, 0.04 | 0.13 | ||||
| Buschke Selective Reminding Test in WHICAP | ||||||||||||||||
| Depression | −0.93 | −2.53, 0.68 | 0.26 | 14,834.1 | −0.93 | −2.53, 0.68 | 0.26 | 14,836.0 | −0.93 | −2.53, 0.68 | 0.26 | 14,836.1 | −0.93 | −2.53, 0.68 | 0.26 | 14,836.0 |
| PEs | 0.12 | −0.69, 0.92 | 0.77 | 0.09 | −1.14, 1.32 | 0.88 | 0.09 | −0.90, 1.09 | 0.85 | |||||||
| Time | −0.50 | −0.59, −0.41 | <0.01 | −0.51 | −0.64, −0.38 | <0.01 | −0.54 | −1.01, −0.06 | 0.03 | −0.52 | −0.75, −0.29 | <0.01 | ||||
| Immediate Recall in NAS | ||||||||||||||||
| Depression | 0.03 | −1.04, 1.1 | 0.95 | 5,137.7 | 0.03 | −1.04, 1.10 | 0.96 | 5,137.9 | 0.03 | −1.04, 1.10 | 0.96 | 5,139.4 | 0.03 | −1.04, 1.10 | 0.96 | 5,138.2 |
| PEs | 0.37 | −0.17, 0.92 | 0.18 | 0.18 | −0.47, 0.84 | 0.58 | 0.43 | −0.26, 1.11 | 0.22 | |||||||
| Time | −0.06 | −0.11, −0.02 | <0.01 | −0.11 | −0.19, −0.03 | <0.01 | −0.11 | −0.28, 0.06 | 0.20 | −0.14 | −0.27, −0.01 | 0.03 | ||||
Abbreviations: AIC, Akaike Information Criterion; 3C-Dijon, Three-City Study–Dijon; CI, confidence interval; NAS, Normative Aging Study; PEs, practice effects; WHICAP, Washington Heights-Inwood Community Aging Project.
a Depression coefficients are for persons diagnosed with depression.
b Time coefficients are for 1 year of aging.
Table 3.
Associations Between Diabetes and Cognitive Change Obtained Using Different Specifications of Practice Effects (Balanced Data), With Years Elapsed Since Baseline as the Time Scale, in the Three-City Study–Dijon (Dijon, France, 1999–2010), the Normative Aging Study (Greater Boston, Massachusetts, 1993–2007), and the Washington Heights-Inwood Community Aging Project (New York City, New York, 1999–2012)
| Variable | Specification of Practice Effects |
|||||||||||||||
|---|---|---|---|---|---|---|---|---|---|---|---|---|---|---|---|---|
| No Practice Effects |
Visit 1 Indicator |
No. of Prior Tests |
Square Root of No. of Prior Tests |
|||||||||||||
| β | 95% CI | P Value | AIC | β | 95% CI | P Value | AIC | β | 95% CI | P Value | AIC | β | 95% CI | P Value | AIC | |
| Verbal Fluency in 3C-Dijon | ||||||||||||||||
| Diabetesa | −0.60 | −1.08, −0.12 | 0.02 | 52,229.0 | −0.60 | −1.08, −0.12 | 0.02 | 52,138.0 | −0.60 | −1.08, −0.12 | 0.02 | 52,207.0 | −0.60 | −1.08, −0.12 | 0.02 | 52,148.0 |
| PEs | 0.72 | 0.58, 0.87 | <0.01 | 0.59 | 0.35, 0.82 | <0.01 | 0.80 | 0.63, 0.97 | <0.01 | |||||||
| Timeb | −0.14 | −0.15, −0.12 | <0.01 | −0.20 | −0.22, −0.18 | <0.01 | −0.40 | −0.50, −0.29 | <0.01 | −0.30 | −0.34, −0.26 | <0.01 | ||||
| Verbal Fluency in WHICAP | ||||||||||||||||
| Diabetes | −0.89 | −1.87, 0.09 | 0.07 | 12,049.9 | −0.89 | −1.87, 0.09 | 0.07 | 12,048.6 | −0.88 | −1.87, 0.10 | 0.08 | 12,050.5 | −0.89 | −1.87, 0.09 | 0.08 | 12,048.4 |
| PEs | 0.39 | −0.03, 0.81 | 0.07 | 0.39 | −0.25, 1.03 | 0.23 | 0.49 | −0.02, 1.01 | 0.06 | |||||||
| Time | −0.23 | −0.28, −0.18 | <0.01 | −0.27 | −0.34, −0.21 | <0.01 | −0.38 | −0.63, −0.13 | <0.01 | −0.34 | −0.45, −0.22 | <0.01 | ||||
| Verbal Fluency in NAS | ||||||||||||||||
| Diabetes | −0.82 | −2.47, 0.83 | 0.33 | 7,876.7 | −0.82 | −2.47, 0.83 | 0.33 | 7,878.7 | −0.80 | −2.45, 0.84 | 0.34 | 7,878.0 | −0.81 | −2.46, 0.83 | 0.33 | 7,878.5 |
| PEs | 0.01 | −0.62, 0.63 | 0.99 | −0.30 | −0.99, 0.40 | 0.41 | −0.14 | −0.89, 0.61 | 0.72 | |||||||
| Time | −0.13 | −0.19, −0.08 | <0.01 | −0.13 | −0.23, −0.04 | <0.01 | −0.06 | −0.24, 0.12 | 0.50 | −0.11 | −0.25, 0.03 | 0.12 | ||||
| Buschke Selective Reminding Test in WHICAP | ||||||||||||||||
| Diabetes | −3.34 | −5.49, −1.19 | <0.01 | 14,885.5 | −3.34 | −5.49, −.19 | <0.01 | 14,887.5 | −3.34 | −5.49, −1.19 | <0.01 | 14,887.5 | −3.34 | −5.49, −1.19 | <0.01 | 14,887.5 |
| PEs | 0.08 | −0.72, 0.88 | 0.84 | 0.03 | −1.19, 1.26 | 0.96 | 0.04 | −0.95, 1.03 | 0.93 | |||||||
| Time | −0.51 | −0.60, −0.41 | <0.01 | −0.51 | −0.64, −0.39 | <0.01 | −0.52 | −0.99, −0.04 | 0.03 | −0.51 | −0.74, −0.28 | <0.01 | ||||
| Immediate Recall in NAS | ||||||||||||||||
| Diabetes | 0.48 | −0.84, 1.80 | 0.47 | 7,266.0 | 0.48 | −0.84, 1.79 | 0.48 | 7,261.7 | 0.47 | −0.84, 1.79 | 0.48 | 7,266.5 | 0.47 | −0.85, 1.79 | 0.49 | 7,262.6 |
| PEs | 0.57 | 0.13, 1.02 | 0.01 | 0.33 | −0.20, 0.85 | 0.22 | 0.65 | 0.10, 1.20 | 0.02 | |||||||
| Time | −0.08 | −0.12, −0.04 | <0.01 | −0.15 | −0.22, −0.08 | <0.01 | −0.16 | −0.30, −0.03 | 0.02 | −0.19 | −0.30, −0.09 | <0.01 | ||||
Abbreviations: AIC, Akaike Information Criterion; 3C-Dijon, Three-City Study–Dijon; CI, confidence interval; NAS, Normative Aging Study; PEs, practice effects; WHICAP, Washington Heights-Inwood Community Aging Project.
a Diabetes coefficients are for persons diagnosed with diabetes.
b Time coefficients are for 1 year of aging.
In models including interactions between exposures and time (see Table 4 for diabetes and Table 5 for depression), coefficients were sensitive to PE specification, while coefficients for the effect of exposure on level and slope (exposure ×time interactions) were similar in magnitude and statistical significance across alternative PE specifications. We observed this pattern in all 3 cohorts, for both exposures, and for all cognitive outcomes. Additionally, including terms for PEs had little effect on the width of the 95% confidence intervals for other terms in the models.
Table 4.
Associations Between Depression and Cognitive Change Obtained Using Different Specifications of Practice Effects (Balanced Data), With Years Elapsed Since Baseline as the Time Scale and Inclusion of a Main Exposure × Time Interaction, in the Three-City Study–Dijon (Dijon, France, 1999–2010), the Normative Aging Study (Greater Boston, Massachusetts, 1993–2007), and the Washington Heights-Inwood Community Aging Project (New York City, New York, 1999–2012)
| Variable | Specification of Practice Effects |
|||||||||||||||
|---|---|---|---|---|---|---|---|---|---|---|---|---|---|---|---|---|
| No Practice Effects |
Visit 1 Indicator |
No. of Prior Tests |
Square Root of No. of Prior Tests |
|||||||||||||
| β | 95% CI | P Value | AIC | β | 95% CI | P Value | AIC | β | 95% CI | P Value | AIC | β | 95% CI | P Value | AIC | |
| Verbal Fluency in 3C-Dijon | ||||||||||||||||
| Depressiona | −0.57 | −1.01, −0.14 | 0.01 | 52,229.0 | −0.57 | −1.01, −0.14 | 0.01 | 52,138.0 | −0.58 | −1.01, −0.14 | 0.01 | 52,207.0 | −0.58 | −1.01, −0.14 | 0.01 | 52,148.0 |
| Depression × time | 0.00 | −0.05, 0.05 | 0.87 | 0.00 | −0.05, 0.06 | 0.85 | 0.01 | −0.04, 0.06 | 0.82 | 0.01 | −0.05, 0.06 | 0.83 | ||||
| PEs | 0.72 | 0.58, 0.87 | <0.01 | 0.59 | 0.35, 0.82 | <0.01 | 0.80 | 0.63, 0.97 | <0.01 | |||||||
| Timeb | −0.14 | −0.15, −0.12 | <0.01 | −0.20 | −0.22, −0.18 | <0.01 | −0.40 | −0.50, −0.29 | <0.01 | −0.30 | −0.34, −0.26 | <0.01 | ||||
| Verbal Fluency in WHICAP | ||||||||||||||||
| Depression | −0.44 | −1.22, 0.34 | 0.27 | 12,009.3 | −0.44 | −1.22, 0.34 | 0.27 | 12,008.3 | −0.44 | −1.22, 0.34 | 0.27 | 12,009.9 | −0.44 | −1.22, 0.34 | 0.27 | 12,008.1 |
| Depression × time | −0.02 | −0.13, 0.08 | 0.70 | −0.02 | −0.13, 0.08 | 0.70 | −0.02 | −0.12, 0.09 | 0.71 | −0.02 | −0.12, 0.08 | 0.71 | ||||
| PEs | 0.37 | −0.05, 0.79 | 0.08 | 0.39 | −0.25, 1.03 | 0.23 | 0.48 | −0.04, 0.99 | 0.07 | |||||||
| Time | −0.23 | −0.28, −0.17 | <0.01 | −0.27 | −0.34, −0.19 | <0.01 | −0.37 | −0.62, −0.12 | <0.01 | −0.33 | −0.45, −0.20 | <0.01 | ||||
| Verbal Fluency in NAS | ||||||||||||||||
| Depression | 0.20 | −1.36, 1.76 | 0.80 | 5,607.0 | 0.21 | −1.35, 1.76 | 0.80 | 5,608.6 | 0.19 | −1.37, 1.75 | 0.81 | 5,608.1 | 0.20 | −1.36, 1.76 | 0.80 | 5,609.0 |
| Depression × time | −0.02 | −0.24, 0.20 | 0.83 | 0.03 | −0.25, 0.19 | 0.82 | −0.02 | −0.24, 0.2 | 0.89 | −0.02 | −0.24, 0.20 | 0.83 | ||||
| PEs | 0.22 | −0.53, 0.96 | 0.57 | −0.42 | −1.27, 0.44 | 0.34 | 0.00 | −0.92, 0.91 | 0.99 | |||||||
| Time | −0.13 | −0.2, −0.07 | <0.01 | −0.16 | −0.27, −0.05 | 0.01 | −0.03 | −0.25, 0.19 | 0.78 | −0.13 | −0.31, 0.04 | 0.13 | ||||
| Buschke Selective Reminding Test in WHICAP | ||||||||||||||||
| Depression | −1.19 | −2.92, 0.53 | 0.18 | 14,835.4 | −1.19 | −2.92, 0.54 | 0.18 | 14,837.3 | −1.19 | −2.92, 0.54 | 0.18 | 14,837.4 | −1.19 | −2.92, 0.54 | 0.18 | 14,837.8 |
| Depression × time | 0.08 | −0.12, 0.29 | 0.42 | 0.08 | −0.12, 0.29 | 0.42 | 0.08 | −0.12, 0.29 | 0.41 | 0.08 | −0.12, 0.29 | 0.42 | ||||
| PEs | 0.12 | −0.69, 0.92 | 0.77 | 0.10 | −1.13, 1.33 | 0.87 | 0.10 | −0.90, 1.09 | 0.85 | |||||||
| Time | −0.53 | −0.64, −0.41 | <0.01 | −0.54 | −0.68, −0.40 | <0.01 | −0.56 | −1.05, −0.08 | 0.02 | −0.55 | −0.78, −0.31 | <0.01 | ||||
| Immediate Recall in NAS | ||||||||||||||||
| Depression | 0.11 | −1.03, 1.26 | 0.84 | 5,139.6 | 0.12 | −1.02, 1.26 | 0.84 | 5,139.7 | 0.12 | −1.02, 1.26 | 0.84 | 5,141.2 | 0.12 | −1.02, 1.27 | 0.83 | 5,140.0 |
| Depression × time | −0.03 | −0.18, 0.12 | 0.69 | −0.04 | −0.19, 0.12 | 0.65 | −0.03 | −0.19, 0.12 | 0.66 | −0.04 | −0.19, 0.12 | 0.64 | ||||
| PEs | 0.38 | −0.17, 0.92 | 0.18 | 0.19 | −0.47, 0.85 | 0.56 | 0.44 | −0.25, 1.12 | 0.21 | |||||||
| Time | −0.06 | −0.11, −0.01 | 0.01 | −0.11 | −0.19, −0.03 | 0.01 | −0.11 | −0.28, 0.06 | 0.21 | −0.14 | −0.27, −0.01 | 0.04 | ||||
Abbreviations: AIC, Akaike Information Criterion; 3C-Dijon, Three-City Study–Dijon; CI, confidence interval; NAS, Normative Aging Study; PEs, practice effects; WHICAP, Washington Heights-Inwood Community Aging Project.
a Depression coefficients are for persons diagnosed with depression.
b Time coefficients are for 1 year of aging.
Table 5.
Associations Between Diabetes and Cognitive Change Obtained Using Different Specifications of Practice Effects (Balanced Data), With Years Elapsed Since Baseline as the Time Scale and Inclusion of a Main Exposure × Time Interaction, in the Three-City Study–Dijon (Dijon, France, 1999–2010), the Normative Aging Study (Greater Boston, Massachusetts, 1993–2007), and the Washington Heights-Inwood Community Aging Project (New York City, New York, 1999–2012)
| Variable | Specification of Practice Effects |
|||||||||||||||
|---|---|---|---|---|---|---|---|---|---|---|---|---|---|---|---|---|
| No Practice Effects |
Visit 1 Indicator |
No. of Prior Tests |
Square Root of No. of Prior Tests |
|||||||||||||
| β | 95% CI | P Value | AIC | β | 95% CI | P Value | AIC | β | 95% CI | P Value | AIC | β | 95% CI | P Value | AIC | |
| Verbal Fluency in 3C-Dijon | ||||||||||||||||
| Diabetesa | −0.51 | −1.05, 0.03 | 0.06 | 52,231.0 | −0.51 | −1.05, 0.02 | 0.06 | 52,139.0 | −0.51 | −1.05, 0.02 | 0.06 | 52,208.0 | −0.51 | −1.05, 0.02 | 0.06 | 52,150.0 |
| Diabetes × time | −0.02 | −0.09, 0.04 | 0.48 | −0.02 | −0.09, 0.04 | 0.48 | −0.02 | −0.09, 0.04 | 0.46 | −0.02 | −0.09, 0.04 | 0.47 | ||||
| PEs | 0.72 | 0.58, 0.87 | <0.01 | 0.59 | 0.36, 0.82 | <0.01 | 0.80 | 0.63, 0.97 | <0.01 | |||||||
| Timeb | −0.13 | −0.15, −0.12 | <0.01 | −0.19 | −0.22, −0.17 | <0.01 | −0.39 | −0.5, −0.29 | <0.01 | −0.30 | −0.34, −0.26 | <0.01 | ||||
| Verbal Fluency in WHICAP | ||||||||||||||||
| Diabetes | −0.81 | −1.85, 0.25 | 0.13 | 12,051.7 | −0.81 | −1.86, 0.24 | 0.13 | 12,050.4 | −0.81 | −1.86, 0.24 | 0.13 | 12,052.3 | −0.81 | −1.86, 0.24 | 0.13 | 12,050.2 |
| Diabetes × time | −0.03 | −0.17, 0.11 | 0.65 | −0.03 | −0.17, 0.11 | 0.66 | −0.03 | −0.17, 0.11 | 0.70 | −0.03 | −0.17, 0.11 | 0.69 | ||||
| PEs | 0.39 | −0.03, 0.80 | 0.07 | 0.38 | −0.25, 1.02 | 0.24 | 0.49 | −0.03, 1.01 | 0.06 | |||||||
| Time | −0.23 | −0.28, −0.17 | <0.01 | −0.27 | −0.34, −0.20 | <0.01 | −0.37 | −0.62, −0.12 | <0.01 | −0.33 | −0.45, −0.21 | <0.01 | ||||
| Verbal Fluency in NAS | ||||||||||||||||
| Diabetes | −1.65 | −3.58, 0.29 | 0.10 | 7,876.1 | −1.65 | −3.58, 0.29 | 0.10 | 7,878.1 | −1.66 | −3.59, 0.27 | 0.09 | 7,877.2 | −1.65 | −3.59, 0.28 | 0.09 | 7,877.9 |
| Diabetes × time | 0.22 | −0.05, 0.5 | 0.11 | 0.22 | −0.05, 0.50 | 0.11 | 0.23 | −0.04, 0.51 | 0.10 | 0.23 | −0.05, 0.50 | 0.11 | ||||
| PEs | −0.01 | −0.64, 0.62 | 0.98 | −0.34 | −1.03, 0.36 | 0.35 | −0.17 | −0.92, 0.58 | 0.66 | |||||||
| Time | −0.14 | −0.2, −0.09 | <0.01 | −0.14 | −0.23, −0.05 | <0.01 | −0.06 | −0.24, 0.12 | 0.50 | −0.11 | −0.25, 0.03 | 0.11 | ||||
| Buschke Selective Reminding Test in WHICAP | ||||||||||||||||
| Diabetes | −3.85 | −6.16, −1.54 | <0.01 | 14,886.1 | −3.85 | −6.16, −1.54 | <0.01 | 14,888.1 | −3.85 | −6.16, −1.54 | <0.01 | 14,888.1 | −3.85 | −6.16, −1.54 | <0.01 | 14,888.1 |
| Diabetes × time | 0.16 | −0.11, 0.43 | 0.24 | 0.16 | −0.11, 0.43 | 0.24 | 0.16 | −0.11, 0.44 | 0.24 | 0.16 | −0.11, 0.43 | 0.24 | ||||
| PEs | 0.08 | −0.72, 0.89 | 0.84 | 0.08 | −1.15, 1.31 | 0.90 | 0.06 | −0.94, 1.05 | 0.91 | |||||||
| Time | −0.53 | −0.63, −0.43 | <0.01 | −0.54 | −0.67, −0.40 | <0.01 | −0.56 | −1.04, −0.08 | 0.02 | −0.54 | −0.77, −0.31 | <0.01 | ||||
| Immediate Recall in NAS | ||||||||||||||||
| Diabetes | 0.45 | −0.96, 1.87 | 0.53 | 7,268.0 | 0.46 | −0.96, 1.88 | 0.52 | 7,263.7 | 0.46 | −0.95, 1.88 | 0.52 | 7,268.5 | 0.47 | −0.95, 1.89 | 0.52 | 7,264.6 |
| Diabetes × time | 0.01 | −0.18, 0.20 | 0.91 | 0.00 | −0.19, 0.19 | 0.96 | 0.00 | −0.19, 0.19 | 0.97 | 0.00 | −0.19, 0.19 | 1.00 | ||||
| PEs | 0.57 | 0.13, 1.02 | 0.01 | 0.33 | −0.20, 0.85 | 0.23 | 0.65 | 0.10, 1.20 | 0.02 | |||||||
| Time | −0.08 | −0.12, −0.04 | <0.01 | −0.15 | −0.22, −0.09 | <0.01 | −0.16 | −0.30, −0.03 | 0.02 | −0.19 | −0.30, −0.09 | <0.01 | ||||
Abbreviations: AIC, Akaike Information Criterion; 3C-Dijon, Three-City Study–Dijon; CI, confidence interval; NAS, Normative Aging Study; PEs, practice effects; WHICAP, Washington Heights-Inwood Community Aging Project.
a Diabetes coefficients are for persons diagnosed with diabetes.
b Time coefficients are for 1 year of aging.
Influence of PE specifications on model fit
Among the 10 exposure-outcome combinations evaluated, we found no evidence of PEs in 7 situations (considering all 3 PE specifications (Tables 2 and 3)). Among the 3 combinations with apparent PEs, the visit 1 indicator performed best according to the AIC, although the specification including the square root of number of prior tests generally had a similar goodness of fit (Tables 2–5).
Sensitivity analyses
Web Tables 1 and 2 display results from sensitivity analyses (analogous to Tables 4 and 5) using age as the time scale. Web Table 3 displays results from sensitivity analyses (analogous to Table 5) with unbalanced data, where all persons who made at least 1 cognitive visit were eligible for inclusion. In all sensitivity analyses, inferences concurred with those from the primary analyses. In Web Tables 4 and 5, we included interactions between the PE variable and exposure (e.g., β7(PEij) × (exposurei)); these interaction terms were nonsignificant in all analyses.
DISCUSSION
Across 3 cohorts representing different samples of older adults and multiple cognitive assessments, PEs were often large in magnitude compared with the average rate of cognitive change. Alternative specifications for PEs resulted in substantial differences in the estimated average rate of cognitive change. However, estimates of the associations of diabetes and elevated depressive symptoms with level of and change in cognitive performance were generally not sensitive to the specification of PEs. For no combination of cohort, cognitive test, and PE specification did we find evidence that either diabetes or depressive symptoms modified the magnitude of the PEs.
Our findings suggest that the importance of PEs likely depends on the substantive question of interest. When the substantive question relates to average rate of cognitive change, as is typical in neuropsychology, correct specification of the PEs is critical (5, 21). In contrast, for a substantive question regarding associations of exposures with rates of change, as is typical in epidemiology, findings may be more robust to misspecification of PEs. This is reassuring since, based on our experience, PEs are ignored in most studies of determinants or predictors of cognitive change.
This optimistic interpretation should be tempered, however, given the boundaries of the situations we examined. We only assessed 2 dichotomized baseline exposures, a handful of cognitive tests, and linear cognitive declines in 3 cohorts. PEs may behave differently in other settings. For example, if PEs differ by age at study entry and age is associated with exposure, modest misspecifications of the age trajectory might conflate PEs with exposure effects. We used only a few cognitive outcomes, related to episodic memory and verbal fluency, for purposes of feasibility across the 3 cohorts and to avoid cognitive tests with strong ceiling or floor effects, which potentially obscure PEs. Restriction to this set of cognitive abilities may limit the interpretation of our findings. Moreover, although we chose baseline diabetes and depression as exposures because of the plausibility that they may modify the magnitude of PEs (especially for depression, based on its effect on motivational effort, which is undoubtedly important to PEs), we detected minimal evidence of such interactions in our studies. If such interactions were omitted from the model, they might bias the estimated exposure × time interaction, although such bias would probably attenuate with increasing numbers of study visits. Similarly, we had very weak time × exposure interactions for both exposures. We cannot necessarily generalize beyond the examples we considered here, especially for time-varying exposures.
PEs enduring for as long as 13 years have been reported (44), but short study intervals probably have larger PEs than longer intervals (16), as suggested by the differences observed between 3C-Dijon and WHICAP or NAS. With a longer duration of follow-up and irregular visit schedules between people, it is easier to disentangle PEs from aging. Secular, period-specific, or visit-specific events such as hiring of new test administrators, changing of the sequencing of items in long testing periods, or changing interview mode (e.g., computerization) may result in complex longitudinal patterns that are not attributable to cognitive aging. These phenomena may masquerade as PEs, and they are subject to the same modeling challenges posed here. More conclusive evidence might emerge from simulation studies, which offer better opportunities to examine whether results accurately reflect the known model generating the data under a range of alternative (mis-)specifications of PEs.
Our specifications of PEs ignored possible differences in the magnitude of PEs based on the interval between successive visits (17). Testing such a model is infeasible when the time between cognitive visits is relatively constant (i.e., the study is time-structured); we defer additional research on this topic to a more appropriate setting. Similarly, in a hypothetical time-structured and balanced study in which measurements are evenly spaced, PEs specified as number of prior tests would be perfectly collinear with time. Thus, having data collected in a regular fashion actually limits investigators in the choice of PE specification. Nonetheless, as Hoffman et al. (21) noted, a visit 1 indicator is less collinear with time than incremental PE specifications and thus may facilitate identification of PEs in cohort studies with fixed test-retest intervals. Additional work beyond the scope of this study is needed to evaluate questions related to modeling of PEs when they are themselves of interest (18, 19, 21, 45). These questions are important, especially because prior evidence suggests that persons with cognitive impairment or incipient dementia have attenuated PEs (18, 19, 46). Our approach, however, aimed at answering the pragmatic question of the importance of correctly specifying PEs when evaluating predictors of rate of cognitive change, which is the typical interest in epidemiologic research on the determinants of cognitive decline.
We recommend considering parameterization of PEs when evaluating predictors of cognitive change. When not specifically modeled, PEs are “absorbed” into the time coefficient. This implies not only that average rate of change is incorrectly estimated but also that any comparisons of other coefficients based on the time coefficient are similarly biased. Such comparisons are common: The magnitude of the effect of an exposure of interest on rate of change is often interpreted in a ratio with the estimated annual rate of change. These ratios will be extremely sensitive to changes in the time coefficient and therefore sensitive to specification of PEs. For example, for 3C-Dijon in Table 5, a model with no PE included indicated that persons with diabetes declined 15% more quickly than nondiabetics, whereas when a visit 1 indicator was included, the estimate showed an 11% faster decline, and when the number of prior tests was included, the estimate implied only a 5% faster decline.
Importantly, although incorporating PE specification required an extra model parameter, it did not substantially increase the width of the 95% confidence intervals of other estimates and was often associated with lower AICs than those for models without PEs. We anticipated that there might be a single best-performing PEs specification that would be preferred across cohorts and tests. This was not the case. In our data, when PEs were statistically significant, the visit 1 indicator typically appeared to be the best option. However, the best PE specification is likely to depend on the characteristics of the study and test, potentially modified by length of the interval between visits, and other factors.
Given that we are not able to recommend a single universal specification for PEs, we recommend the following 4 steps to applied researchers when choosing a PE specification in linear models of cognitive change when substantive interest is in the association of exposure with rate of cognitive change.
First, choose an overall PE structure by comparing the 4 models, without any exposure coefficient (i.e., including only time and the alternative PE specifications). It may be useful to repeat this process considering nonlinear trajectories (47, 48), especially when numerous repeated measures are available. The presence of PEs can be tested by means of the Wald test associated with the PE variable. In the case of the presence of PEs, the best specification can be selected through goodness-of-fit criteria such as the AIC. However, one should keep in mind that small improvements in model fit (a few points) may not outweigh advantages of a more parsimonious and more interpretable model. In the absence of evidence to strongly support one PE specification over another in a given analysis, we recommend choosing a PE specification on theoretical grounds. For example, one could use previous evidence from measurement burst design studies regarding the shape of the PEs for the specific instrument.
Second, after choosing the preferred PE specification, model a 2-way interaction to assess whether the exposure of interest modifies the PEs. This model should include both the exposure × PEs interaction and the exposure × time interaction. We used only the visit 1 indicator model for PEs, since we found this interaction variable and the exposure ×time interaction variable to be highly correlated, causing problems with collinearity.
Third, if there is no evidence for an exposure × PEs interaction, drop this term.
Fourth, if there is an exposure × PEs interaction, further investigation is required, as there are multiple potential reasons for this finding. Although it is difficult to disentangle aging and PEs, exposure × PE interactions may indicate floor or ceiling effects, in which case alternate modeling techniques may be more appropriate (49–52). Alternately, especially in smaller data sets, significant PE × exposure interactions may indicate overfitting or unstable models. In this case, sensitivity analyses may help place bounds on the consequences of any PE × exposure interaction on the coefficients of interest. For example, investigators may repeat analyses omitting the PE, as well as further analyses which make other reasonable assumptions about the size and variability of the PE across exposures. Finally, PEs may truly differ by exposure status (5, 53, 54); in this case, it may be reasonable to retain this interaction in the final model, along with the exposure × time interaction, and critically consider plausible explanations for the finding based on theory.
Our findings have 3 implications for researchers dealing with PEs in studies of determinants of cognitive change. First, by formally comparing substantive effect estimates across diverse samples, exposures, and outcomes, we found limited effects of PEs on estimated rates of cognitive change. We then distinguished the importance of PE specification when the primary scientific interest is in describing rates of change (in which case different PE specifications lead to very different estimates) from the importance of PE specification when the primary scientific interest is in evaluating whether hypothesized risk factors modify cognitive level and rate of change (in which case different PE specifications may lead to similar results). Finally, we offered a sequence of steps to approach the choice of PE specification methodically.
By comparing 4 ways of handling PEs in 3 cohorts for 2 different exposures, we have demonstrated that the best way of modeling PEs—even when using the same cognitive instrument—may not be the same for all studies and situations. All statistical models are to some extent inaccurate simplifications of complex data patterns; a key task facing researchers is to select simplifying models that make analyses tractable but do not bias the estimate of primary scientific interest. We conclude that PEs are common in longitudinal studies. Ignoring PEs is likely to result in misspecification of the rate of cognitive change, but it does not necessarily produce incorrect estimates of the associations between exposures and level of cognition or rate of cognitive change. Nonetheless, explicitly modeling PEs could improve studies of cognitive change, by improving model fit and providing more realistic estimates of rate of cognitive change.
Supplementary Material
ACKNOWLEDGMENTS
Author affiliations: Institut National de la Santé et de la Recherche Médicale (INSERM), INSERM U1219, Bordeaux, France (Alexandre Vivot, Cécile Proust-Lima, Carole Dufouil); University of Bordeaux, Bordeaux, France (Alexandre Vivot, Cécile Proust-Lima, Carole Dufouil); Department of Social and Behavioural Sciences, Harvard T.H. Chan School of Public Health, Harvard University, Boston, Massachusetts (Alexandre Vivot, M. Maria Glymour); Department of Epidemiology, Bloomberg School of Public Health, Johns Hopkins University, Baltimore, Maryland (Melinda C. Power, Alden L. Gross); Departments of Epidemiology and Biostatistics, University of California, San Francisco, San Francisco, California (M. Maria Glymour, Elizabeth R. Mayeda); Department of Radiology and Radiological Sciences, Center for Biomedical Imaging, Medical University of South Carolina, Charleston, South Carolina (Andreana Benitez); Veterans Affairs Boston Healthcare System, Boston, Massachusetts (Avron Spiro); Department of Epidemiology, School of Public Health, and Department of Psychiatry, School of Medicine, Boston University, Boston, Massachusetts (Avron Spiro); and Taub Institute for Research on Alzheimer's Disease and the Aging Brain, Department of Neurology, and the Gertrude H. Sergievsky Center, College of Physicians and Surgeons, Columbia University, New York, New York (Jennifer J. Manly).
A.S. was supported by a Senior Research Career Scientist award from the Clinical Sciences Research and Development Service, US Department of Veterans Affairs. M.C.P. was supported by the National Institute of Aging, US National Institutes of Health (grant T32 AG027668). A.L.G. was supported by the National Institute of Aging (R03 AG045494-01). A.B. was supported by the National Center for Advancing Translational Sciences, US National Institutes of Health (grants UL1 TR000062 and KL2 TR000060).
The Three-City Study (Étude des Trois Cités) is conducted under a partnership agreement between the Institut National de la Santé et de la Recherche Médicale (INSERM), Victor Segalen–Bordeaux II University, and Sanofi-Synthélabo, Inc. (New York, New York). The Fondation pour la Recherche Médicale funded the preparation and initiation of the study. The Three-City Study is also supported by the Caisse Nationale Maladie des Travailleurs Salariés, the Direction Générale de la Santé, the Haute Autorité de la Santé, the Institut National de Prévention et d'Education pour la Santé, the Conseils Régionaux de Bourgogne, the Fondation de France, the Ministry of Research–INSERM Program “Cohortes et Collections de Données Biologiques,” the Mutuelle Générale de l'Education Nationale, the Institut de la Longévité, and the Conseil Général de la Côte d'Or. The Washington Heights-Inwood Community Aging Project (WHICAP) is supported by the US National Institutes of Health (grant R01 AG037212 to Dr. Richard Mayeux, WHICAP Principal Investigator). The Normative Aging Study is supported by the Cooperative Studies Program/Epidemiology Research and Information Center, US Department of Veterans Affairs, and is a research component of the Massachusetts Veterans Epidemiology Research and Information Center.
The study funders and sponsors had no role in the design and conduct of the study; the collection, management, analysis, or interpretation of the data; or the preparation, review, or approval of the manuscript.
The views expressed in this paper are those of the authors and do not necessarily represent the views of the US Department of Veterans Affairs.
Conflict of interest: none declared.
REFERENCES
- 1.Rabbitt P, Diggle P, Holland F et al. . Practice and drop-out effects during a 17-year longitudinal study of cognitive aging. J Gerontol B Psychol Sci Soc Sci. 2004;592:P84–P97. [DOI] [PubMed] [Google Scholar]
- 2.Zehnder AE, Bläsi S, Berres M et al. . Lack of practice effects on neuropsychological tests as early cognitive markers of Alzheimer disease? Am J Alzheimers Dis Other Demen. 2007;225:416–426. [DOI] [PMC free article] [PubMed] [Google Scholar]
- 3.McCaffrey RJ, Westervelt HJ. Issues associated with repeated neuropsychological assessments. Neuropsychol Rev. 1995;53:203–221. [DOI] [PubMed] [Google Scholar]
- 4.Salthouse TA, Schroeder DH, Ferrer E. Estimating retest effects in longitudinal assessments of cognitive functioning in adults between 18 and 60 years of age. Dev Psychol. 2004;405:813–822. [DOI] [PubMed] [Google Scholar]
- 5.Rabbitt P, Diggle P, Smith D et al. . Identifying and separating the effects of practice and of cognitive ageing during a large longitudinal study of elderly community residents. Neuropsychologia. 2001;395:532–543. [DOI] [PubMed] [Google Scholar]
- 6.Gross AL, Rebok GW, Brandt J et al. . Modeling learning and memory using verbal learning tests: results from ACTIVE. J Gerontol B Psychol Sci Soc Sci. 2013;682:153–167. [DOI] [PMC free article] [PubMed] [Google Scholar]
- 7.Jacqmin-Gadda H, Fabrigoule C, Commenges D et al. . A 5-year longitudinal study of the Mini-Mental State Examination in normal aging. Am J Epidemiol. 1997;1456:498–506. [DOI] [PubMed] [Google Scholar]
- 8.Payne BR, Gross AL, Parisi JM et al. . Modelling longitudinal changes in older adults’ memory for spoken discourse: findings from the ACTIVE cohort. Memory. 2013;228:1–12. [DOI] [PMC free article] [PubMed] [Google Scholar]
- 9.Abner EL, Dennis BC, Mathews MJ et al. . Practice effects in a longitudinal, multi-center Alzheimer's disease prevention clinical trial. Trials. 2012;13:217. [DOI] [PMC free article] [PubMed] [Google Scholar]
- 10.Dodge HH, Wang C-N, Chang C-CH et al. . Terminal decline and practice effects in older adults without dementia: the MoVIES project. Neurology. 2011;778:722–730. [DOI] [PMC free article] [PubMed] [Google Scholar]
- 11.Heathcote A, Brown S, Mewhort DJK. The power law repealed: the case for an exponential law of practice. Psychon Bull Rev. 2000;72:185–207. [DOI] [PubMed] [Google Scholar]
- 12.Murre JM, Chessa AG. Power laws from individual differences in learning and forgetting: mathematical analyses. Psychon Bull Rev. 2011;183:592–597. [DOI] [PMC free article] [PubMed] [Google Scholar]
- 13.Collie A, Maruff P, Darby DG et al. . The effects of practice on the cognitive test performance of neurologically normal individuals assessed at brief test-retest intervals. J Int Neuropsychol Soc. 2003;93:419–428. [DOI] [PubMed] [Google Scholar]
- 14.Sliwinski MJ, Hoffman L, Hofer SM. Modeling retest and aging effects in a measurement burst design. In: Molenaar PCM, Newell KM, eds. Individual Pathways of Change: Statistical Models for Analyzing Learning and Development. Washington, DC: American Psychological Association; 2010:37–50. [Google Scholar]
- 15.Welford AT. Practice effects in relation to age: a review and a theory. Dev Neuropsychol. 1985;12:173–190. [Google Scholar]
- 16.Calamia M, Markon K, Tranel D. Scoring higher the second time around: meta-analyses of practice effects in neuropsychological assessment. Clin Neuropsychol. 2012;264:543–570. [DOI] [PubMed] [Google Scholar]
- 17.Dikmen SS, Heaton RK, Grant I et al. . Test-retest reliability and practice effects of expanded Halstead-Reitan Neuropsychological Test Battery. J Int Neuropsychol Soc. 1999;54:346–356. [PubMed] [Google Scholar]
- 18.Duff K, Chelune G, Dennett K. Within-session practice effects in patients referred for suspected dementia. Dement Geriatr Cogn Disord. 2012;334:245–249. [DOI] [PMC free article] [PubMed] [Google Scholar]
- 19.Schrijnemaekers AM, de Jager CA, Hogervorst E et al. . Cases with mild cognitive impairment and Alzheimer's disease fail to benefit from repeated exposure to episodic memory tests as compared with controls. J Clin Exp Neuropsychol. 2006;283:438–455. [DOI] [PubMed] [Google Scholar]
- 20.Thorvaldsson V, Hofer SA, Berg S et al. . Effects of repeated testing in a longitudinal age-homogeneous study of cognitive aging. J Gerontol B Psychol Sci Soc Sci. 2006;616:P348–P354. [DOI] [PubMed] [Google Scholar]
- 21.Hoffman L, Hofer SM, Sliwinski MJ. On the confounds among retest gains and age-cohort differences in the estimation of within-person change in longitudinal studies: a simulation study. Psychol Aging. 2011;264:778–791. [DOI] [PMC free article] [PubMed] [Google Scholar]
- 22.Thorvaldsson V, Hofer SM, Hassing L et al. . Cognitive change as conditional on age heterogeneity in onset of mortality-related processes and repeated testing effects. In: Hofer SM, Alwin DF, eds. Handbook on Cognitive Aging: Interdisciplinary Perspectives. Thousand Oaks, CA: Sage Publications; 2008:284–297. [Google Scholar]
- 23.Weuve J, Proust-Lima C, Power MC et al. . Guidelines for reporting methodological challenges and evaluating potential bias in dementia research. Alzheimers Dement. 2015;119:1098–1109. [DOI] [PMC free article] [PubMed] [Google Scholar]
- 24.3C Study Group. Vascular factors and risk of dementia: design of the Three-City Study and baseline characteristics of the study population. Neuroepidemiology. 2003;226:316–325. [DOI] [PubMed] [Google Scholar]
- 25.Bell B, Rose CL, Damon A. The Normative Aging Study: an interdisciplinary and longitudinal study of health and aging. Int J Aging Hum Dev. 1972;31:5–17. [Google Scholar]
- 26.Weisskopf MG, Proctor SP, Wright RO et al. . Cumulative lead exposure and cognitive performance among elderly men. Epidemiology. 2007;181:59–66. [DOI] [PubMed] [Google Scholar]
- 27.Tang MX, Cross P, Andrews H et al. . Incidence of AD in African-Americans, Caribbean Hispanics, and Caucasians in northern Manhattan. Neurology. 2001;561:49–56. [DOI] [PubMed] [Google Scholar]
- 28.Luchsinger JA, Tang MX, Stern Y et al. . Diabetes mellitus and risk of Alzheimer's disease and dementia with stroke in a multiethnic cohort. Am J Epidemiol. 2001;1547:635–641. [DOI] [PubMed] [Google Scholar]
- 29.Manly JJ. Cognitive decline and literacy among ethnically diverse elders. J Geriatr Psychiatry Neurol. 2005;184:213–217. [DOI] [PubMed] [Google Scholar]
- 30.Little RJA, Rubin DB. Statistical Analysis with Missing Data. 2nd ed New York, NY: John Wiley & Sons, Inc.; 2002. [Google Scholar]
- 31.Park LQ, Gross AL, McLaren DG et al. . Confirmatory factor analysis of the ADNI Neuropsychological Battery. Brain Imaging Behav. 2012;64:528–539. [DOI] [PMC free article] [PubMed] [Google Scholar]
- 32.Siedlecki KL, Manly JJ, Brickman AM et al. . Do neuropsychological tests have the same meaning in Spanish speakers as they do in English speakers? Neuropsychology. 2010;243:402–411. [DOI] [PMC free article] [PubMed] [Google Scholar]
- 33.Jones RN, Rudolph JL, Inouye SK et al. . Development of a unidimensional composite measure of neuropsychological functioning in older cardiac surgery patients with good measurement precision. J Clin Exp Neuropsychol. 2010;3210:1041–1049. [DOI] [PMC free article] [PubMed] [Google Scholar]
- 34.Isaacs B, Kennie AT. The set test as an aid to the detection of dementia in old people. Br J Psychiatry. 1973;123575:467–470. [DOI] [PubMed] [Google Scholar]
- 35.Harrison JE, Buxton P, Husain M et al. . Short test of semantic and phonological fluency: normal performance, validity and test-retest reliability. Br J Clin Psychol. 2000;392:181–191. [DOI] [PubMed] [Google Scholar]
- 36.Buschke H. Selective reminding for analysis of memory and learning. J Verb Learn Verb Behav. 1973;125:543–550. [Google Scholar]
- 37.Fuhrer R, Rouillon F. La version française de l’échelle CES-D (Center for Epidemiologic Studies-Depression Scale). Description et traduction de l’échelle d'autoévaluation. Psychiatr Psychobiol. 1989;43:163–166. [Google Scholar]
- 38.Derogatis LR. BSI—Brief Symptom Inventory: Administration, Scoring and Procedures Manual. Minneapolis, MN: National Computer Systems, Inc.; 1993. [Google Scholar]
- 39.Rhodes D, Spiro A 3rd, Aro A et al. . Relationship of bone and blood lead levels to psychiatric symptoms: the Normative Aging Study. J Occup Environ Med. 2003;4511:1144–1151. [DOI] [PubMed] [Google Scholar]
- 40.Laird NM, Ware JH. Random-effects models for longitudinal data. Biometrics. 1982;384:963–974. [PubMed] [Google Scholar]
- 41.Akaike H. A new look at the statistical model identification. IEEE Trans Automat Contr. 1974;196:716–723. [Google Scholar]
- 42.Commenges D, Sayyareh A, Letenneur L et al. . Estimating a difference of Kullback-Leibler risks using a normalized difference of AIC. Ann Appl Stat. 2008;23:1123–1142. [Google Scholar]
- 43.R Core Team. R: A Language and Environment for Statistical Computing. Vienna, Austria: R Foundation for Statistical Computing; 2013. [Google Scholar]
- 44.Hausknecht JP, Halpert JA, Di Paolo NT et al. . Retesting in selection: a meta-analysis of coaching and practice effects for tests of cognitive ability. J Appl Psychol. 2007;922:373–385. [DOI] [PubMed] [Google Scholar]
- 45.Duff K, Lyketsos CG, Beglinger LJ et al. . Practice effects predict cognitive outcome in amnestic mild cognitive impairment. Am J Geriatr Psychiatry. 2011;1911:932–939. [DOI] [PMC free article] [PubMed] [Google Scholar]
- 46.Howieson DB, Carlson NE, Moore MM et al. . Trajectory of mild cognitive impairment onset. J Int Neuropsychol Soc. 2008;142:192–198. [DOI] [PubMed] [Google Scholar]
- 47.Liu X, Tsai WY, Stern Y. A functional decline model for prevalent cohort data. Stat Med. 1996;1510:1023–1032. [DOI] [PubMed] [Google Scholar]
- 48.Martins CA, Oulhaj A, de Jager CA et al. . APOE alleles predict the rate of cognitive decline in Alzheimer disease: a nonlinear model. Neurology. 2005;6512:1888–1893. [DOI] [PubMed] [Google Scholar]
- 49.Beyerlein A. Quantile regression-opportunities and challenges from a user's perspective. Am J Epidemiol. 2014;1803:330–331. [DOI] [PubMed] [Google Scholar]
- 50.Koenker R. Quantile Regression. 1st ed New York, NY: Cambridge University Press; 2005. [Google Scholar]
- 51.Proust C, Jacqmin-Gadda H, Taylor JM et al. . A nonlinear model with latent process for cognitive evolution using multivariate longitudinal data. Biometrics. 2006;624:1014–1024. [DOI] [PMC free article] [PubMed] [Google Scholar]
- 52.Proust-Lima C, Dartigues JF, Jacqmin-Gadda H. Misuse of the linear mixed model when evaluating risk factors of cognitive decline. Am J Epidemiol. 2011;1749:1077–1088. [DOI] [PMC free article] [PubMed] [Google Scholar]
- 53.Rabbitt P, Lunn M, Wong D. Understanding terminal decline in cognition and risk of death: methodological and theoretical implications of practice and dropout effects. Eur Psychol. 2006;113:164–171. [Google Scholar]
- 54.Rabbitt P, Lunn M, Wong D et al. . Age and ability affect practice gains in longitudinal studies of cognitive change. J Gerontol B Psychol Sci Soc Sci. 2008;634:P235–P240. [DOI] [PubMed] [Google Scholar]
Associated Data
This section collects any data citations, data availability statements, or supplementary materials included in this article.