Abstract
Titanium dioxide (TiO2) particles, including nanoparticles with diameters smaller than 100 nm, are used extensively in consumer products. In a 2011 current intelligence bulletin, the National Institute of Occupational Safety and Health (NIOSH) recommended methods to assess worker exposures to fine and ultrafine TiO2 particles and associated occupational exposure limits for these particles. However, there are several challenges and problems encountered with these recommended exposure assessment methods involving the accurate quantitation of titanium dioxide collected on air filters using acid digestion followed by inductively coupled plasma optical emission spectroscopy (ICP-OES). Specifically, recommended digestion methods include the use of chemicals, such as perchloric acid, which are typically unavailable in most accredited industrial hygiene laboratories due to highly corrosive and oxidizing properties. Other alternative methods that are used typically involve the use of nitric acid or combination of nitric acid and sulfuric acid, which yield very poor recoveries for titanium dioxide. Therefore, given the current state of the science, it is clear that a new method is needed for exposure assessment. In this current study, a microwave-assisted acid digestion method has been specifically designed to improve the recovery of titanium in TiO2 nanoparticles for quantitative analysis using ICP-OES. The optimum digestion conditions were determined by changing several variables including the acids used, digestion time, and temperature. Consequently, the optimized digestion temperature of 210°C with concentrated sulfuric and nitric acid (2:1 v/v) resulted in a recovery of >90% for TiO2. The method is expected to provide for a more accurate quantification of airborne TiO2 particles in the workplace environment.
Keywords: Inductively coupled plasma optical emission spectroscopy, microwave-assisted digestion, mixed-cellulose ester filter, polyvinyl chloride filter, titanium dioxide, nanoparticles
Introduction
Titanium dioxide (TiO2) accounts for nearly 70% of the total global pigment production as a result of its high refractive index and extremely low solubility.[1] Its use extends over a wide range of consumer products from paints, coatings, and plastics to food, pharmaceuticals, and cosmetics.[2–6] In addition, over the last couple of decades, TiO2 has emerged as one of the top five nanoparticles used in consumer products.[7,8] Nanoscale TiO2 has distinctly different properties compared to its bulk counterpart. These differences become most prominent when the primary particle size is smaller than approximately 10 nm.[9,10] In this size range, the most thermodynamically stable crystal structure of TiO2 is anatase in contrast to the rutile phase for larger particles. This is due to large contributions of the surface energy to the total energy for small particles.[11–13] In addition, nanoscale TiO2 has enhanced photocatalytic properties, resulting in their use in water purification, incorporation in self-cleaning, and anti-fogging surfaces.[14]
Occupational exposure limits have been established to prevent the development of adverse health effects among workers who may be exposed to inhaled TiO2 particles. The U.S. Occupational Safety and Health Administration (OSHA) regulates TiO2 as particulates not otherwise regulated (PNOR), with 8-hr exposure limits of 15 mg/m3 as total dust and 5 mg/m3 as respirable dust [29 CFR 1910.1000; Table Z-1]. Threshold limit values (TLVs) from The American Conference of Governmental Industrial Hygienists (ACGIH) for airborne TiO2 particles are 10 mg/m3 TiO2 for total dust and, using particles not otherwise specified (PNOS) guidelines, 5 mg/m3 for respirable particles. These limits provide no distinction for the different toxicity of TiO2 nanoparticles compared to larger ones.
Although fine particles (diameters between 0.1–3 μm) of TiO2 are known to be biocompatible, some of the research conducted on TiO2 nanoparticles (diameters smaller than 100 nm) has suggested potential toxicological impacts because they possess physicochemical properties different from the bulk.[13,15–17] Sayes et al. clearly showed that the higher content of anatase results in a 6-fold enhancement in the generation of reactive oxygen species upon UV irradiation when compared to rutile.[18] Furthermore, a comparison between polymer grafted TiO2 (coated) and uncoated TiO2 has displayed diminished cytotoxicity for the coated nanoparticles raising concerns about possible harmful effects even under ambient conditions.[19] Although epidemiological studies are unavailable for exposure to TiO2 nanoparticles, toxicological evidence suggests that occupational exposure limits that are based on the inhalation of larger TiO2 dusts may not be sufficient to prevent the development of adverse health effects among workers.
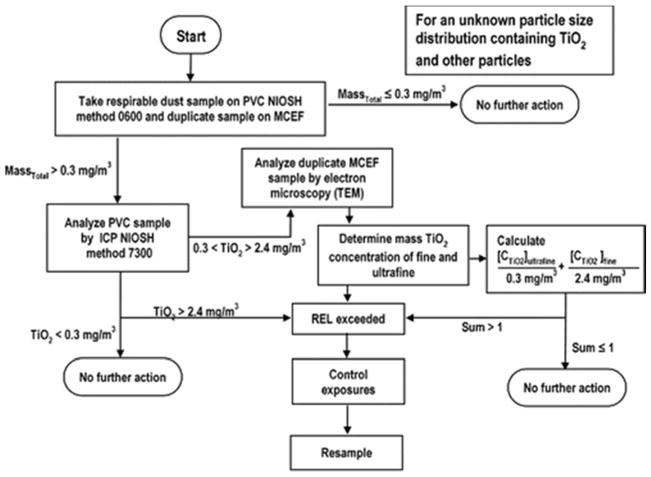
In response to these considerations, the U.S. National Institute of Occupation Health and Safety (NIOSH) set forth recommended exposure limits for fine and nanoscale TiO2 particles in the Current Intelligence Bulletin 63 (2011).[20] The CIB 63 NIOSH recommends airborne exposure limits of 2.4 mg/m3 for fine TiO2 and 0.3 mg/m3 for ultrafine (including engineered nanoscale) TiO2 as time-weighted average concentrations (10 hr/day during a 40-hr week). Additionally, a multi-tiered workplace exposure assessment strategy has been proposed when the airborne particle size distributions are unknown and background interferences are present (Figure 1) to ensure that airborne TiO2 exposures are below the recommended limits.
Figure 1.
Multi-tiered exposure assessment protocol for TiO2 taken from the Current Intelligence Bulletin (CIB 63) issued by National Institute of Occupational Safety and Health (NIOSH) in 2011[20].
Carrying out these proposed exposure assessments using this procedure is complicated. Airborne particles are to be collected onto both polyvinyl chloride (PVC) and mixed cellulose ester (MCE) filters using NIOSH 0600 (respirable sampling) with analysis by NIOSH 7300 (inductively coupled plasma optical emission spectroscopy [ICP-OES] or mass spectroscopy [ICP-MS]). There are two major shortcomings in these methods. First, while NIOSH 0600 removes particles larger than 10 μm from the collected sample, the method provides no way to differentiate between fine particles and nanoparticles. Therefore, more expensive electron microscopy methods are required to quantify this differentiation. However, there are new samplers available for appropriate size-selective sampling for fine particles and nanoparticles.[21–23] Second, NIOSH 7300 method requires the use of perchloric acid (HClO4) to digest the filter and collected particles. Given its strong oxidizing properties, hazardous nature and highly regulated status, HClO4 is commonly avoided in environmental test laboratories. Thus, it is not a viable acid to be used in standard assessment protocols. In most cases, laboratories use modified analytical methods, typically digesting samples with only one of the digestion components (nitric acid, HNO3) specified in NIOSH 7300. However, this acid alone will not completely solubilize TiO2. Therefore, recoveries are expected to be low in the presence of nitric acid alone, and exposures will be incorrectly reported lower than true values.
In the current study, we identify a new alternative to Method 7300 to quantify TiO2 particles deposited on PVC and MCE filters. This method uses a combination of sulfuric and nitric acid with microwave digestion to efficiently recover TiO2 nanoparticles. Microwave digestion provides a safer platform to achieve higher local temperatures and pressures that are capable of breaking down the TiO2 lattice structure critical to accurately quantifying titanium by ICP-OES or ICP-MS analysis.[24] Although microwave digestion has been used for quite some time, this is the first extensive study conducted on its potential for the use of quantification in TiO2 nanoparticle exposure assessments. The developed method was also tested for any dependence on the size of the TiO2 nanoparticles as well, as discussed in more detail below.
Methods
Nanoparticle characterization
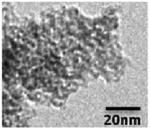
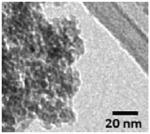
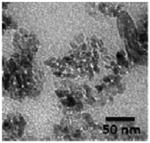
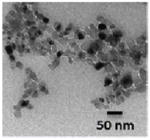
The TiO2 nanoparticles used in all the experiments were characterized extensively for their physicochemical properties. Primary particle size and shape were analyzed using transmission electron microscopy (TEM, JEOL JEM 1230, Japan). The surface area was analyzed using Quantachrome 4200e BET surface area analyzer. The bulk composition was obtained from the X-ray diffraction (XRD, D8 Advance, Bruker AXS, Karlsruhe, Germany).
Microwave-assisted acid digestion of TiO2 nanoparticles
An acid mixture of concentrated nitric (conc. HNO3) and sulfuric acid (conc. H2SO4) were used to achieve complete dissolution of TiO2 nanoparticles. All the digestions were conducted using a MARS 6 microwave digestion system (CEM Corporation, Matthews, NC) that has a maximum microwave power output of 1,800 W. This digestion system operates by heating up to 40 digestion vessels, each containing a sample with concentrated acids. The system temperature increases to a programmed set temperature over 20 min, then holds the set temperature for a preprogrammed time before the digestion samples are cooled back to room temperature. This system is capable of holding pressures up to 500 psi in the digestion vessels and has a built-in venting mechanism for safety purposes. The microwave digestion was optimized for three factors (acid combination, digestion time, and digestion temperature) as summarized in Table 1.
Table 1.
Summary of digestion conditions used for the method optimization.
| Factor | Levels |
|---|---|
| Acid mixture | HNO3 (100%), HNO3:H2SO4 (1:1), HNO3:H2SO4 (1:2), H2SO4 (100%) |
| Digestion hold time (min) | 15, 30, 45 |
| Digestion set temperature (°C) | 190, 210 |
Optimization of the method was carried out using suspensions of 5 nm TiO2 nanoparticles. A stock solution of TiO2 nanoparticles (3.6 g/L) was prepared by ultrasonicating (35% amplitude, 10 min) TiO2 nanoparticles (5 nm, 3.6 mg) in Optima water (10 mL) to form a uniform suspension. Using this stock solution, 36 μg and 360 μg of TiO2 nanoparticles were transferred to the microwave digestion vessels. These quantities represent the mass of TiO2 that would be collected with a sampler at 2.5 Lpm (a typical airflow rate for an industrial hygiene sampler) over 8 hr (a typical work shift), if the airborne concentration of TiO2 was 10% and 100% of the NIOSH recommended exposure limit for ultrafine TiO2 (0.3 mg/m3), respectively. To these vessels, a total volume of 6 mL of acid was added followed by digestion. After the digestion was complete, all the samples were transferred into vials containing water (5 mL) and allowed to degas under the fume hood for 30 min. (NOTE: the entire sample handling after digestion must be done in the fume hood—see Figure S1). Subsequently, the solution was topped to a total volume of 25 mL with water, further degassed for 1–2 hr and analyzed using ICP-OES (Varian, Agilent Technologies, Santa Clara, CA.). Further experiments were conducted to ensure that the reagents did not contain Ti. The optimum conditions for the complete dissolution of TiO2 were determined by analyzing the digestate for recovery of dissolved Ti using ICP-OES and calculating the percent recovery (%) under each condition. Additionally, in order to test the effect of particle size on the recovery, TiO2 nanoparticles with sizes 2, 10, and 25 nm were also digested using the optimized digestion conditions. All experiments were conducted in triplicate.
Microwave-assisted acid digestion of TiO2 spiked filter substrates
Recovery of Ti from filters spiked with 5-nm TiO2 nanoparticles was measured using the optimized digestion conditions. Three blank samples were prepared by placing PVC filters (37 mm, 5 μm, lot number T306221, SKC Inc., PA) into a digestion vessel to test for background metal levels. Each vessel contained three filters in order to get measurable amount of background metals into the digestate. Spikes were prepared by transferring 36 μg or 360 μg of TiO2 nanoparticles from the stock solution into a vessel containing a PVC filter. Spikes were also prepared using mixed cellulose ester (MCE) filters (25 mm, 0.8 μm, lot number H5CN68558-051114, SKC Inc., PA) in the place of PVC. Spike samples were prepared in triplicate. All blank and spike samples were then digested under the optimized conditions (acid mixture = H2SO4 and HNO3 (2:1 v/v), digestion temperature = 210°C, digestion time = 45 min). The digestate was then analyzed for dissolved Ti using ICP-OES as described above.
Statistical analysis
The results from all experiments were reported as mean recovery ± standard deviation. One- and two-way ANOVA were conducted to compare the effect of microwave digestion factors (digestion acid, TiO2 spike level, TiO2 particle size, elevated temperature, elevated temperature hold time, and substrate) on recovery. Interaction between factors was included in all two-way analyses. Post hoc Tukey tests were conducted to compare mean recoveries; significant differences in mean recoveries were reported using ANOVA at a significance level of 0.05. All statistics were carried out in Minitab Version 17.1
Reagents
Concentrated sulfuric acid (Trace metal grade, 99.99%) and concentrated nitric acid (Trace metal grade, 99.99%) used in all the analysis was purchased from Fisher Scientific (Fairlawn, NJ). All the solutions were made in HPLC grade Optima water. The same PVC and MCE filters discussed previously were used as NIOSH recommended filter substrates. TiO2 nanoparticles were purchased from NanoScale Corporation (2 nm, Manhattan, KS), Nanostructures and Amorphous Materials Inc. (5 and 10 nm, Houston, TX) and Degussa (25 nm, Evonik Industries, Essen, Germany).
Results and discussion
Nanoparticle characterization
The physiochemical properties of TiO2 nanoparticles used in this study are summarized in Table 2. According to the XRD analysis, as the particle size increased the bulk composition changed from 100% anatase to a mixture of anatase and rutile consistent with the literature.[12,13] The measured surface area decreased as the particle size increase.
Table 2.
Physicochemical characterization of TiO2 nanoparticles.
| Primary Particle Size | 2 nm | 5 nm | 10 nm | 20 nm |
|---|---|---|---|---|
| TEM image |
|
|
|
|
| BET surface area (m2/g) | 480 ± 7 | 248 ± 4 | 128 ± 4 | 50 ± 1 |
| Crystalline phase | Anatase | Anatase | Anatase and Rutile | Anatase and Rutile |
Digestion method optimization
Given that TiO2 is among the least soluble metal oxides, it is imperative to completely solubilize it in solution for accurate quantification using ICP-OES. This low solubility poses a challenge in exposure assessments of airborne TiO2 nanoparticles. Therefore, strong oxidizing agents are needed under extreme pH conditions in sample preparation for ICP-OES analysis. In this current method, a microwave-assisted acid digestion method was optimized in order to achieve complete recovery of Ti from TiO2 nanoparticle samples under relatively safer conditions. The factors affecting this digestion method were identified as the acid mixture, digestion hold time and digestion temperature. The digestion of 5 nm TiO2 was conducted under varying conditions as given in Table 2 and quantified using ICP-OES.[25] The resulting recoveries are summarized in Table 3.
Table 3.
Optimizing the microwave digestion conditions for 4 nm TiO2 nanoparticles.
| Acid mixturea | Recovery (%) | |||
|---|---|---|---|---|
| HNO3 | HNO3:H2SO4 (1:1) | HNO3:H2SO4 (1:2) | H2SO4 | |
| 360 μg | 21 ± 1 | 87 ± 4 | 94 ± 3 | 86 ± 3 |
| Digestion timeb | 15 min | 30 min | 45 min | |
| 36 μg | 87 ± 4 | 81 ± 5 | 93 ± 5 | |
| 360 μg | 94 ± 3 | 92 ± 6 | 97 ± 4 | |
| Digestion temperaturec | 190°C | 210°C | ||
| 36 μg | 93 ± 5 | 92 ± 3 | ||
| 360 μg | 97 ± 4 | 103 ± 1 | ||
| 360 μg | 97 ± 4 | 103 ± 1 | ||
Temperature-190°C/time-15 min
Temperature-190°C/acid mixture-H2SO4 & HNO3 (2:1)
Time-45 min/acid mixture-H2SO4 & HNO3 (2:1)
Effect of acid mixture on recovery
According to Table 3, the composition of acid mixture plays a critical role in achieving higher recoveries. The recovery of 5-nm TiO2 nanoparticles with different acid compositions (digestion protocol: temperature = 190°C, ramp time = 20 min, holding time = 15 min) showed a significant effect of acid on recovery (p<0.001). Post hoc comparisons indicated that the mean recovery for 100% HNO3 acid (M = 20.8%, SD = 1.3%) was significantly and substantially lower than that for all other acids, which ranged from 86–94%. These comparisons also indicated that the mean recovery for 2:1 H2SO4:HNO3 was significantly higher than other acids.
A 21% recovery of TiO2 using 100% concentrated HNO3 is not sufficient. Although higher recovery (86%) can be achieved with concentrated H2SO4, it was found that a higher recovery of 94% can be achieved using a 2:1 mixture of concentrated H2SO4 and HNO3, respectively. Use of this acid mixture is known to produce the nitronium ion, NO2+, a highly reactive species that reacts with the lattice structure of TiO2. Excess H2SO4 facilitates the protonation of HNO3 leading to the formation of the nitronium ion as shown: [26]
| (1) |
| (2) |
Based on these results, the acid mixture that was used throughout the remainder of this study was 2:1 conc. H2SO4 and HNO3.
Effect of digestion time on recovery
In order to further improve recovery, TiO2 nanoparticles were digested for different time intervals. Here the particles were digested with a mixture of conc. H2SO4 (4 mL) and conc. HNO3 (2 mL) at 190°C for 15, 30 and 45 minutes. The recoveries obtained with each time duration are given in Table III. ANOVA showed a significant effect of the digestion time (p = 0.021) and the spike levels (p = 0.005) on recovery, with no interaction between spike level and digestion time. The recovery for the longest hold time (45 min; M = 95%; SD = 4%) was substantially and statistically higher than that for 15 min (M = 86%, SD = 8%) but not statistically higher than that for 30 min (M = 91%, SD = 5%). Further tests were conducted with a digestion hold time of 45 min.
The mean recovery observed for samples with a 360-μg spike (M = 97%, SD = 4%) was significantly higher than that for those with 36-μg spikes. Nanomaterials are known to undergo re-precipitation under different temperature regions if the saturation concentration is achieved, which can be a possible reason for the lower recovery observed when digestion was carried out for 30 min. Between the two spike levels, the lower quantity (36-μg of TiO2) resulted in the lowest recoveries (93%) that may have resulted more from the errors associated in transferring very small volumes rather than incomplete digestion. For 360-μg spikes the recovery was 97%, which is much higher than what is required by the NIOSH (75%).[27] Because 45 min of digestion resulted in the highest recovery, this time was used in subsequent digestions.
Effect of digestion temperature on recovery
Further optimization was conducted by increasing the digestion temperature. To investigate temperature effects, digestion was carried out at 190°C and 210°C for 45 min using concentrated H2SO4 (4 mL) and HNO3 (2 mL). As illustrated in Table 3 increasing the temperature to 210°C resulted in complete recovery for samples with 360-μg spikes. As before, for the 36-μg spikes the relatively low recovery may have resulted from the errors associated in transferring smaller volumes. However, according to the statistical analysis, there was a significant effect of spike level on recovery (p = 0.008) but not temperature (p = 0.29) with no interaction between spike level and temperature (p = 0.12). The mean recovery observed for the 360-μg spike (M = 100%, SD = 4.2%) was higher than that for the 36-μg spike (M = 92.8%, SD = 3.7%).
Theoretically, increasing the digestion temperature provided the system with more energy causing more lattice vibrations as well as molecular collisions to breakdown the lattice structure of TiO2. Therefore, the optimum digestion conditions for complete recovery of TiO2 was concluded as 210°C temperature, 45 min digestion time and a 2:1 mixture of conc. H2SO4 and HNO3. However, all the temperatures reported in this manuscript refer to the user-defined temperature at the beginning of the digestion. It is important to highlight that during the digestion the systems’ internal IR sensor indicates that there is at least a +10°C elevation during the digestion for each and every vessel. This increase in temperature further facilitates the dissolution of TiO2.
Effect of particle size on recovery using the optimized digestion conditions
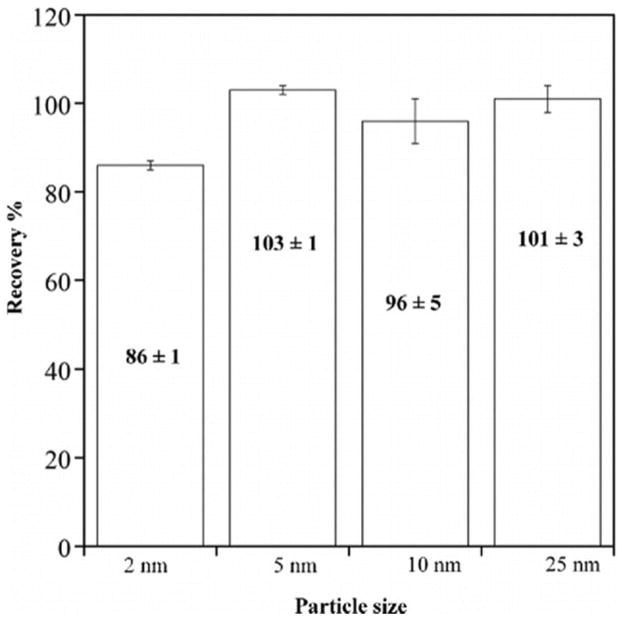
Because nanoparticles have shown to behave differently from their bulk counterparts, the effect of particle size on the digestion has also been investigated. The recoveries for the 2, 5, 10, and 25 nm TiO2 particles at the optimized digestion conditions are given in Figure 2. All recoveries were greater than 95% for all particle sizes, except 2-nm TiO2 with a significant recovery reduction (M = 86.2%, SD = 0.7%, p < 0.001). A plausible explanation to this lowered recovery of 2-nm TiO2 particles is the presence of additional metals and organics that contribute towards the total mass. The energy dispersive x-ray (EDX) analysis of the 2-nm TiO2 particles confirmed that no additional metals were present (Figure S2). However, the surface analysis by x-ray photoelectron spectroscopy (XPS) indicated the presence of some carbon-oxygen species on the 2-nm TiO2 particle surface. Literature shows that monolayer thickness of these organic coatings such as polyvinylpyrrolidone (PVP) can account for nearly 17% of the total mass for 10 nm Ag nanoparticles.[28] Similarly, the lowered recovery may have resulted from having organic coating rather than an actual loss in the Ti recovery (Figure S3). Alternatively, the enhanced thermodynamic stability of anatase for smaller particle size may also have contributed to lower recoveries. According to the literature, size dependent properties become more enhanced for TiO2 nanoparticles in the size regime of 1–3 nm.[13] In addition, there are reports in the literature of polymorph (crystalline phase) dependent particle dissolution during both acid and alkali digestions.[29] Because of the large contribution of the surface free energy to the total energy for nanoparticles, the most thermodynamically stable crystalline phase is a function of size. For very small nanoparticles smaller than 20 nm, anatase is the most stable phase and for larger particles rutile is favored. In the case of TiO2 nanoparticles used in this study where smallest particles were 100% anatase while the larger particles composed of a mixture of rutile and anatase.
Figure 2.
Effect of particle size on the recovery of TiO2 nanoparticles. Digestions were conducted using concentrated H2SO4 (4 mL) and HNO3 (2 mL), ramping temperature up to 210°C in 20 min, holding for 45 min and cooling to room temperature. Error bars represent one standard deviation.
Recovery of Ti from spiked PVC and MCE filters
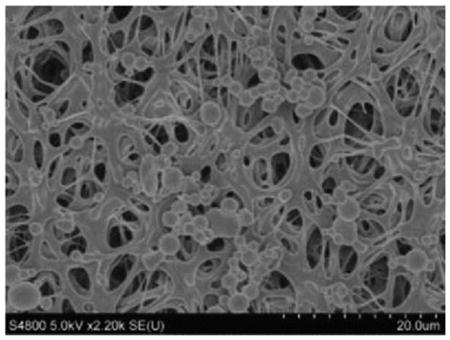
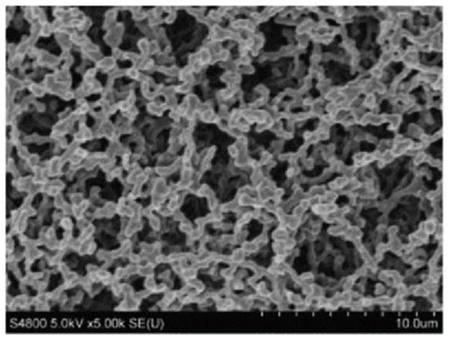
The overall objective of this article was to develop a method to extract TiO2 nanoparticles collected on air filters completely and efficiently for accurate quantification. The above work proved that the optimized digestion conditions are capable of 100% recovery of Ti from TiO2 nanoparticles in suspensions. Nevertheless, it is imperative to ensure that same recovery is achieved in the presence of filter substrates, especially if particles penetrate into the filter and are not digested because the filter digestion is incomplete. Since CIB 63 issued by NIOSH recommends using PVC and MCE filters in the multi-tiered exposure assessment protocol for TiO2 nanoparticles, optimized digestion conditions were tested for its applicability using both PVC and MCE filters. These filters have a fibrous structure with uneven pores that can collect nanoparticles via diffusion and impaction (Table 3).
Table 4 provides background metal content determined by ICP-OES with estimates of the limit of detection (LOD) and limit of quantitation (LOQ) for 37-mm filters. The LOD was calculated as the mean plus three times the standard deviation of metal found on the filter, and the LOQ was calculated as the mean plus 10 times the standard deviation. As can be seen, PVC had a low Ti background, whereas the Ti content in MCE filters was below the detection limit of ICP-OES. For a PVC filter, the LOQ for titanium was estimated as 0.13 μg/filter. For a 10-hr sample collected at 2.5 Lpm (a typical airflow rate used in industrial hygiene sampling), this LOQ can be expressed in terms of TiO2 as 0.2 μg/m3 or 0.0002 mg/m3. This value is well below the airborne exposure limits of 2.4 mg/m3 for fine TiO2 and 0.3 mg/m3 for ultrafine TiO2 as time-weighted average concentrations (10 hr/day during a 40-hr week) as recommended by NIOSH in CIB 63.[20] Therefore, in terms of interferences, these filters are suitable for use in monitoring airborne TiO2 nanoparticles.
Table 4.
Background metal content of filter substrates.
| Filter substrate | PVC | MCE | ||||||
|---|---|---|---|---|---|---|---|---|
| SEM images Metal |
|
|
||||||
| Metal content (μg/g) | Metal content (μg/filter) | LOD (μg/filter) | LOQ (μg/filter) | Metal content (μg/g) | Metal content (μg/filter) | LOD(μg/filter) | LOQ (μg/filter) | |
| Ti | 5.3 ± 0.5 | 0.063 ± 0.006 | 0.08 | 0.13 | ND | ND | – | – |
| Fe | 15.8 ± 6.9 | 0.19 ± 0.084 | 0.44 | 1.0 | 2.1 ± 0.6 | 0.09 ± 0.02 | 0.2 | 0.3 |
| Cr | 6.1 ± 0.5 | 0.074 ± 0.006 | 0.09 | 0.14 | 2.3 ± 0.4 | 0.1 ± 0.02 | 0.1 | 0.3 |
| Mn | ND | ND | – | – | ND | ND | – | – |
| Ni | ND | ND | – | – | ND | ND | – | – |
| Cu | ND | ND | – | – | ND | ND | – | – |
| Cd | ND | ND | – | – | ND | ND | – | – |
| Zn | 1.4 ± 0.1 | 0.017 ± 0.001 | 0.02 | 0.03 | 5.2 ± 0.5 | 0.2 ± 0.01 | 0.2 | 0.3 |
Note: Values for metal content represent mean and standard deviation of three replicates. ND = not detected. Values expressed as per filter are provided for 37-mm filters.
For the TiO2 spiked filters, the optimized digestion condition was not able to digest the PVC filters completely, and residue material was observed in the digestate. The reason for this incomplete digestion is that the amount of nitronium ions generated is not enough to breakdown the TiO2 lattice structure as well as the filter substrate. Therefore, the acid volume was doubled for PVC, and the digestion was repeated. This resulted in a clearer solution, but subsequent filtration was carried out to ensure no residue materials were injected in to the ICP-OES instrument. MCE on the other hand was digested completely.
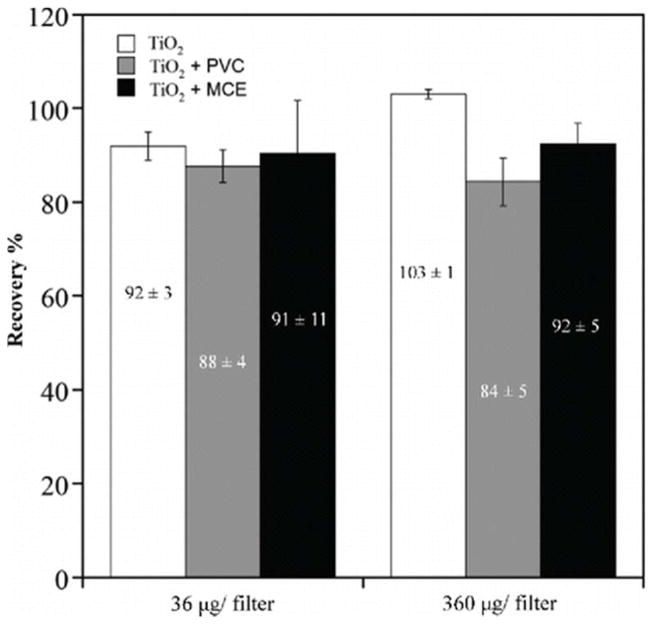
The recoveries from filters spiked with TiO2 nanoparticles are shown in Figure 3. There was a significant effect of substrate on recovery (p = 0.016) but not on spike level (p = 0.27), with no interaction between substrate and spike level. The mean recovery with an MCE filter (M = 91.4%, SD = 7.8%) was statistically the same as that with a PVC filter (M = 86.1%, SD = 4.3%). However, the mean recovery with no filter (M = 97.6%, SD = 6.4%) was statistically different than that with PVC filters but not MCE filters.
Figure 3.
Comparison between the recovery of TiO2, TiO2 spiked PVC filters and MCE filters. The spiking was conducted using 4 nm TiO2 nanoparticles at 36 μg/per filter and 360 μg/filter. Acid mixture: conc. H2SO4 (4 mL) and conc. HNO3 (2 mL). Digestion temperature = 210°C. Ramp time = 20 minutes. Hold time = 45 min.
There can be several reasons contributing to this lower recovery with the PVC filters. The additional filtration step to remove any residual materials could have resulted in some sample loss.
Increased acid volume may still have insufficient nitronium ion generation to digest both TiO2 and the filter materials. Furthermore, partial digestion of PVC can form organics that can complex with the Ti4+ ions in the medium that will inhibit the atomization during ICP-OES analysis. MCE filters on the other hand digest completely and result in better recovery than the PVC filters. Although the recovery tests presented here recommend MCE filters over PVC filters, field assessments desiring mass of all airborne particles recommend the use of more gravimetrically stable PVC filter. The current NIOSH exposure assessment protocol for TiO2 requires obtaining paired samples onto both PVC and MCE filters: the MCE filter is analyzed microscopically to determine the proportion of mass containing TiO2 particles that are in the fine and ultrafine size ranges. Microscopic analysis is, however, an expensive, low throughput approach of identifying the ultrafine fraction that may not be very reliable either.
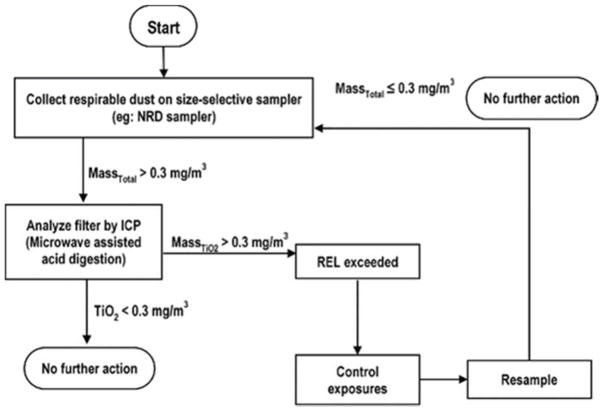
To avoid having to microscopically analyze TiO2 samples, a method to collect air samples on either MCE filters while preventing larger, non-nano materials from depositing onto the filter would facilitate assessment of exposure to engineered nanoparticles. Tsai et al.[21] introduced a personal nanoparticle sampler (PENS) that collects respirable particles and nanoparticles simultaneously. This sampler collects nanoparticles by impaction onto a silicone oil-coated Teflon filter substrate, which might be replaced with an MCE filter. However, this device is expensive to build and requires a large air sampling pump to overcome the high pressure drop of the nanoparticle impactor. Cena et al.[30] introduced the nanoparticle respiratory dose (NRD) sampler, which uses a respirable cyclone to aspirate particles followed by a 300-nm impactor prior to collection of nanoparticles by diffusion onto nylon mesh screens as they deposit in the human respiratory tract. The NRD is inexpensive (<$30) and offered commercially (ZNRD001, Zefon International, Ocala, FL) but would require modification to use the titanium-free MCE filter for analyzing Ti nanoparticle concentrations.[23] Future work will investigate the limits of detection for nylon mesh screens and other diffusion substrate for integration into the NRD sampler. Therefore, an alternative protocol has been proposed utilizing the size-selective air sampling combined with the developed microwave-assisted acid digestion for accurate quantification of airborne TiO2 nanoparticles in Figure 4 in future nanoparticle exposure assessments. Since this eliminates the need for conducting electron microscopy analysis this protocol is faster and cheaper for routine analysis. Furthermore, with increased recoveries from the digestion methods using safer chemicals and microwave digestion processes, the ICP analysis will result in accurate quantitative data that will enable effective exposure controls.
Figure 4.
Proposed alternative multi-tiered and selective exposure assessment protocol for fine and ultrafine TiO2
Conclusions
A microwave-assisted acid digestion method was developed to achieve high recovery (>90%) of titanium from filters suitable for airborne sampling. Upon optimization, an acid mixture of 2:1 volume ratio of conc. H2SO4 and HNO3 was determined to give the best digestion with conditions of T = 210°C and a hold time of 45 min. This method was able to break down the very stable lattice structure of TiO2, which we propose being facilitated by nitronium ions (NO2+) generated by the acid mixture and the high local temperatures and pressures facilitated by the microwave system. Nevertheless, this digestion method fails to give the same level of recovery with PVC filters (<80%), which are recommended for gravimetric and ICP analysis in the NIOSH exposure assessment protocol. MCE filters digest more easily than the PVC filters, however due to their hygroscopic nature they are not suitable for gravimetric analysis.
Acknowledgments
The authors greatly appreciate the preliminary efforts of Pam Kostle of the State Hygienic Laboratory (Iowa City, IA) and Brian Wells of the State Hygienic Laboratory (Ankeny, IA) to identify microwave digestion as a feasible alternative to increase recovery.
Funding
This work was funded by NIOSH (R21 OH009920; R01 OH010238).
References
- 1.Baan R, Straif K, Grosse Y. Carcinogenicity of carbon black, titanium dioxide, and talc. Lancet Oncol. 2006;7(5):365. doi: 10.1016/s1470-2045(06)70651-9. [DOI] [PubMed] [Google Scholar]
- 2.Kaida T, Kobayashi K, Adachi M, Suzuki F. Optical characteristics of titanium oxide interference film and the film laminated with oxides and their applications for cosmetics. J Cosmet Sci. 2004;55(2):219–220. [PubMed] [Google Scholar]
- 3.Liu K, Cao M, Fujishima A, Jiang L. Bio-inspired titanium dioxide materials with special wettability and their applications. Chem Rev. 2014;114(19):10044–10094. doi: 10.1021/cr4006796. [DOI] [PubMed] [Google Scholar]
- 4.Rajh T, Dimitrijevic NM, Bissonnette M, Koritarov T, Konda V. Titanium dioxide in the service of the biomedical revolution. Chem Rev. 2014;114(19):10177–10216. doi: 10.1021/cr500029g. [DOI] [PubMed] [Google Scholar]
- 5.Łabuz P, Sadowski R, Stochel G, Macyk W. Visible light photoactive titanium dioxide aqueous colloids and coatings. Chem Eng J. 2013;230(0):188–194. [Google Scholar]
- 6.Yang Y, Doudrick K, Bi X, et al. Characterization of food-grade titanium dioxide: the presence of nanosized particles. Envrion Sci Technol. 2014;48(11):6391–6400. doi: 10.1021/es500436x. [DOI] [PubMed] [Google Scholar]
- 7.Shukla RK, Sharma V, Pandey AK, Singh S, Sultana S, Dhawan A. ROS-mediated genotoxicity induced by titanium dioxide nanoparticles in human epidermal cells. Toxicol in Vitro. 2011;25(1):231–241. doi: 10.1016/j.tiv.2010.11.008. [DOI] [PubMed] [Google Scholar]
- 8.Bai J, Zhou B. Titanium dioxide nanomaterials for sensor applications. Chem Rev. 2014;114(19):10131–10176. doi: 10.1021/cr400625j. [DOI] [PubMed] [Google Scholar]
- 9.Smith AM, Nie S. Semiconductor nanocrystals: structure, properties, and band gap engineering. Acc Chem Res. 2009;43(2):190–200. doi: 10.1021/ar9001069. [DOI] [PMC free article] [PubMed] [Google Scholar]
- 10.Satoh N, Nakashima T, Kamikura K, Yamamoto K. Quantum size effect in TiO2 nanoparticles prepared by finely controlled metal assembly on dendrimer templates. Nat Nano. 2008;3(2):106–111. doi: 10.1038/nnano.2008.2. [DOI] [PubMed] [Google Scholar]
- 11.Zhang J, Xu Q, Feng Z, Li M, Li C. Importance of the relationship between surface phases and photocatalytic activity of TiO2. Angewandte Chemie Int Ed. 2008;47(9):1766–1769. doi: 10.1002/anie.200704788. [DOI] [PubMed] [Google Scholar]
- 12.Gribb AA. Particle size effects on transformation kinetics and phase stability in nanocrystalline TiO2. Am Mineral. 1997;82(7):717. [Google Scholar]
- 13.Chen X, Mao SS. Titanium dioxide nanomaterials: synthesis, properties, modifications, and applications. Chem Rev. 2007;107(7):2891–2959. doi: 10.1021/cr0500535. [DOI] [PubMed] [Google Scholar]
- 14.Asahi R, Morikawa T, Irie H, Ohwaki T. Nitrogen-doped titanium dioxide as visible-light-sensitive photocatalyst: designs, developments, and prospects. Chem Rev. 2014;114(19):9824–9852. doi: 10.1021/cr5000738. [DOI] [PubMed] [Google Scholar]
- 15.Armand L, Dagouassat M, Belade E, et al. Titanium dioxide nanoparticles induce matrix metalloprotease 1 in human pulmonary fibroblasts partly via an interleukin-1β–dependent mechanism. Am J Respir Cell Molec Biol. 2013;48(3):354–363. doi: 10.1165/rcmb.2012-0099OC. [DOI] [PubMed] [Google Scholar]
- 16.Ramsden CS, Henry TB, Handy RD. Sub-lethal effects of titanium dioxide nanoparticles on the physiology and reproduction of zebrafish. Aquat Toxicol. 2013;126(0):404–413. doi: 10.1016/j.aquatox.2012.08.021. [DOI] [PubMed] [Google Scholar]
- 17.Rui Q, Zhao Y, Wu Q, Tang M, Wang D. Biosafety assessment of titanium dioxide nanoparticles in acutely exposed nematode Caenorhabditis elegans with mutations of genes required for oxidative stress or stress response. Chemosphere. 2013;93(10):2289–2296. doi: 10.1016/j.chemosphere.2013.08.007. [DOI] [PubMed] [Google Scholar]
- 18.Sayes CM, Wahi R, Kurian PA, et al. Correlating nanoscale titania structure with toxicity: a cytotoxicity and inflammatory response study with human dermal fibroblasts and human lung epithelial cells. Toxicol Sci. 2006;92(1):174–185. doi: 10.1093/toxsci/kfj197. [DOI] [PubMed] [Google Scholar]
- 19.Tedja R, Lim M, Amal R, Marquis C. Effects of serum adsorption on cellular uptake profile and consequent impact of titanium dioxide nanoparticles on human lung cell lines. ACS Nano. 2012;6(5):4083–4093. doi: 10.1021/nn3004845. [DOI] [PubMed] [Google Scholar]
- 20.NIOSH. Current Intelligence Bulletin 63: Occupational Exposure to Titanium Dioxide. 2011 http://www.cdc.gov/niosh/docs/2011-160/pdfs/2011-160.pdf.
- 21.Tsai CJ, Liu CN, Hung SM, et al. Novel active personal nanoparticle sampler for the exposure assessment of nanoparticles in workplaces. Environ Sci Technol. 2012;46(8):4546–4552. doi: 10.1021/es204580f. [DOI] [PubMed] [Google Scholar]
- 22.Zhou Y, Irshad H, Tsai CJ, Hung SM, Cheng YS. Evaluation of a novel personal nanoparticle sampler. Environ Sci Process Impacts. 2014;16(2):203–210. doi: 10.1039/c3em00497j. [DOI] [PubMed] [Google Scholar]
- 23.Cena LG, Anthony TR, Peters TM. A personal nanoparticle respiratory deposition (NRD) sampler. Environ Sci Technol. 2011;45(15):6483–6490. doi: 10.1021/es201379a. [DOI] [PMC free article] [PubMed] [Google Scholar]
- 24.Hassan N, Rasmussen P, Dabek-Zlotorzynska E, Celo V, Chen H. Analysis of environmental samples using microwave-assisted acid digestion and inductively coupled plasma mass spectrometry: maximizing total element recoveries. Water, Air, and Soil Pollut. 2007;178(1–4):323–334. [Google Scholar]
- 25.Araújo GCL, Gonzalez MH, Ferreira AG, Nogueira ARA, Nóbrega JA. Effect of acid concentration on closed-vessel microwave-assisted digestion of plant materials. Spectrochimica Acta Part B Atom Spectrosc. 2002;57(12):2121–2132. [Google Scholar]
- 26.Vollhardt KPCSNE. Organic Chemistry: Structure and Function. New York: Freeman; 1998. [Google Scholar]
- 27.Kennedy E, Fischbach T, Song R, Shulman S, Hull R. NIOSH Manual of Analytical Methods. Chapter E Washington, DC: U.S. Government Printing Office; 1998. Development and Evaluations Methods. DHHS Publication No. 92-119. [Google Scholar]
- 28.Stebounova L, Guio E, Grassian V. Silver nanoparticles in simulated biological media: a study of aggregation, sedimentation, and dissolution. J Nanopart Res. 2011;13(1):233–244. [Google Scholar]
- 29.Silva RG, Nadagouda MN, Patterson CL, et al. Polymorph-dependent titanium dioxide nanoparticle dissolution in acidic and alkali digestions. Environ Sci Nano. 2014;1(3):284–292. [Google Scholar]
- 30.Cena LG, Anthony R, Peters TM. A personal nanoparticle respiratory deposition (NRD) sampler. Environ Sci Technol. 2011;45:6483–6490. doi: 10.1021/es201379a. [DOI] [PMC free article] [PubMed] [Google Scholar]


