Abstract
The identification of early distant metastases (DM) in patients with newly diagnosed, previously untreated nasopharyngeal carcinoma (NPC) plays an important role in selecting the most appropriate treatment approach. Here, we sought to investigate the predictive value of distinct MRI parameters for the detection of early DM.
Between November 2010 and June 2011, a total of 51 newly diagnosed NPC patients were included. All of the study participants were followed until December 2014 at a single institution after completion of therapy. DM was defined as early when they were detected on pretreatment FDG-PET scans or within 6 months after initial diagnosis. The following parameters were tested for their ability to predict early DM: pretreatment FDG-PET standardized uptake value (SUV), MRI-derived AJCC tumor staging, tumor volume, and dynamic contrast-enhanced (DCE) values. The DCE-derived ve was defined as the volume fraction of the extravascular, extracellular space.
Compared with patients without early DM, patients with early DM had higher SUV, tumor volume, DCE mean (median) ve, ve skewness, ve kurtosis, and the largest mean ve selected among sequential slices (P < 0.05). No differences were identified when early DM were defined only according to the results of pretreatment FDG-PET. Among different quantitative DCE parameters, the mean ve had the highest area under curve (AUC, 0.765). However, the AUCs of SUV, tumor volume, mean ve, ve skewness, ve kurtosis, or the largest mean ve selected among the sequential slices did not differ significantly from one another (P = 0.82).
Taken together, our results suggest that DCE-derived ve may be a useful parameter in combination with SUV and tumor volume for predicting early DM. Dynamic contrast-enhanced MRI may be complementary to FDG-PET for selecting the most appropriate treatment approach in NPC patients.
INTRODUCTION
Nasopharyngeal carcinoma (NPC) is endemic in southern Asia, with a reported annual incidence >20 cases per 100,000 persons per year.1 Definitive radiotherapy (RT) or concurrent chemoradiotherapy (CCRT) remain the mainstay of treatment for NPC.2,3 Current pretreatment diagnostic imaging modalities—including MRI and FDG-PET—can provide precise tumor delineation, ultimately improving the efficacy of intensity-modulated RT and widening the therapeutic window. Recently published data have shown that contemporary treatment protocols have markedly improved outcomes, with 5-year local control and nodal control rates of ∼90% and ∼95%, respectively.3 Unfortunately, the occurrence of distant metastases (DM) remains a major clinical issue, with a reported 5-year incidence as high as 28%.4,5 Efforts aimed at reducing failures from occult DM through the use of neoadjuvant or adjuvant chemotherapy in patients with advanced stages have been unsatisfactory.6 Beyond traditional prediction strategies based on AJCC staging, the development of new tools for identifying patients at risk of occult DM is eagerly awaited for improving treatment outcomes. Although different strategies have been proposed, their clinical utility and the reciprocal relationships among different parameters remain unclear.7,8 Several factors have been linked to the presence of occult DM, including tumor volume, angiogenesis, the percentage of hypoxic tumor cells, the fraction of connective tissue and necrosis, and the interstitial fluid pressure. Moreover, the risk of DM has been related to AJCC N-stage and standardized uptake values (SUV) on FDG-PET images.9,10 In contrast, the current T-stage has limited value in the prediction of DM-free survival.11
Dynamic contrast-enhanced (DCE) MRI is a method based on the acquisition of subsequent T1-weighted images before, during, and after the administration of a contrast agent (gadolinium) through a rapid scanning technique. DCE-MRI parameters have been successfully used for assessing tumor response to chemoradiation and antiangiogenesis therapies.12,13 Studies of DCE-MRI have been conducted for determining the response to treatment in patients with head and neck tumors, although no data on its usefulness for the detection of DM are currently available.7,13–15 However, semiquantitative DCE-MRI and the enhancement washout parameter have been shown to predict early DM in patients with breast cancer.7 In this scenario, we designed the present study to investigate the potential utility of FDG-PET and DCE-MRI in the identification of early DM in a cohort of 51 NPC patients followed for a median of 3 years. Specifically, quantitative parameters including SUV, tumor volume, and DCE-derived variables (ie, forward volumetric transfer constant [Ktrans], volume fraction of the extravascular extracellular space [EES] [ve], and volume fraction of blood plasma [vp]) were examined.
PATIENTS AND METHODS
Patient Characteristics and Treatment Modalities
The study protocol followed the tenets of the Helsinki declaration and ethical approval was granted by the local Institutional Review Board. The research was designed a retrospective review of prospectively collected data. Between November 2010 and June 2011, patients with newly diagnosed, histology-proven NPC were considered for inclusion. All patients with a World Health Organization classification type I (squamous cell carcinoma), type II (keratinizing and nonkeratinizing undifferentiated carcinoma), and papillary adenocarcinoma were deemed eligible. Staging was based on MRI and PET/CT imaging according to the AJCC staging system (seventh edition). Patients were treated according to the NCCN guidelines at a single tertiary medical center by a multidisciplinary head and neck cancer team.2 No patient received RT, but cisplatin-based CCRT was given with curative intent to all patients with stage II-IVB disease. Patients with DM (ie, stage IVC) were initially treated with chemotherapy and then switched to CCRT in the presence of a positive response. Patients with DM located in the cervicothoracic spine (ie, an area that could be covered by the RT field) were treated directly with CCRT.
Follow-Up Protocol
Patients were followed at the radiation oncology clinic every week during treatment, then every 3 months for 2 years, and every 4 months for the subsequent 2 years. The initial surveillance MRI and FDG-PET scans were performed within 6 months after RT completion, and then on a yearly basis. Patients with suspected disease recurrence underwent additional imaging. Whenever possible, fiberscopic-guided or imaging-guided biopsies were obtained in the presence of suspicious malignant lesions. If a lesion biopsy was not feasible or yielded negative results, close clinical and imaging follow-up was pursued for the subsequent 3 months. Patients with tumors confined to the primary site or the neck were classified as having local disease or regional residual/recurrent tumors. Patients with malignant disease beyond the head and neck region were classified as having DM. With regard to DM, patients were divided into the following 3 groups: patients without DM; patients with early DM (ie, DM identified before treatment or up to 6 months after the initial diagnosis); patients with late DM (ie, DM identified after >6 months from the initial diagnosis). Patients with DM identified within 6 months of treatment were categorized into the early DM group (because distant lesions were missed in the pretreatment staging workup and considered as occult). Cases with early DM diagnosed within 6 months of treatment were identified through surveillance FDG-PET and MRI scans and subsequently verified by pathology whenever possible. When pathological confirmation was not possible, patients were followed using clinical and imaging methods for at least 3 years.
MRI Imaging
DCE-MRI studies were performed on a 3T GE Discovery MR750 scanner (GE Healthcare, Waukesha, WI) with a dedicated head and neck coil. Initial T2-weighted anatomical scans were acquired by an expert radiologist (Chin SC) to select an axial plane through the tumor center. Twelve slices centered on this plane were collected for the DCE-MRI study. A 3-dimensional spoiled gradient-echo sequence with different flip angles was applied to obtain T1 maps before contrast injection (T10 maps). The imaging parameters were as follows: repetition time (ms)/echo time (ms) = 4.9/1.3, flip angle = 2, 5, 10, 20, and 30°, field-of-view = 256 × 256 mm, matrix size = 256 × 128, ASSET = 2, and slice thickness = 6 mm. The same sequence and parameters (the only exception being a fixed flip angle of 30°) were used for T1-weighted DCE-MRI. Sixty dynamic measurements were acquired during a total acquisition time of 234 s (sampling interval = 3.9 s). A bolus (0.1 mmol/kg) of a gadolinium-based contrast agent (Magnevist; Bayer Schering Pharma AG, Berlin, Germany) was injected through an antecubital vein using a power injector (injection rate = 4 mL/s). The injection of contrast agent began at the tenth measurement after starting of the dynamic scan. The postcontrast T1-weighted images were acquired after DCE-MRI acquisition.
Data Analysis
DCE-MRI data were analyzed using an in-house software platform (http://kyungs.bol.ucla.edu/software/), a freely available plug-in tool for OsiriX (an open-source medical imaging processing software) implemented in the Cocoa environment of Mac OS X.16 Quantitative MRI parameters (ie, individual tumor area, tumor volume, and Ktrans, ve, and vp based on the extended Tofts model) were obtained from either the entire tumor or individual slices. The MRI-derived primary tumor volume—including the gross tumor volume of the primary malignancy and possibly the confluent retropharyngeal nodes with indistinct margins—was calculated. Based on postcontrast axial T1-weighted images, the delineation of solid and enhancing nasopharyngeal tumor was performed slice-by-slice. Intratumor necrotic areas and encased vessels were avoided. The tumor ROIs were subsequently copied to physiological DCE-MRI parameters. The spoiled gradient echo signal equation was used to obtain the T10 map for each participant by fitting the images obtained with different flip angles, S(α):17
 |
where α is the flip angle and k is a proportional constant. To convert the DCE signal time curve, S(t), to the concentration time curve of the contrast agent, C(t), the following equation was used under the assumption that C(t) was proportional to the changes in the longitudinal relaxation rate, ΔR1(t):
 |
where S0 is the baseline signal before the bolus injection
R10 = 1/T10 and
The quantitative physiological parameters Ktrans, vp, and ve were obtained pixel-by-pixel using the extended Tofts model. The concentration time curves of the tissue, CT(t), were fitted to the following equation using the least-squares algorithm:
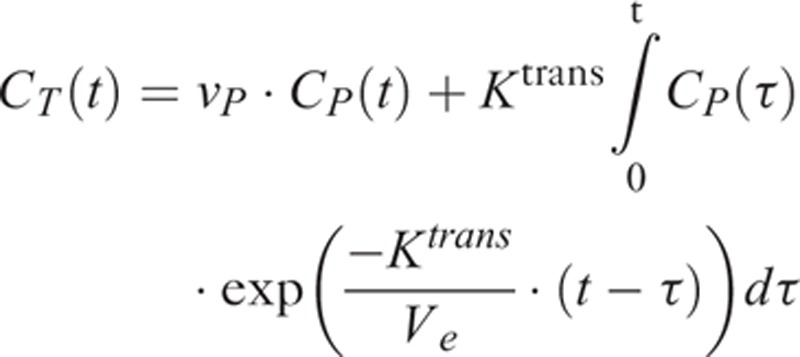 |
where CP(t) is the arterial input function obtained from a voxel in the internal carotid artery of each individual patient, detected using a semiautomated DCE tool in the OsiriX software.
We avoided necrotic tissue for analyzing DCE-MRI data using postcontrast T1 images as a reference to draw the tumor ROI. We did not include zero or unphysiological ve (ie, values not between 1 and 0) when analyzing all results, including the smallest mean ve selected among sequential slices.
PET/CT Imaging
PET/CT imaging was performed with a PET/CT scanner (Discovery ST 16 integrated PET/CT system; GE Healthcare, Milwaukee, WI ). Helical CT was performed from the head to proximal thigh before FDG-PET acquisition. PET/CT scans were performed 50 to 70 min after injection of 18F-FDG (370 MBq). PET images were obtained in the 2-dimensional mode with a 3-min scanning time per table position. CT images were used for attenuation correction of PET images and acquired with the following settings: 120 kV, automatic mA (ranging from 10 to 300 mA), pitch 1.75:1, collimation 16 × 3.75 mm, and rotation cycle 0.5 s. The maximal standardized uptake value (SUV) of the primary tumor was recorded.
Statistical Analysis
The OsiriX-generated DCE-MRI parametric values from the entire tumor volume and individual slices were analyzed with the SPSS software (version 17; SPSS Inc., Chicago, IL). The χ2 test, Fisher's exact test, and trend test were used to compare categorical variables, as appropriate. The Mann–Whitney U test was used for continuous parameters. We compared the accuracy of the prediction models using ROC analysis with simple logistic regression analysis. A 2-tailed P value < 0.05 was considered statistically significant.
RESULTS
Patient Characteristics
A total of 51 patients were included in the study. Of them, 37 (72.5%) were men. The median age was 48.68 years (range: 11–78 years; mean: 49.5 years; Table 1). The median follow-up time was 42 months (from January 2011 to December 2014). Eight (15.7%) patients had local recurrence, 10 (19.6%) neck nodal recurrence, and 15 (29.4%) DM. Patients were categorized into 3 groups according to the presence and timing of DM, as follows: no DM (n = 36), early DM (n = 9), and late DM (n = 6). In the early DM group, 6 patients were diagnosed by pretreatment FDG-PET imaging, whereas the remaining 3 were detected up to 6 months after the initial diagnosis.
TABLE 1.
General Characteristics of NPC Patients (n = 51)
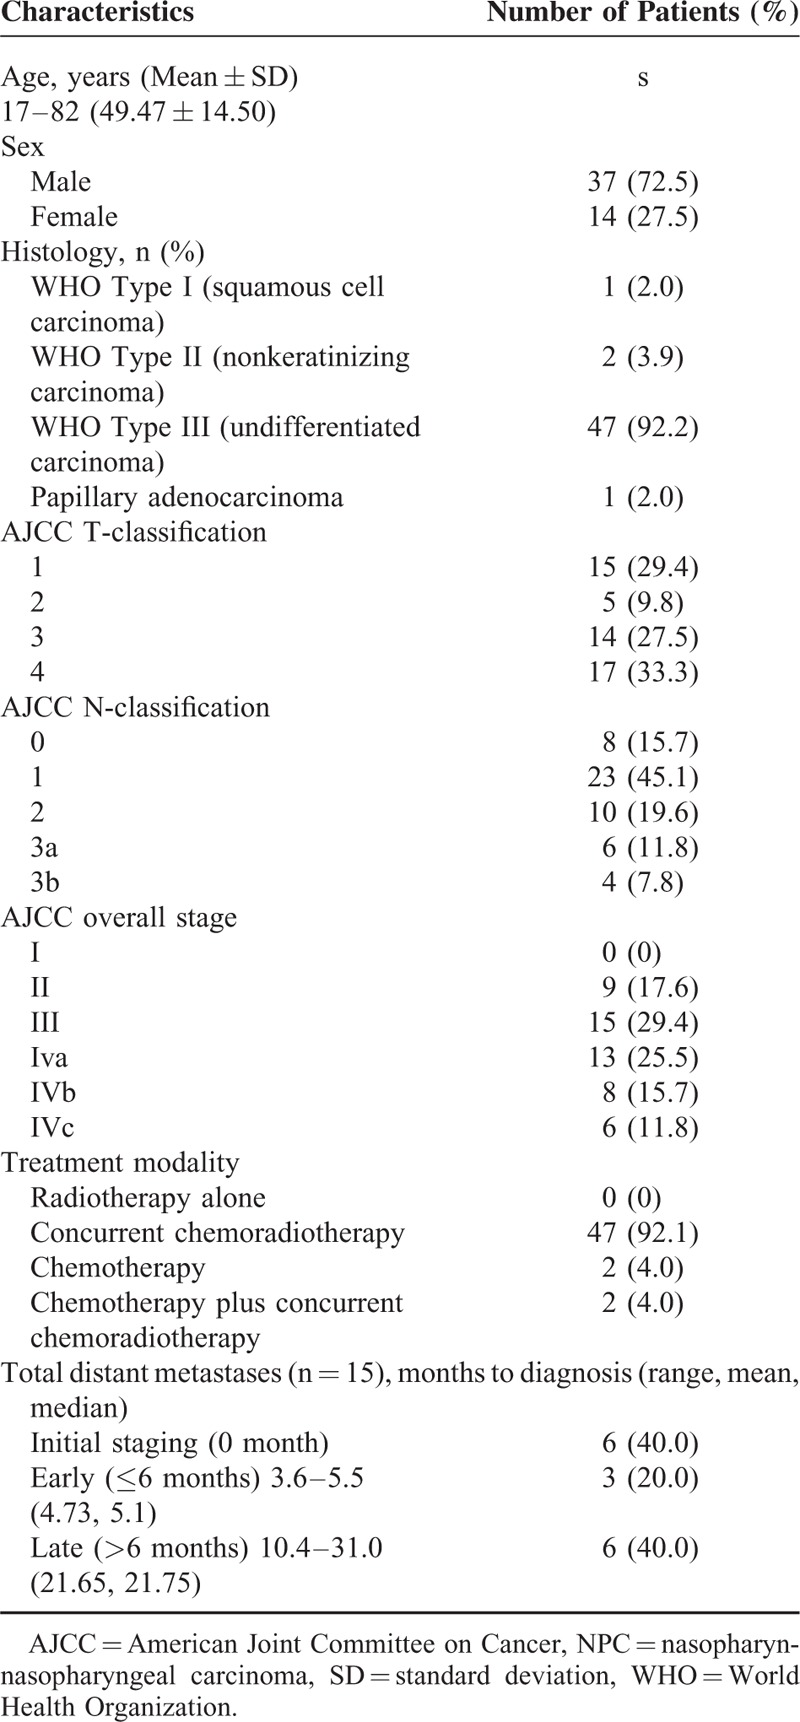
Table 2 depicts the clinical characteristics of patients with DM (n = 15). Cases # 8, 11, 16, 21, 31, and 51 were diagnosed in the pretreatment phase as having M1 disease. Of them, cases # 8 and 51 were treated with CCRT due to DM limited to the neck area. The remaining 4 cases received chemotherapy. Of them, cases # 11 and 21 were subsequently treated with CCRT because M1 lesions responded well. Figure 1 presents the co-registered pretreatment anatomical MR images and color-coded DCE-MRI ve maps for 2 patients with and without DM, respectively. Notably, case # 16 (having T1N2 disease) showed DM (lower tumor volume but higher ve_mean and ve_mean_slice_max). In contrast, case # 24 (having T4N3a disease) was free of DM (higher tumor volume but lower ve_mean and ve_mean_slice_max).
TABLE 2.
General Characteristics of NPC Patients With Distant Metastases (n = 15)
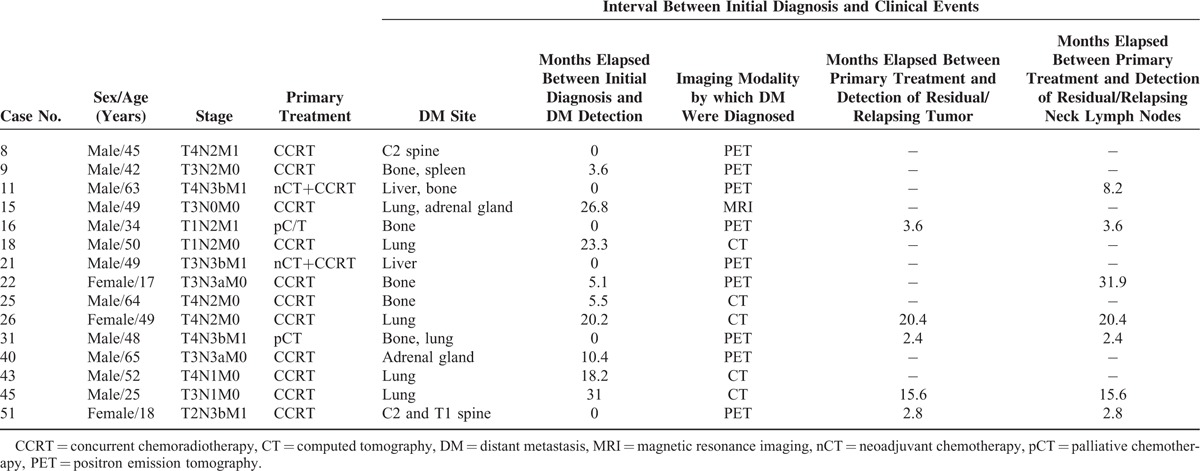
FIGURE 1.
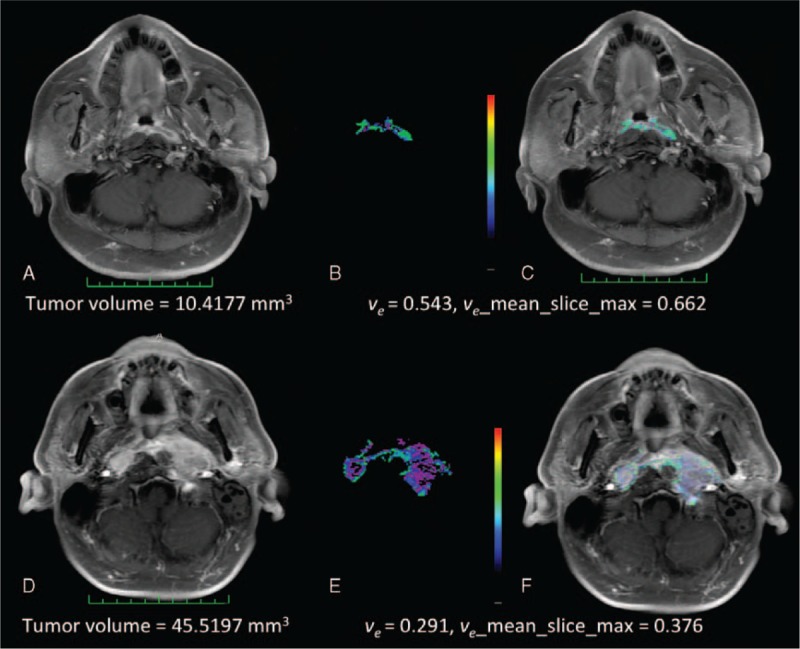
(A–F) Representative pretreatment MR images of 2 NPC patients. The upper row depicts a patient (case # 16, panels A–C) with an AJCC T1N2 malignancy and DM. The lower row depicts a patient (case # 24, panels D–F) with an AJCC T4N3a and no DM. The measurements of tumor volume (panels A, D), ve values (panels B, E), and overlying postcontrast T1WI (C, F) images are shown for comparison purposes. AJCC = American Joint Committee on Cancer, DM = distant metastases, MR = magnetic resonance, NPC = nasopharyngeal carcinoma.
Differences in Histology and AJCC TNM Parameters Between Early DM Group and Other Groups (No DM and Late DM)
We then divided the study participants in subjects with early DM (n = 9, 17.6%) and grouped together patients with either no DM or late DM (n = 42, 82.3%). Both AJCC N-classification and AJCC staging were significant predictors of early DM (both P < 0.001), whereas AJCC T-classification was not (P = 0.204; Table 3).
TABLE 3.
Relations Between AJCC Staging and Distant Metastases (Fisher's Exact Test)
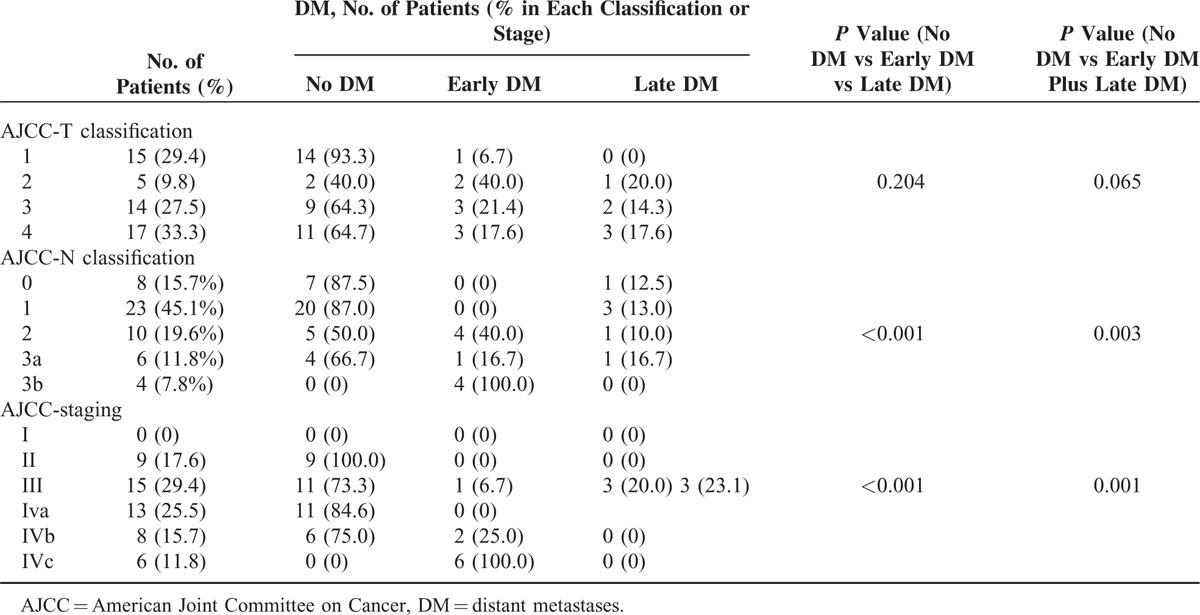
When all patients with DM were grouped together (early DM plus late DM), we found that the proportion of DM increased in parallel with the AJCC N-classification (N0 to N3b = 12.5%, 13.0%, 50.0%, 33.3%, and 100.0%, respectively; trend test, P = 0.001; Fisher's exact test, P = 0.003). The proportion of DM also increased significantly in parallel with the initial disease stage (stage I, II, III, IVa, and IVb = 0%, 0%, 26.7%, 23.1%, 25.0%, and 100.0%, respectively; trend test, P = 0.001; Fisher's exact test, P = 0.001). In contrast, the proportion of DM did not significantly increase according to the T-classification (T1 to T4 = 6.7 %, 60.0%, 35.7%, and 35.3%, respectively; trend test, P = 0.116, Fisher's exact test, P = 0.065; Table 3). In addition, the occurrence of early DM did not correlate with histology, possibly because the great majority of cases were classified as WHO Type III (92.2%, 47/51, data not shown in Table 3).
Differences in SUV, Tumor Volume, and Pharmacokinetic Parameters Between Early DM Group and Other Groups (No DM + Late DM)
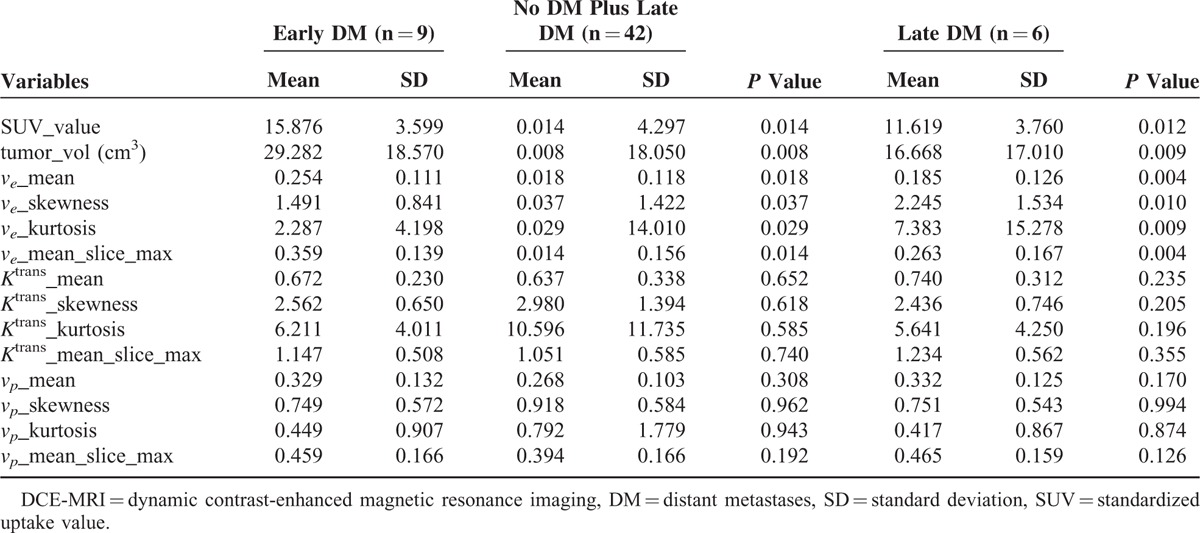
Table 4 compares the imaging parameters in the early DM group versus the no DM and late DM (combined) group. Both mean SUV and tumor volume were significantly higher in the early DM group than in the other group (SUV: 15.876 ± 3.599 [SD] vs 11.986 ± 4.297, respectively; P = 0.014; tumor volume [cm3]: 30.798 ± 18.844 vs 17.160 ± 18.050, respectively; P = 0.008). The mean ve of tumor volume was significantly higher in the early DM group than in the other group (0.249 ± 0.116 vs 0.186 ± 0.118, respectively; P = 0.018). We also observed a significantly higher mean ve selected among sequential slices in the early DM group than in the other group (0.359 ± 0.147 vs 0.265 ± 0.156, respectively; P = 0.014). In addition, the histographic patterns of ve skewness and kurtosis were significantly lower in the early DM group. Mean Ktrans and vp did not differ significantly in the 2 groups (P > 0.05). The differences in SUV, tumor volume, and ve-related parameters between the early DM and late DM groups were similar to those observed when the early DM group was compared with the no DM and late DM groups (Table 4). The analysis of median values produced similar results.
TABLE 4.
Comparisons of SUV, Tumor Volume, and DCE-MRI Parameters in the Early DM Group Versus No DM and Late DM Groups (Combined) and Early DM Group Versus Late DM Group (Mann–Whitney U Test)
Diagnostic Performance of SUV, Tumor Volume, and Pharmacokinetic Parameters in Differentiating Early DM, No, and Late DM Groups
Table 5 summarizes the AUCs, sensitivities, and specificities for differentiating the early DM group (n = 9) from the other groups (n = 42) using SUV, tumor volume, and ve-related parameters. Significant differences were identified between the 2 groups. The mean ve had the highest AUC (0.765) for distinguishing the early DM group from the other groups. In contrast, SUV showed the lowest AUC, the highest sensitivity, and the lowest specificity. However, no significant differences were identified between the AUCs of SUV, tumor volume, mean ve, ve skewness, ve kurtosis, or the largest mean ve selected among sequential slices (P = 0.82).
TABLE 5.
Diagnostic Accuracy of Clinical and Pharmacokinetic Parameters in the Detection of Early DM

DISCUSSION
The treatment approach for newly diagnosed NPC differs according to their AJCC TNM stage. In general, treatment with curative intent is not performed when DM are diagnosed before treatment. Currently, the detection of early DM is entirely based on the presence of FDG-avid lesions on pretreatment FDG-PET scans. In the present study, we hypothesized that pretreatment FDG-PET could underestimate the occurrence of early DM and investigated whether other imaging modalities may improve their diagnosis. Here, we tentatively included in the early DM group all of the patients with metastases detected up to 6 months after their initial diagnosis. The result revealed that SUV, tumor volume, and ve-related parameters had the potential to discriminate newly diagnosed NPC patients with early DM from those with either late or no DM (Figure 2). Patients with early DM generally showed larger tumor volume, SUV, and ve-related values than those with late DM and no DM. This difference was not evident when the early DM group was defined solely according to pretreatment FDG-PET results.
FIGURE 2.
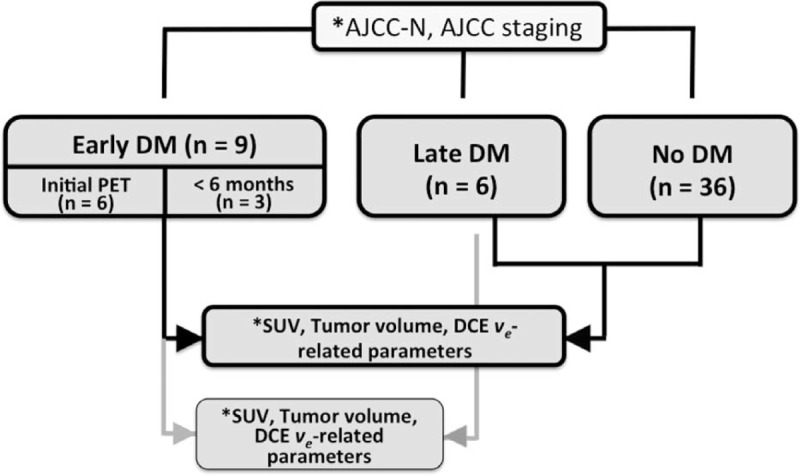
Flow of the participants through the study. Asterisk (∗) indicates statistically significant values, P < 0.05. The ve-related parameters included mean, median, skewness, and kurtosis of the entire tumor ve and the largest mean ve selected among sequential slices. AJCC-N = American Joint Committee on Cancer N-classification, DM = distant metastases.
Albeit limited by the small sample size, this pilot study shows the potential value of DCE-MRI compared with the traditional imaging modalities. Differently from pretreatment FDG-PET, conventional MRI does not currently allow a whole-body survey for the detection of DM. Our current findings indicate that DCE-MRI may be even superior to FDG-PET for the detection of early DM (occurring within 6 months from the initial diagnosis). Accordingly, some patients with early DM were missed when the initial FDG-PET scans were retrospectively reviewed. In line with previous studies, we failed to demonstrate a statistically significant association between the AJCC T-classification and DM. In contrast, the AJCC N-classification, AJCC staging, SUV, and tumor volume were found to predict the presence of DM in line with the published literature.9,18–20
DCE-MRI-derived parameters (including Ktrans and ve) as well as hypoxia and microvascular density are frequently used to assess several outcomes, including (1) tumor response to CCRT, (2) the presence of neck lymph node metastases, and (3) patient's prognosis. Preclinical research demonstrated an association between low ve and local tumor resistance as well as lymphogenous dissemination, but no data on the potential relationship with DM are available.21 Moreover, the potential mechanisms by which DCE-MRI parameters could be linked with metastatic spread remain to be established. DCE-MRI-derived ve—reflecting the extravascular extracellular space consisting of interstitial fluid and connective tissue, but not the vascular compartment—has been used as a proxy for tumor aggressiveness.22 In our study, we hypothesize that the tumor microenvironment associated with a large ve may promote metastatic dissemination before treatment and could be linked to a higher radiosensitivity to local treatment. Based on our clinical experience, tumors that are macroscopically less solid are more sensitive to RT but tend to metastasize distantly. The current findings may offer a potential explanation for this phenomenon. Accordingly, an elevated ve may be associated with a higher rate of early DM rate because it reflects the presence of an abundant and well vascularized extracellular space that may favor distant metastatic spread. Conversely, a high ve can be linked to a reduced likelihood of local recurrence because the most abundant and vascularized extracellular space portends a reduced risk of hypoxia and a better penetration of anticancer drugs. Unpublished observations from our group also suggest that compact tumors with a smaller ve are less likely to respond to RT and have a higher propensity for local recurrence. In this study, we did not specifically investigated whether the tumors had hypoxic components or the main underlying metastatic route (ie, hematogenous vs lymphatic spread). The risk of local recurrence may be explained by cell density and hypoxia inasmuch as higher ve values reflect a lower cell density and hypoxia. In contrast, the mechanisms underlying the occurrence of DM may be more complex (possibly involving different gene mutations facilitating the passage of cancer cells into the vascular and/or lymphatic systems). Two recent studies have shown the utility of pretreatment tumor ve for the prediction of treatment response, a clinical value which was not evident for other DCE-MRI parameters.23,24 Our current results are consistent with the published literature.
Identifying the largest and smallest Ktrans, ve, and vp values among sequential slices may be a concern, because tumor heterogeneity may be averaged out with an entire tumor volume approach.25,26 Histogram analysis is considered useful for exploring the significance of tumor heterogeneity. In particular, skewness reflects the pattern of value distribution, whereas kurtosis represents the position of the peak height indicating the values of maximum frequency. The histographic pattern of skewness and kurtosis of cerebral blood volume have been successfully utilized for differentiating early tumor progression from pseudoprogression in patients with newly diagnosed glioblastomas.27 Among the mean and median values of ve from entire tumor and individual slices, ve skewness and ve kurtosis were also found to be different between the early and late DM groups. Although our results showed that the skewness and kurtosis were useful parameters for differentiating the timing and occurrence of DM, further investigation using pixel-based histogram analysis of DCE-MRI data (rather than a ROI-based analysis) would be useful for further investigating the trend. Our findings did not support the value of Ktrans and vp for the identification of early DM, probably because Ktrans and vp are more closely linked to perfusion and permeability (thus being related to tumor angiogenesis). The lack of significant associations between these 2 parameters and early DM suggests that the angiogenic state of the primary NPC is not a main determinant of its metastatic spread.
Some caveats of the present study merit comment. The sample size was relatively small compared with previous studies conducted in NPC patients. Larger sample sizes are needed to increase the statistical power when comparing patients with early and late DM. Diffusion restriction reflects cell density in solid tumors, including head and neck malignancies.28–30 However, the association between ve and the apparent diffusion coefficient (ADC) may be questioned. In future studies, the collection of ADC data will be necessary to confirm the assumption that higher ve is a proxy for lower cell density. Finally, the potential incremental value of combining FDG-PET SUV and DCE-MRI parameters needs to be investigated in prospective studies.
CONCLUSION
FDG-PET imaging may underestimate the occurrence of early DM in NPC patients. Such lesions may probably become evident only in the presence of clinical manifestations and/or radiological progression. The reliable detection of early DM is of paramount importance for determining the most appropriate treatment alternatives. The results of this pilot study indicate that SUV, tumor volume, and ve-related parameters are potentially useful for achieving this goal. Increased ve reflects a lower tumor cell density and a higher likelihood of early metastatic spread. Notably, the statistically significant difference in ve values between patients with early DM and the other groups was not evident unless patients with DM occurring within 6 months of the initial diagnosis were included.
Footnotes
Abbreviations: AJCC = American Joint Committee on Cancer, AUC = area under curve, CCRT = concurrent chemoradiation, CT = computed tomography, DCE-MRI = dynamic contrast-enhanced magnetic resonance imaging, DM = distant metastases, FDG-PET = fluorodeoxyglucose positron emission tomography, Ktrans = forward volumetric transfer constant, NCCN = National Comprehensive Cancer Network, NPC = nasopharyngeal carcinoma, ROC = receiver operating characteristic, ROI = region of interest, RT = radiotherapy, SD = standard deviation, SUV = standardized uptake value, ve = volume fraction of the extravascular extracellular space, vp = volume fraction of blood plasma.
Funding: this work was financially supported by the Chang Gung Memorial Hospital and Chang Gung University (Grant CMRPG370093).
The authors have no conflicts of interest to disclose.
REFERENCES
- 1.Parkin DM, Whelan SL, Ferlay J, et al. World Health Organization, Cancer Incidence in Five Continents: Volumes I to VIII, IARC Cancer Base No 7. Lyon:2005. [Google Scholar]
- 2.Pfister DG, Spencer S, Brizel DM, et al. Head and neck cancers, version 1.2015. J Natl Compr Canc Netw 2015; 13:847–855.quiz 856. [DOI] [PMC free article] [PubMed] [Google Scholar]
- 3.Kam MK, Wong FC, Kwong DL, et al. Current controversies in radiotherapy for nasopharyngeal carcinoma (NPC). Oral Oncol 2014; 50:907–912. [DOI] [PubMed] [Google Scholar]
- 4.Ng WT, Lee MC, Hung WM, et al. Clinical outcomes and patterns of failure after intensity-modulated radiotherapy for nasopharyngeal carcinoma. Int J Radiat Oncol Biol Phys 2011; 79:420–428. [DOI] [PubMed] [Google Scholar]
- 5.Wang R, Wu F, Lu H, et al. Definitive intensity-modulated radiation therapy for nasopharyngeal carcinoma: long-term outcome of a multicenter prospective study. J Cancer Res Clin Oncol 2013; 139:139–145. [DOI] [PubMed] [Google Scholar]
- 6.Lee AW, Ngan RK, Tung SY, et al. Preliminary results of trial NPC-0501 evaluating the therapeutic gain by changing from concurrent-adjuvant to induction-concurrent chemoradiotherapy, changing from fluorouracil to capecitabine, and changing from conventional to accelerated radiotherapy fractionation in patients with locoregionally advanced nasopharyngeal carcinoma. Cancer 2015; 121:1328–1338. [DOI] [PubMed] [Google Scholar]
- 7.Baltzer PA, Zoubi R, Burmeister HP, et al. Computer assisted analysis of MR-mammography reveals association between contrast enhancement and occurrence of distant metastasis. Technol Cancer Res Treat 2012; 11:553–560. [DOI] [PubMed] [Google Scholar]
- 8.Ovrebo KM, Gulliksrud K, Mathiesen B, et al. Assessment of tumor radioresponsiveness and metastatic potential by dynamic contrast-enhanced magnetic resonance imaging. Int J Radiat Oncol Biol Phys 2011; 81:255–261. [DOI] [PubMed] [Google Scholar]
- 9.Chan SC, Chang JT, Wang HM, et al. Prediction for distant failure in patients with stage M0 nasopharyngeal carcinoma: the role of standardized uptake value. Oral Oncol 2009; 45:52–58. [DOI] [PubMed] [Google Scholar]
- 10.Mao YP, Liang SB, Liu LZ, et al. The N staging system in nasopharyngeal carcinoma with radiation therapy oncology group guidelines for lymph node levels based on magnetic resonance imaging. Clin Cancer Res 2008; 14:7497–7503. [DOI] [PubMed] [Google Scholar]
- 11.Sun Y, Tang LL, Chen L, et al. Promising treatment outcomes of intensity-modulated radiation therapy for nasopharyngeal carcinoma patients with N0 disease according to the seventh edition of the AJCC staging system. BMC Cancer 2012; 12:68. [DOI] [PMC free article] [PubMed] [Google Scholar]
- 12.Jain R, Gutierrez J, Narang J, et al. In vivo correlation of tumor blood volume and permeability with histologic and molecular angiogenic markers in gliomas. AJNR Am J Neuroradiol 2011; 32:388–394. [DOI] [PMC free article] [PubMed] [Google Scholar]
- 13.Yoo DS, Kirkpatrick JP, Craciunescu O, et al. Prospective trial of synchronous bevacizumab, erlotinib, and concurrent chemoradiation in locally advanced head and neck cancer. Clin Cancer Res 2012; 18:1404–1414. [DOI] [PubMed] [Google Scholar]
- 14.Chawla S, Kim S, Loevner LA, et al. Prediction of disease-free survival in patients with squamous cell carcinomas of the head and neck using dynamic contrast-enhanced MR imaging. AJNR Am J Neuroradiol 2011; 32:778–784. [DOI] [PMC free article] [PubMed] [Google Scholar]
- 15.Jansen JF, Schoder H, Lee NY, et al. Tumor metabolism and perfusion in head and neck squamous cell carcinoma: pretreatment multimodality imaging with 1H magnetic resonance spectroscopy, dynamic contrast-enhanced MRI, and [18F]FDG-PET. Int J Radiat Oncol Biol Phys 2012; 82:299–307. [DOI] [PMC free article] [PubMed] [Google Scholar]
- 16.Rosset A, Spadola L, Ratib O. OsiriX: an open-source software for navigating in multidimensional DICOM images. J Digit Imaging 2004; 17:205–216. [DOI] [PMC free article] [PubMed] [Google Scholar]
- 17.Deoni SC, Rutt BK, Peters TM. Rapid combined T1 and T2 mapping using gradient recalled acquisition in the steady state. Magn Reson Med 2003; 49:515–526. [DOI] [PubMed] [Google Scholar]
- 18.Chen KW, Wang WY, Liang WM, et al. The volume of retropharyngeal nodes predicts distant metastasis in patients with advanced nasopharyngeal carcinoma. Oral Oncol 2011; 47:1171–1175. [DOI] [PubMed] [Google Scholar]
- 19.Guo R, Sun Y, Yu XL, et al. Is primary tumor volume still a prognostic factor in intensity modulated radiation therapy for nasopharyngeal carcinoma? Radiother Oncol 2012; 104:294–299. [DOI] [PubMed] [Google Scholar]
- 20.Lee CC, Huang TT, Lee MS, et al. Clinical application of tumor volume in advanced nasopharyngeal carcinoma to predict outcome. Radiat Oncol 2010; 5:20. [DOI] [PMC free article] [PubMed] [Google Scholar]
- 21.Ovrebo KM, Ellingsen C, Hompland T, et al. Dynamic contrast-enhanced magnetic resonance imaging of the metastatic potential of tumors: a preclinical study of cervical carcinoma and melanoma xenografts. Acta Oncologica 2013; 52:604–611. [DOI] [PubMed] [Google Scholar]
- 22.Benjaminsen IC, Brurberg KG, Ruud EB, et al. Assessment of extravascular extracellular space fraction in human melanoma xenografts by DCE-MRI and kinetic modeling. Magn Reson Imaging 2008; 26:160–170. [DOI] [PubMed] [Google Scholar]
- 23.Ng SH, Lin CY, Chan SC, et al. Clinical utility of multimodality imaging with dynamic contrast-enhanced MRI, diffusion-weighted MRI, and 18F-FDG PET/CT for the prediction of neck control in oropharyngeal or hypopharyngeal squamous cell carcinoma treated with chemoradiation. PloS One 2014; 9:e115933. [DOI] [PMC free article] [PubMed] [Google Scholar]
- 24.Schmitz S, Rommel D, Michoux N, et al. Dynamic contrast-enhanced computed tomography to assess early activity of cetuximab in squamous cell carcinoma of the head and neck. Radiol Oncol 2015; 49:17–25. [DOI] [PMC free article] [PubMed] [Google Scholar]
- 25.Mayr NA, Huang Z, Wang JZ, et al. Characterizing tumor heterogeneity with functional imaging and quantifying high-risk tumor volume for early prediction of treatment outcome: cervical cancer as a model. Int J Radiat Oncol Biol Phys 2012; 83:972–979. [DOI] [PMC free article] [PubMed] [Google Scholar]
- 26.Yuh WT, Mayr NA, Jarjoura D, et al. Predicting control of primary tumor and survival by DCE MRI during early therapy in cervical cancer. Invest Radiol 2009; 44:343–350. [DOI] [PMC free article] [PubMed] [Google Scholar]
- 27.Baek HJ, Kim HS, Kim N, et al. Percent change of perfusion skewness and kurtosis: a potential imaging biomarker for early treatment response in patients with newly diagnosed glioblastomas. Radiology 2012; 264:834–843. [DOI] [PubMed] [Google Scholar]
- 28.Chawla S, Kim S, Dougherty L, et al. Pretreatment diffusion-weighted and dynamic contrast-enhanced MRI for prediction of local treatment response in squamous cell carcinomas of the head and neck. AJR Am J Roentgenol 2013; 200:35–43. [DOI] [PMC free article] [PubMed] [Google Scholar]
- 29.Hompland T, Ellingsen C, Galappathi K, et al. Connective tissue of cervical carcinoma xenografts: associations with tumor hypoxia and interstitial fluid pressure and its assessment by DCE-MRI and DW-MRI. Acta Oncologica 2014; 53:6–15. [DOI] [PubMed] [Google Scholar]
- 30.Kickingereder P, Wiestler B, Sahm F, et al. Primary central nervous system lymphoma and atypical glioblastoma: multiparametric differentiation by using diffusion-, perfusion-, and susceptibility-weighted MR imaging. Radiology 2014; 272:843–850. [DOI] [PubMed] [Google Scholar]


