Abstract
Background
Colon adenocarcinoma mostly happens at the junction of the rectum and is a common gastrointestinal malignancy. Accumulated evidence has indicated that colon adenocarcinoma develops by genetic alterations and is a complicated disease. The aim of this study was to screen differentially expressed miRNAs (DEMs) and genes with diagnostic and prognostic potentials in colon adenocarcinoma.
Material/Methods
In this study we screened DEMs and their target genes (DEGs) between 100 colon adenocarcinoma and normal samples in The Cancer Genome Atlas (TCGA) database by using the DEseq toolkit in Bioconductor. Then Go enrichment and KEGG pathway analysis were performed on the selected differential genes by use of the DAVID online tool. A regulation network of miRNA-gene was constructed and analyzed by Cytoscape. Finally, we performed ROC analysis of 8 miRNAs and ROC curves were drawn.
Results
A total of 159 DEMs and 1921 DEGs were screened, and 1881 pairs of miRNA-target genes with significant negative correlations were also obtained. A regulatory network of miRNA-gene, including 60 cancer-related genes and 47 miRNAs, was successfully constructed. In addition, 5 clusters with several miRNAs regulating a set of target genes simultaneously were identified through cluster analysis. There were 8 miRNAs involved in these 5 clusters, and these miRNAs could serve as molecular biomarkers to distinguish colon adenocarcinoma and normal samples indicated by ROC analysis.
Conclusions
The identified 8 miRNAs were closely associated with colon adenocarcinoma, which may have great clinical value as diagnostic and prognostic biomarkers and provide new ideas for targeted therapy.
MeSH Keywords: Adenocarcinoma, Gene Expression Profiling, Gene Regulatory Networks
Background
Colon adenocarcinoma ranks the third leading cause of cancer mortality worldwide and the annually death number is increasing. Although the current adjuvant treatment modalities may improve survival for some colon adenocarcinoma patients to a certain extent, others benefit little [1]. Moreover, recently accumulated evidence indicates that colon adenocarcinoma is a genetically heterogeneous and complicated disease caused by abnormalities in gene structure and/or expression [2]. Therefore, it is important to identify novel biomarkers with diagnostic and prognostic potentials in colon adenocarcinoma and to develop new targeted therapy.
Recently, MicroRNAs (miRNAs) have become a focus in cancer research. miRNAs are a class of endogenous, small, noncoding RNA molecules (18–25 nucleotides), able to repress protein translation by binding to the target mRNAs [3]. miRNAs have critical regulatory roles in several basic cellular processes, such as differentiation and proliferation, which may affect some major biological systems, like cancer [4]. In addition, miRNAs can target up to hundreds of mRNAs, which makes them very powerful regulators. Aberrant miRNA expression can disturb a multitude of cell signaling pathways and profoundly influence cancer onset and progression. Changes in the expression of miRNAs have been observed in a variety of human tumors, including colon adenocarcinoma [5]. Currently, there are 2 major approaches applied to explore the relationships between miRNAs and colon adenocarcinoma. One is that miRNAs can regulate many known oncogenic and tumor suppressor pathways involved in the pathogenesis of colon adenocarcinoma. For example, p53, a well-known tumor suppressor gene, has been found to be mutated in about 40–50% of colon adenocarcinoma [6]. Recent studies have proved there are important connections between miRNAs and p53 [7]. The other is that expression profiles of various miRNAs may show potentials as biomarkers for prediction of prognosis and a distinction of certain diseases, including colon adenocarcinoma. It was reported that patients with overexpressed miR-21 have worse survival prognosis for stage II or stage III colon adenocarcinoma [5,8].
In this study, we analyzed the expression data of miRNAs of colon adenocarcinoma in The Cancer Genome Atlas (TCGA) database and screened the differentially expressed miRNAs (DEMs) and their target genes (DEGs). Through constructing a regulation network of miRNA-gene by Cytoscape, we hoped to discover new biomarkers with diagnostic and prognostic potentials and contribute to the diagnosis and therapy of colon adenocarcinoma.
Material and Methods
miRNA data
The colorectal adenocarcinoma miRNASeq and level 3 RNAseq data were downloaded from the TCGA database. There were a total of 228 samples, including 220 colon adenocarcinoma and 8 normal samples; these data were classified into 2 cohorts. Each sample consisted of the corresponding miRNA-seq and RNA-seq data. The sequenced data generated from IlluminaHiSeq_miRNASeq and IlluminaHiSeq_RNASeq sequencing platforms were all publicly available data; therefore, no ethical issues were involved. The study was conducted in accordance with the Declaration of Helsinki and with approval from the Ethics Committee of Kunming Medical University.
Data preprocessing
Because the data came from a public platform, sample source, development degree of cancer, and cancer subtypes may affect the subsequent analysis. Therefore, the samples were firstly analyzed by Hierarchical Clustering algorithm and then grouped based on gene expression (RSEM value) level [9]. Tumor samples with similar gene molecular type were selected and miRNA data corresponding to samples were further screened.
After tumor sample and normal sample data were combined, the miRNA data and gene data with no expression were filtered, so as to ensure there was at least 1 count average in each sample for every participated miRNA and gene.
Differential expression analysis
The cancer samples and normal samples in each group were all subjected to differential expression analysis using DESeq toolkits in Bioconductor [10]. Then we carried out differential expression analysis after standardization and variance estimation. The standards for screening the expression differences of miRNA and gene were P<0.001, FDR <0.001, and | log2 FC |>2.
Screening of target genes
We predicted and screened the candidate target genes of DEMs using v6.2 TargetScan Human Database [11]. For the predicted “miRNA-target gene” relationships, we calculated the Pearson correlation coefficient between their gene expression levels according to the expression data [12]. Due to the inhibition of miRNA on the expression of its target genes, the “miRNA-target gene” relationship that the expression of target gene was significantly negatively associated with miRNA should have biological significance. The screening criterion was correlation coefficient r <–0.3, P <0.05.
Annotation of DEGs
The DAVID tool was utilized to execute GO enrichment, KEGG pathway analysis, annotation and analysis of related diseases on the DEGs. Benjamini method was used to conduct multiple testing correction, and P<0.05 was considered as the significantly enriched threshold [13].
Construction of a miRNA-gene interaction network
As the interactions among differentially expressed cancer genes came from IntAct and reactome database, the data from 2 databases were merged according to the set of node and edge [14,15]. The relationships between target genes of the DEMs were integrated into the interaction network. Finally, the network topology was generated by Cytoscape 3.2.0 [16,17].
Analysis of miRNA-gene interaction network
Some basic properties of the network, including Edge Count In degree, Out degree, Betweenness Centrality, Clustering Coefficient, and Closeness Centrality parameters, were analyzed by built-in tools in Cytoscape. The key nodes with different biological significance in the network were filtered based on these parameters.
Network clustering is an important means to identify functional modules, which not only helps understand the organizational structure of biological systems, but also contributes to predicting biomolecule functions. CytoCluster plugin can be used to identify gene clusters in the sub-network constructed by miRNA and its target gene (http://apps.cytoscape.org/apps/cytocluster). IPCA algorithm was used in cluster identification with default parameters. The identified clusters were further filtered, and only the network clusters of the same target genes commonly regulated by more than 2 miRNAs were retained.
Analysis of the receiver operating characteristic
We performed ROC analysis on 8 miRNAs in the commonly controlled network cluster, based on the miRNA expression data of patients by pROC packet in R language. The corresponding miRNA expression was arranged sequentially and patients’ diseased states were marked (status, tumor sample was 1, normal sample was 0) one by one, the area under the ROC curve (AUC) was calculated and the ROC curve was drawn.
Statistical analysis
Statistical analysis was done using SPSS software (version 17.0, SPSS, New York, NY, USA). All the data are presented as mean ± standard deviation (SD), and comparison among the groups were done using a single-factor analysis of variance (one-way ANOVA). P<0.05 was considered as statistically significant.
Results
Data preprocessing
We conducted clustering analysis of the gene expression profile of 220 colon adenocarcinoma samples, and then selected a total of 100 samples consisting of a group of 92 tumor samples with similar molecular type and 8 normal samples, which contained 20 531 genes. We selected 705 miRNA data corresponding to the 100 samples for further analysis.
Differential expression analysis
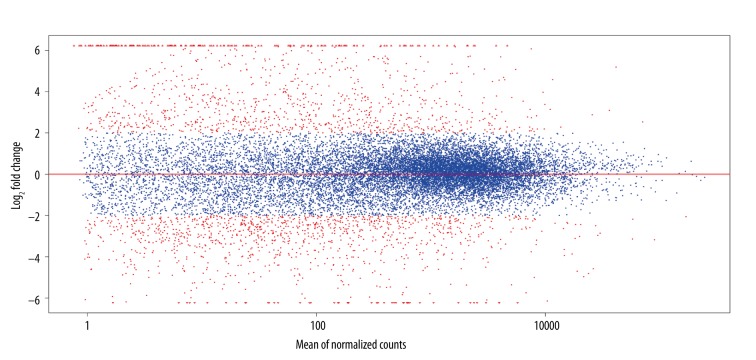
A total of 1921 genes showed significant expression differences (P<0.01, FDR<0.01). Compared to normal samples, 802 genes were up-regulated, while 1119 genes were down-regulated in cancer samples (Figure 1).
Figure 1.
The expression and multiple relationships of differentially expressed genes between tumor samples and normal samples. The ordinate shows the multiple relationships of gene expression changes after log2 conversion, while the abscissa shows gene count value. Red dots represent genes with | log2FC | >2.
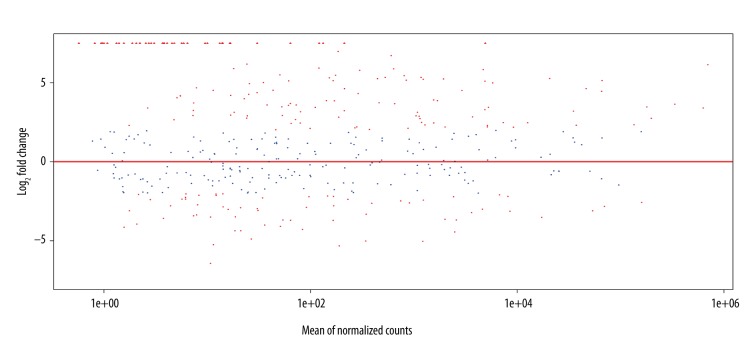
Differential expression analysis of the miRNA expression profiles showed there were 159 miRNAs exhibited significant differences (P<0.01, FDR<0.01). Comparing to normal samples, 96 miRNA were up-regulated while 63 down-regulated in cancer samples (Figure 2).
Figure 2.
The expression and multiple relationships of differentially expressed miRNAs between tumor samples and normal samples. The ordinate shows the multiple relationships of miRNA expression changes after log2 conversion, while the abscissa shows miRNA count value. Red dots represent miRNAs with | log2FC | >2.
Screening of miRNAs and target gene
We obtained 9146 pairs of “miRNA-target gene” interaction relationships through prediction of the target relations between DEMs and genes by TargetScan software. We screened 1881 pairs of “miRNA-target gene” interaction relationships with significantly negative correlations (r<–0.3, P<0.01), with a total of 413 genes and 126 miRNAs involved. The differential relationships and correlation strength between miRNA and target gene are shown in Figure 3. The results indicate the “miRNA-target genes” relationships with significant correlations in tumor samples occurred between the up-regulated miRNAs and down-regulated genes.
Figure 3.
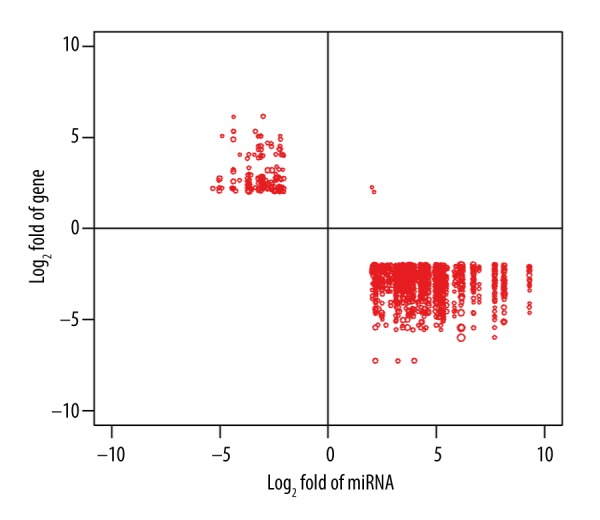
The expression variations between miRNA and its target genes and their correlations. The ordinate and abscissa show the fold variation of target genes and miRNA, respectively. Dot size indicates the correlation coefficient between miRNA expression and its target genes.
GO, KEGG and disease annotation
We used 1978 DEGs to perform disease annotation, among which 105 DEGs were associated with cancer, and 44 with colon adenocarcinoma or colorectal cancer; while in 413 target genes of miRNA, 26 were associated with cancer and 10 with colon adenocarcinoma or colorectal cancer (Table 1).
Table 1.
Genes associated with miRNA regulated colorectal adenocarcinoma or colorectal cancer.
| Genes | Change fold | Targeted miRNAs |
|---|---|---|
| ADRB2 | −2.386 | hsa-mir-98 |
| CASR | −3.841 | hsa-mir-15a, hsa-mir-16-1, hsa-mir-429 |
| CXCL12 | −2.356 | hsa-mir-101-1, hsa-mir-135b, hsa-mir-19a, hsa-mir-19b-1, hsa-mir-19b-2, hsa-mir-454 |
| CDKN2B | −3.868 | hsa-mir-582 |
| DPYD | −2.269 | hsa-mir-32 |
| ESR1 | −2.005 | hsa-mir-148a, hsa-mir-188, hsa-mir-18a, hsa-mir-190, hsa-mir-19a, hsa-mir-19b-1, hsa-mir-19b-2, hsa-mir-26b, hsa-mir-301a, hsa-mir-337, hsa-mir-454, hsa-mir-590, hsa-mir-660 |
| IGF1 | −2.203 | hsa-mir-148a, hsa-mir-152, hsa-mir-203, hsa-mir-590 |
| MMRN1 | −2.763 | hsa-mir-374a |
| MRC1 | −2.061 | hsa-mir-450b |
| PTGS1 | −2.252 | hsa-mir-148a, hsa-mir-152, hsa-mir-203, hsa-mir-590 |
Through KEGG annotation and enrichment analysis of the 413 target genes, we obtained 3 significantly enriched pathways, including calcium signaling pathway, neuroactive ligand-receptor interaction pathway, and axon guidance pathway.
Through GO annotation and enrichment analysis of the 413 target genes, we revealed the roles of gene products from biological processes, cellular localization, and molecular function). The most significant comment in enrichment analysis results showed the main aspect of biological processes was closely associated with ion transport; intracellular localization showed the gene products were mainly located on the membrane; molecular function also showed that the main function of the gene product was related to metal ion and calcium ion transportation. All these comments results coincided with that of the KEGG pathway.
Analysis of miRNA-Gene regulatory network for colon adenocarcinoma
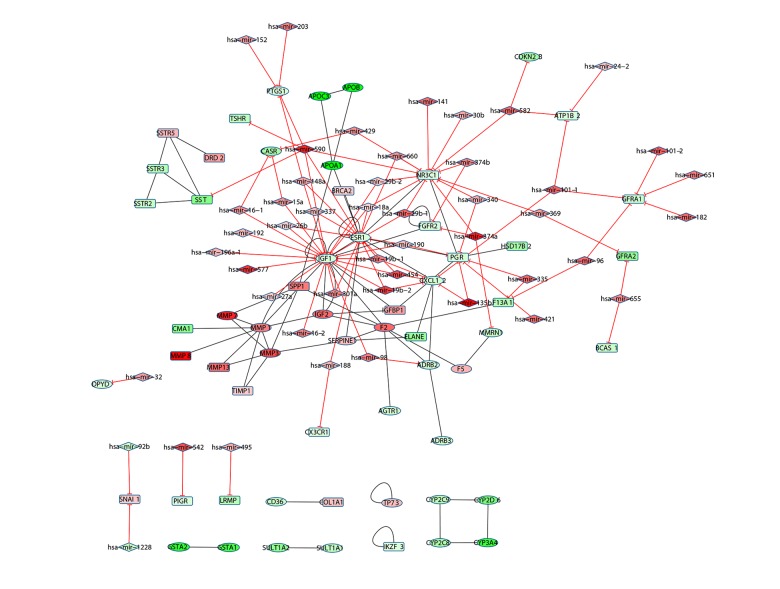
A miRNA-Gene regulatory interaction network (Figure 4) consisting of differentially expressed genes was eventually constructed after the data in IntAct and Reactome database were merged. The network contained a total of 107 nodes and 153 pairs of interaction relationships. The nodes contained a total of 47 miRNAs and 60 cancer-related genes, wherein 32 cancer genes were associated with colon adenocarcinoma or colorectal cancer. In this regulatory interaction network, 63 nodes were up-regulated (red) and 44 were down-regulated (green).
Figure 4.
miRNA-Gene interaction network of colon adenocarcinoma. The diamond nodes represent colon adenocarcinoma-related miRNAs and the rounded rectangle nodes represents other cancer-related miRNAs. The side with the red T-shaped arrow indicates the regulation relationship between miRNA and gene, and the black edge indicates the interaction between gene products. The colors of nodes indicate the fold change of miRNA or gene expression; green means down-regulated and red means up-regulated.
In a network, the nodes often connected to many peripheral nodes were referred to as hub nodes. In the miRNA-gene network of colon adenocarcinoma, sorted according to the descending number of connections, the top 10% of nodes were IGF1, ESR1, NR3C1, PGR, MMP1, F2, CXCL12, MMP3, hsa-mir-590, FGFR2, IGF2, and GFRA1. IGF1, ESR1, MMP1, F2, CXCL12, MMP3, IGF2 had already been identified as colon adenocarcinoma-related genes. Although NR3C1and PGR were not annotated to be colon adenocarcinoma-related genes, they were also associated with other cancers, and their statuses in connection with other genes were second only to IGF1 and ESR1. Therefore, we speculated that these 2 genes had significant relationships with colon adenocarcinoma.
Five network clusters with many miRNAs regulating the target genes collectively were obtained by network cluster analysis (Figure 5), involving a total of 8 miRNAs, including hsa-mir-454, hsa-mir-19b-1, hsa-mir-19b-2, hsa-mir-590, hsa-mir-18a, hsa-mir-148a, hsa- mir-301a, and hsa-mir-26b. NR3C1 combined with IGF1 and ESR1 were regulated by hsa-mir-590 and hsa-mir-18a collectively, indicating that NR3C1 may be also associated with colon adenocarcinoma.
Figure 5.
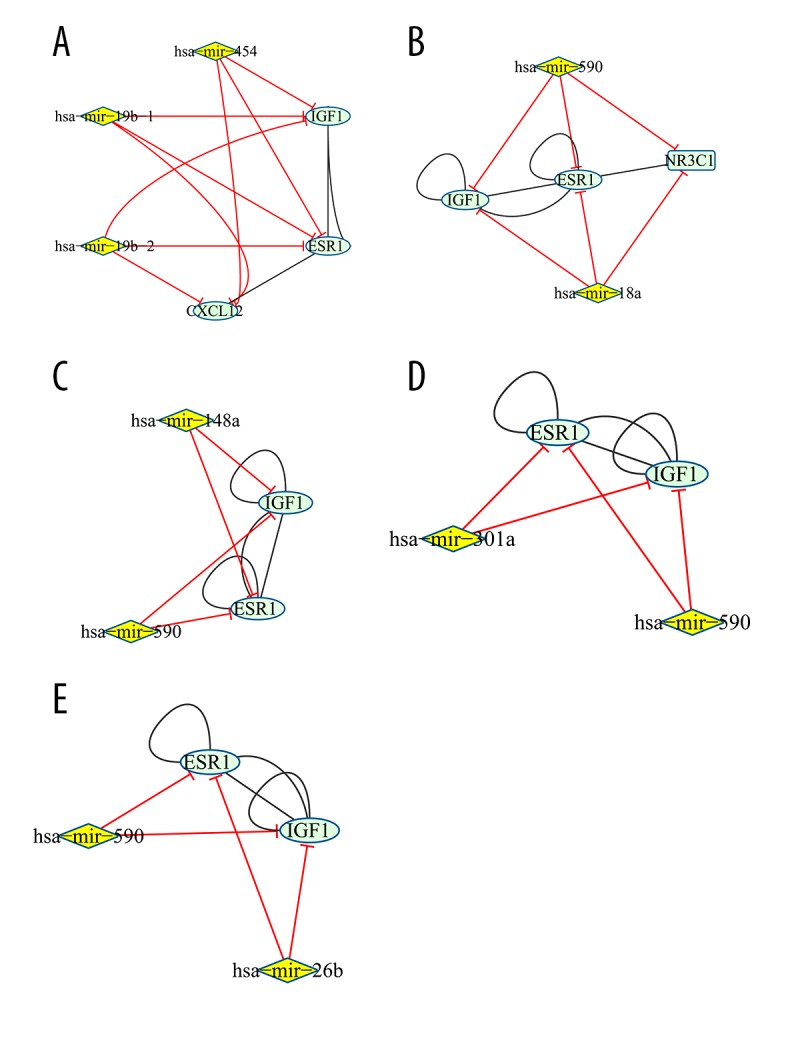
The clusters of target genes jointly regulated by miRNA in miRNA-Gene network. Yellow node and blue green node represent miRNA and target gene, respectively. The red edge represents the relationship between miRNA and gene, while the black edge represents the interaction relationships of gene products.
ROC analysis
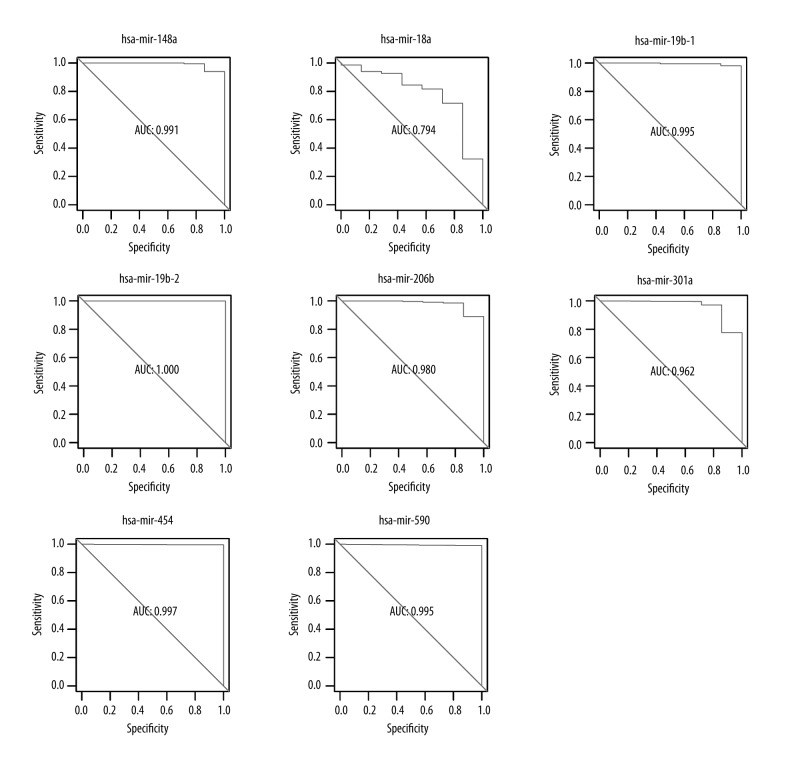
The ROC analysis of 8 miRNAs that synergistically regulated colon adenocarcinoma-related genes showed they were suitable to be used as bio-molecular markers to distinguish tumor and normal samples. Sorted according to the descending size of AUC, they were hsa-mir-19b-2 (1.000), hsa-mir-454 (0.997), hsa-mir-19b-1 (0.995), hsa-mir-590 (0.995), hsa-mir-148a (0.991), hsa-mir-26b (0.980), hsa-mir-301a (0.962), and hsa-mir-18a (0.794).
Discussion
In this study, we constructed a miRNA-gene regulatory network through analysis of the differentially expressed miRNAs and their target genes between colon adenocarcinoma and normal samples. GO annotation and KEGG pathway analysis showed these target genes were mainly enriched in ion, especially calcium ion (Ca2+) transportation. Ca2+ can regulate various cellular processes through activating or inhibiting cellular signaling pathways and many Ca2+-mediated signaling pathways are involved in tumorigenesis, such as invasion and metastasis [18]. It was reported the aberrant expression of some Ca2+ channels or pumps may be associated with tumorigenesis. For example, TRPM8 is over-expressed in prostate cancer while SERCA3 is down-regulated in colon adenocarcinoma [19]. Considering the ability of Ca2+ signaling to regulate pathways like proliferation or apoptosis, alteration of Ca2+ channels or pumps in cancers may be considered as therapeutic targets. Furthermore, many pharmacological agents can modulate Ca2+ channels and pumps; thus, they are regarded as druggable. Previous studies also found that changes in the ER Ca2+ pump SERCA3 were extensively characterized in colon adenocarcinoma [20,21], which suggests that Ca2+ pump or the genes regulating them could serve as anticancer therapeutic targets for colon adenocarcinoma.
In the constructed miRNA-gene network, several genes, including IGF1, ESR1, MMP1, and F2, were already known as colon adenocarcinoma-related genes. For example, insulin-like growth factor-1 (IGF-1) is one of the factors contributing to the increased risk in colon cancer [22]. IGF-1 can activate many signaling pathways involved in carcinogenesis, such as PI3K/Akt, MAPK, and STAT3 [23]. Inhibition of these pathways may have preventive and therapeutic potential. Estrogen receptor-alpha (ESR1) was also shown to increase colon cancer cell proliferation and increase cancer incidence. Although NR3C1and PGR genes were not annotated to be colon adenocarcinoma-related, they were associated with other cancers. The nuclear receptor subfamily 3, group C, member 1 (NR3C1) is a gene that exists in the cytoplasm in a multiprotein complex, and it can encode glucocorticoid receptor. The expression level of NR3C1 was an important factor for glucocorticoid sensitivity [24]. Evidence shows that NR3C1 displayed methylation in carcinomas and some adenomas, and it was identified as a novel target gene inactivated by promoter hypermethylation during colorectal cancer development, indicating it may appear occasionally in the early events in colorectal cancer development [25]. PGR (progesterone receptor) status was also shown to exert a significant impact on prognosis of ER+/HER2– breast cancer [26]. It was found that PGR positivity correlated with response to tamoxifen therapy, both in the adjuvant setting and metastatic setting. Thus, the PGR status could serve as an independent predictive factor for survival [27–29]. In addition, NR3C1and PGR statuses in connection to other genes were second only to IGF1 and ESR1. Therefore, we speculated that these 2 genes may also have significant relationships with colon adenocarcinoma.
Finally, we obtained 8 miRNAs (hsa-mir-454, hsa-mir-19b-1, hsa-mir-19b-2, hsa-mir-590, hsa-mir-18a, hsa-mir-148a, hsa-mir-301a, and hsa-mir-26b) regulating colon adenocarcinoma-related genes and they may be considered as biomarkers for distinguishing colon tumor samples and normal samples. miR-590 was found to be a complement region of RhoB gene [30]. RhoB is known to show tumor suppressor activity, and its down-regulation was related to many changes, such as migration and adhesion in aggressive tumors. Studies indicated that RhoB could be considered as an important target for miR-590 in regulating cell proliferation and invasion in colorectal cancer [31]. He et al. reported that in clinical colorectal cancers, the expression level of miR-17-92 was up-regulated in 15% of tested samples and showed 4-fold up-regulation of the corresponding normal tissues [32]. Moreover, it was demonstrated that patients with high expression of miR-18a tended to have a poorer prognosis than patients with expression group [33]. Therefore, the expression of miR-18a was believed to be a prognostic factor for predicting survival of colorectal cancer patients. As in the expression of miR-18a, metastatic lymph node ratio is also an important prognostic factor of colorectal cancer patients. Expression of miR-18a at metastatic lymph nodes may decrease the prognosis [34]. Moreover, NR3C1combined with IGF1and ESR1 were all regulated by hsa-mir-590 and hsa-mir-18a, further indicating that NR3C1 was related to colon adenocarcinoma.
Conclusions
We successfully constructed a miRNA-Gene regulatory network, which involved 60 cancer-related genes and 47 miRNAs. Eight miRNAs were found to play important roles in regulating hub nodes in the network and these 8 miRNAs could serve as biomarkers to identify colon adenocarcinoma.
Figure 6.
ROC curve analysis results of the miRNA that synergistically regulated colon adenocarcinoma-related genes. The ordinate and abscissa show specificity and sensitivity, respectively. AUC was the area under the ROC curve, and the ability of miRNA as a molecular marker showed positive correlation to AUC size.
Footnotes
Source of support: Departmental sources
References
- 1.Schetter AJ, Nguyen GH, Bowman ED, et al. Association of inflammation-related and microRNA gene expression with cancer-specific mortality of colon adenocarcinoma. Clin Cancer Res. 2009;15(18):5878–87. doi: 10.1158/1078-0432.CCR-09-0627. [DOI] [PMC free article] [PubMed] [Google Scholar]
- 2.Dean M. Cancer as a complex developmental disorder – nineteenth Cornelius P. Rhoads Memorial Award Lecture. Cancer Res. 1998;58(24):5633–36. [PubMed] [Google Scholar]
- 3.Bartel DP. MicroRNAs: genomics, biogenesis, mechanism, and function. Cell. 2004;116(2):281–97. doi: 10.1016/s0092-8674(04)00045-5. [DOI] [PubMed] [Google Scholar]
- 4.Sassen S, Miska E, Caldas C. MicroRNA – implications for cancer. Virchows Archiv. 2008;452(1):1–10. doi: 10.1007/s00428-007-0532-2. [DOI] [PMC free article] [PubMed] [Google Scholar]
- 5.Schetter AJ, Leung SY, Sohn JJ, et al. MicroRNA expression profiles associated with prognosis and therapeutic outcome in colon adenocarcinoma. JAMA. 2008;299(4):425–36. doi: 10.1001/jama.299.4.425. [DOI] [PMC free article] [PubMed] [Google Scholar]
- 6.Lee RC, Feinbaum RL, Ambros V. The C. elegans heterochronic gene lin-4 encodes small RNAs with antisense complementarity to lin-14. Cell. 1993;75(5):843–54. doi: 10.1016/0092-8674(93)90529-y. [DOI] [PubMed] [Google Scholar]
- 7.Hermeking H. p53 enters the microRNA world. Cancer Cell. 2007;12(5):414–18. doi: 10.1016/j.ccr.2007.10.028. [DOI] [PubMed] [Google Scholar]
- 8.Moschos SA, Williams AE, Perry MM, et al. Expression profiling in vivo demonstrates rapid changes in lung microRNA levels following lipopolysaccharide-induced inflammation but not in the anti-inflammatory action of glucocorticoids. BMC Genomics. 2007;8:240. doi: 10.1186/1471-2164-8-240. [DOI] [PMC free article] [PubMed] [Google Scholar]
- 9.Kachitvichyanukul V, Schmeiser B. Computer generation of hypergeometric random variates. Journal of Statistical Computation and Simulation. 1985;22(2):127–45. [Google Scholar]
- 10.Anders S, Huber W. Differential expression analysis for sequence count data. Genome Biol. 2010;11(10):R106. doi: 10.1186/gb-2010-11-10-r106. [DOI] [PMC free article] [PubMed] [Google Scholar]
- 11.Lewis BP, Burge CB, Bartel DP. Conserved seed pairing, often flanked by adenosines, indicates that thousands of human genes are microRNA targets. Cell. 2005;120(1):15–20. doi: 10.1016/j.cell.2004.12.035. [DOI] [PubMed] [Google Scholar]
- 12.Saad ZS, Glen DR, Chen G, et al. A new method for improving functional-to-structural MRI alignment using local Pearson correlation. Neuroimage. 2009;44(3):839–48. doi: 10.1016/j.neuroimage.2008.09.037. [DOI] [PMC free article] [PubMed] [Google Scholar]
- 13.Dennis G, Jr, Sherman BT, Hosack DA, et al. DAVID: Database for annotation, visualization, and integrated discovery. Genome Biol. 2003;4(5):P3. [PubMed] [Google Scholar]
- 14.Kerrien S1, Aranda B, Breuza L, et al. The IntAct molecular interaction database in 2012. Nucleic Acids Res. 2012;40(Database issue):D841–46. doi: 10.1093/nar/gkr1088. [DOI] [PMC free article] [PubMed] [Google Scholar]
- 15.Croft D, O’Kelly G, Wu G, et al. Reactome: a database of reactions, pathways and biological processes. Nucleic Acids Res. 2011;39(Database issue):D691–97. doi: 10.1093/nar/gkq1018. [DOI] [PMC free article] [PubMed] [Google Scholar]
- 16.Shannon P, Markiel A, Ozier O, et al. Cytoscape: a software environment for integrated models of biomolecular interaction networks. Genome Res. 2003;13(11):2498–504. doi: 10.1101/gr.1239303. [DOI] [PMC free article] [PubMed] [Google Scholar]
- 17.Czerwinska U, Calzone L, Barillot E, Zinovyev A. DeDaL: Cytoscape 3 app for producing and morphing data-driven and structure-driven network layouts. BMC Syst Biol. 2015;9:46. doi: 10.1186/s12918-015-0189-4. [DOI] [PMC free article] [PubMed] [Google Scholar]
- 18.Monteith GR, McAndrew D, Faddy HM, et al. Calcium and cancer: targeting Ca2+ transport. Nat Rev Cancer. 2007;7(7):519–30. doi: 10.1038/nrc2171. [DOI] [PubMed] [Google Scholar]
- 19.Saito K1, Uzawa K, Endo Y, et al. Plasma membrane Ca2+ ATPase isoform 1 down-regulated in human oral cancer. Oncol Rep. 2006;15(1):49–55. [PubMed] [Google Scholar]
- 20.Gélébart P, Kovács T, Brouland JP, et al. Expression of endomembrane calcium pumps in colon and gastric cancer cells. Induction of SERCA3 expression during differentiation. J Biol Chem. 2002;277(29):26310–20. doi: 10.1074/jbc.M201747200. [DOI] [PubMed] [Google Scholar]
- 21.Fan L, Li A, Li W, et al. Novel role of Sarco/endoplasmic reticulum calcium ATPase 2 in development of colorectal cancer and its regulation by F36, a curcumin analog. Biomed Pharmacother. 2014;68(8):1141–48. doi: 10.1016/j.biopha.2014.10.014. [DOI] [PubMed] [Google Scholar]
- 22.Chen J, Huang XF, Qiao L, Katsifis A. Insulin caused drug resistance to oxaliplatin in colon cancer cell line HT29. J Gastrointest Oncol. 2011;2(1):27–33. doi: 10.3978/j.issn.2078-6891.2010.028. [DOI] [PMC free article] [PubMed] [Google Scholar]
- 23.Huang XF, Chen JZ. Obesity, the PI3K/Akt signal pathway and colon cancer. Obes Rev. 2009;10(6):610–16. doi: 10.1111/j.1467-789X.2009.00607.x. [DOI] [PubMed] [Google Scholar]
- 24.Schmidt S, Rainer J, Ploner C, et al. Glucocorticoid-induced apoptosis and glucocorticoid resistance: molecular mechanisms and clinical relevance. Cell Death Differ. 2004;(11 Suppl 1):S45–55. doi: 10.1038/sj.cdd.4401456. [DOI] [PubMed] [Google Scholar]
- 25.Lind GE, Kleivi K, Meling GI, et al. ADAMTS1, CRABP1, and NR3C1 identified as epigenetically deregulated genes in colorectal tumorigenesis. Cell Oncol. 2006;28(5–6):259–72. doi: 10.1155/2006/949506. [DOI] [PMC free article] [PubMed] [Google Scholar]
- 26.Bal O, Yalcintas Arslan U, Durnali A, et al. Progesterone receptor status in determining the prognosis of estrogen receptor positive/ HER2 negative breast carcinoma patients. J BUON. 2015;20(1):28–34. [PubMed] [Google Scholar]
- 27.Bardou VJ, Arpino G, Elledge RM, et al. Progesterone receptor status significantly improves outcome prediction over estrogen receptor status alone for adjuvant endocrine therapy in two large breast cancer databases. J Clin Oncol. 2003;21(10):1973–79. doi: 10.1200/JCO.2003.09.099. [DOI] [PubMed] [Google Scholar]
- 28.Lamy PJ, Pujol P, Thezenas S, et al. Progesterone receptor quantification as a strong prognostic determinant in postmenopausal breast cancer women under tamoxifen therapy. Breast Cancer Res Treat. 2002;76(1):65–71. doi: 10.1023/a:1020228620173. [DOI] [PubMed] [Google Scholar]
- 29.Connolly RM, Stearns V. Postmenopausal hormone receptor-positive advanced breast cancer. Oncology (Williston Park) 2013;27(6):571–72. 574. 576 passim. [PubMed] [Google Scholar]
- 30.Liu M, Tang Q, Qiu M, et al. miR-21 targets the tumor suppressor RhoB and regulates proliferation, invasion and apoptosis in colorectal cancer cells. FEBS Lett. 2011;585(19):2998–3005. doi: 10.1016/j.febslet.2011.08.014. [DOI] [PubMed] [Google Scholar]
- 31.Sabatel C, Malvaux L, Bovy N, et al. MicroRNA-21 exhibits antiangiogenic function by targeting RhoB expression in endothelial cells. PLoS One. 2011;6(2):e16979. doi: 10.1371/journal.pone.0016979. [DOI] [PMC free article] [PubMed] [Google Scholar]
- 32.Sabatel C, Malvaux L, Bovy N, et al. A microRNA polycistron as a potential human oncogene. Nature. 2005;435(7043):828–33. doi: 10.1038/nature03552. [DOI] [PMC free article] [PubMed] [Google Scholar]
- 33.Kara M, Yumrutas O, Ozcan O, et al. Differential expressions of cancer-associated genes and their regulatory miRNAs in colorectal carcinoma. Gene. 2015;567(1):81–86. doi: 10.1016/j.gene.2015.04.065. [DOI] [PubMed] [Google Scholar]
- 34.Isik A, Peker K, Firat D, et al. Importance of metastatic lymph node ratio in non-metastatic, lymph node-invaded colon cancer: a clinical trial. Med Sci Monit. 2014;20:1369–75. doi: 10.12659/MSM.890804. [DOI] [PMC free article] [PubMed] [Google Scholar]


