Abstract
Introduction
The aim of this study was to determine the influence of the far upstream element binding protein 1 gene (FUBP1) on chemotherapy sensitivity in human U251 glioblastoma cells.
Material and methods
Real-time polymerase chain reaction (PCR) was used to determine the expression of the FUBP1 gene in 43 cases of human brain gliomas. Western blot analysis was used to determine the inhibitory effect of RNA interference on FUBP1 gene expression. Methyl thiazolyl tetrazolium assay (MTT) and flow cytometry methods were used to determine the growth inhibitory rate and apoptosis rate of the U251 cells with FUBP1 silencing. The growth inhibitory rate and apoptosis rate were further determined after treatment of those U251 cells with cisplatin (DDP).
Results
The expression of FUBP1 mRNA was up-regulated significantly in gliomas, 177.65% as much as in peri-cancerous tissues (p < 0.05). The expression of FUBP1 protein was inhibited significantly with siRNA-FUBP1 (p < 0.05). In FUBP1-silenced cells, the growth inhibitory rate increased from 1.4% to 29.5%, and the apoptosis rate increased from 2.68% to 5.84% (p < 0.05 for both). After treating with DDP at various concentrations (1, 3, 5 µg/ml), the growth inhibitory rate of FUBP1-silenced cells increased from 14.42%, 17.46% and 23.55% to 21.69%, 27.51% and 37.57%; the apoptosis rate increased from 8.85%, 14.37% and 18.21% to 13.25%, 18.46% and 26.52%.
Conclusions
The up-regulation of FUBP1 relates to the carcinogenesis of gliomas. FUBP1 silencing increases the growth inhibitory rate and apoptosis rate of the U251 cells, and enhances the chemotherapy sensitivity of U251 cells to DDP.
Keywords: brain glioma, far upstream element binding protein 1 gene, chemotherapy sensitivity, U251 cell
Introduction
Gliomas are the most common malignant primary brain tumors, making up 60% of all malignant primary brain tumors. Gliomas are characterized by their invasiveness and common tendency to grow from low grade to high grade [1]. Gliomas are rarely curable. Treatment for a glioma is customized to the individual patient and may include surgery, radiation therapy, chemotherapy, or observation. So far, surgery is the most important initial approach. Chemotherapy and radiotherapy after initial surgical resection is regarded as an effective treatment plan to prevent recurrence and metastasis [2]. However, chemotherapy does not work for everyone with a glioma. It helps about half the people treated. For this reason, the prognosis for patients especially with high-grade gliomas is still gloomy, despite being given prompt and comprehensive treatment. The median survival time for adults with an anaplastic astrocytoma is about 2 to 3 years, and for those with more aggressive glioblastomas, median survival drops off to about 12–14.6 months, with a 2-year median survival rate of 30% [3].
In this new era, investigating the molecular mechanisms in tumor formation might shed light on this deadly disease [4–6]. Far Upstream Element (FUSE) Binding Protein (FUBP) was first described by Avigan et al. [7] as a factor associated with the Far Upstream Element (FUSE) of the c-myc gene. FUBP family members (FUBP1, FUBP2, and FUBP3) are expressed generally in human tissues closely linked with various transcript processing factors that regulate cell proliferation and apoptosis [8, 9]. In our preliminary work, we demonstrated the overexpression of the FUBP1 gene in human gliomas detected by gene chips.
Hence, the goal of this study was to first detect the expression of FUBP1 in human gliomas and clarify its correlation with pathological grades, and then explore its possible impact on chemotherapy sensitivity of human glioma U251 cells.
Material and methods
Materials
All specimens were from 43 patients provided by the Department of Neurosurgery, Shengjing Hospital of China Medical University from March 2010 to May 2012. All activities were approved by the review boards of our hospital, and informed consent was obtained from all participants. The tumors with at least 1 cm margin from the corresponding peri-cancerous tissues were obtained from all patients through surgical resection and further histologically proven to be gliomas. The patients include 29 men and 14 women (mean age: 51.3 ±4.6 years, age range: 47–66 years). All patients were naive to chemotherapy and radiotherapy before surgery, including 23 cases of astrogliomas (grade I–II), 11 of anaplastic gliomas (grade III), and 9 of glioblastomas (GBM, grade IV). Human glioblastoma cell line U251 was obtained from Biological Sciences Cell Resource Center (China). Real-time polymerase chain reaction (PCR) reagents were from Takara Bio (China), siRNA-FUBP1, siRNA-control and TransMessenger from Invitrogen (Carlsbad, CA, USA), and DDP from Sigma (USA). The MTT Cell Proliferation Assay Kit was from Beyotime Company (Shanghai, China), and Annexin V Cell Apoptosis Assay Kit was from Biosea Company (Beijing, China). The PCR primers of the FUBP1 gene were synthesized by Sangon Biotech (Shanghai, China).
Methods
Real-time polymerase chain reaction
The total RNA was extracted using TRIZOL reagent (Invitrogen) and quantified using a spectrophotometer. Two-step real-time PCR was carried out to amplify the FUBP1 gene. The FUBP1 primer was designed by Primer 5 as follows: forward primer, 5’- ACACCCGAAAGGATAGCAC -3’, reverse primer, 5’- TTGCCTTGACCTCTACCTC -3’, and glyceraldehyde-3-phosphate-dehydrogenase (GAPDH) as reference. Real-time PCR analysis was performed using the ABI prism 7500 (Applied Biosystems) and analyzed using the software 7500 Software v2.0. The PCR parameters were as follows: 30 s at 95°C, then 40 cycles of denaturation at 95°C for 5 s, annealing at 60°C for 30 s, and extension at 72°C for 1 min. The acquired data were analyzed by the comparative threshold cycle (CT) method (2–ΔΔCt method) for quantitative analysis of FUBP1. (Formula: (1) ΔΔCt = ΔCt, Experimental group – ΔCt, Control group, (2) ΔCt = Ct, Target gene – Ct, Reference gene).
Cell transfection
U251 cells (5 × 10⁴ cells per well) were seeded into 6-well plates and cultured for 24 h. Then 1 mg of siRNA-FUBP1 or siRNA-control was mixed with Enhancer R, followed by mixing with 4 µl of TransMessenger, and then 900 µl of serum-free medium was further added for incubating the non-transfected U251 cells. The culture medium was removed 2 h later from each well and washed twice with PBS, and then the cells were cultured in normal medium.
The cells were split into 3 groups: the blank control group (C1), untransfected U251 cells; the negative control group (C2), U251 cells transfected with the control siRNA; and the FUBP1 silencing group (Fs), U251 cells transfected with siRNA-FUBP1.
Western blot analysis
After collecting the cells in each group and extracting proteins from the plasma, the Bradford protein assay was used to measure the concentration of protein. After loading the protein samples, images were acquired through steps of SDS-PAGE electrophoresis, transmembrane, isolation, incubation of antibody, electrochemiluminescence (ETL) and imaging, etc.
The ECL Western blot analysis system (Santa Cruz, USA) was used for detecting protein expression of FUBP1. The integrated density values (IDV) were calculated using a computerized image analysis system (Thermal Imaging System FTI-500, Pharmacia Biotech) and normalized with that of GAPDH. Relative expression of FUBP1 = gray scale value of FUBP1 bands/gray scale value of reference protein GAPDH.
Detection of cell growth inhibitory rate by MTT assay
After collecting the cells from all groups, a cell suspension was prepared at a density of 1–2 × 10⁵/ml. Then 200 µl of the cell suspension was dispensed in a 96-well plate and incubated for 12 h. MTT reagent (5 mg/ml) was prepared with serum-free medium, and then added to the wells (20 µl for each well) and incubated for 4 h. The MTT medium was removed until purple precipitate was visible, then 0.2 ml of DMSO was added to each well and shaken for 5 min. After further incubating for 30 min, absorbance was recorded on a microplate reader (Bio-Rad, USA) using a test wavelength of 490 nm. The cell growth curve was constructed by using the OD490 as the ordinate axis.
Detection of apoptosis and cell cycles by flow cytometry
After collecting the cells from all groups, the cells were suspended in PBS and placed in a centrifuge for 1 min at 1000 r/min at 4°C, and repeated two more times to obtain cell suspensions at a density of 5 × 10⁶/ml. The cells were mixed with 10 µl of annexin and incubated at room temperature away from light for 15 min, and then 5 µl propidium iodide (PI, 10 mg/l) was added to each. Then the cells were subjected to flow cytometry (FACScan, Becton Dickinson) (Ex 488 nm, Em 635 nm) and analyzed using CELLQuest 3.0 software (BD, NJ, USA). Annexin V positive cells were regarded as apoptosis cells. The cells were counted by a dual-color flow cytometric method.
U251 cells treated with DDP
U251 cells were treated with DDP of three different concentrations (1, 3, 5 µg/ml), and the cell growth inhibitory rate and apoptosis rate were determined after 24 h of incubation. The cells were grouped as follows: DDP group: U251 cells treated with DDP; Fs + DDP group: FUBP1-silenced U251 cells treated with DDP.
Statistical analysis
All results were obtained from independent experiments and analyzed with SPSS 18.0. All data were expressed as mean ± standard deviation (SD). Student's t-test was performed to determine significant differences between two groups. Pearson's correlation was analyzed between the grade of glioma and relative expression levels of FUBP1 mRNA. One-way ANOVA and post hoc comparisons (LSD test) were used to determine significant differences among multiple groups. Value of p < 0.05 was considered as significant.
Results
Real-time PCR detection of FUBP1 mRNA expression in human brain gliomas
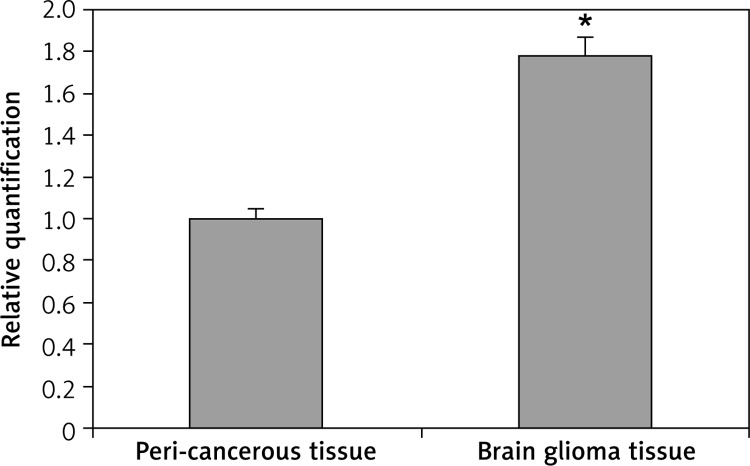
Amplification of the FUBP1 gene was shown in human brain gliomas using primer melting curve analysis. In the real time-PCR analysis, the ΔC t of tumors and peri-cancerous tissues was 3.417 ±0.264 and 4.246 ±0.283 respectively, and the ΔΔC t was –0.829. Thus, the expression of FUBP1 mRNA in the glioma tumors was significantly higher than that in peri-cancerous tissues (p < 0.05) (Figure 1), showing an increase in expression by 177.65% compared to the corresponding peri-cancerous tissues. Further, the expression of FUBP1 was positively correlated with the pathologic grades (r = 0.425, p = 0.005, Pearson's correlation, i.e. negatively correlated with the differentiation) of gliomas (p < 0.05) (Table I).
Figure 1.
Real time-PCR analysis for FUBP1 mRNA expression in brain glioma tissues and peri-cancerous tissues
*p < 0.01 vs. peri-cancerous tissues.
Table I.
Correlation between FUBP1 mRNA expression in brain glioma tissue and pathological differentiation
| Differentiation (grade) | Number of cases | FUBP1 mRNA expression relative quantification (gliomas/peri-cancerous tissues) | P-value |
|---|---|---|---|
| Medium-well differentiated (grade I–II) | 23 | 1.724 ±0.163 | < 0.05* |
| Anaplastic glioma (grade III) | 11 | 1.824 ±0.185 | |
| Glioblastoma (GBM, grade IV) | 9 | 1.853 ±0.178 |
A one-way ANOVA showed that FUBP1 mRNA expression in brain glioma tissue was significantly different among the three groups with different pathological differentiation of glioma (p < 0.05). The LSD test showed significant difference between groups of medium-well differentiated glioma (grade I–II) and anaplastic glioma (grade: III) (p = 0.03), as well as groups of medium-well differentiated glioma (grade I–II) and glioblastoma (GBM, grade: IV) (p = 0.01).
Impact of FUBP1 silencing on growth inhibition and apoptosis of U251 cell
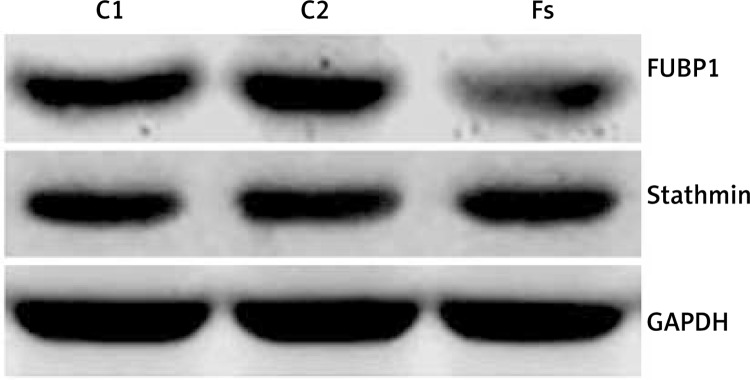
These experiments revealed clear bands in all groups (Figure 2). The expression of FUBP1 protein in the C1, C2 and Fs groups was 0.473 ±0.023, 0.508 ±0.031 and 0.147 ±0.014 respectively. No significant difference was found between the C1 and C2 groups (p > 0.05). However, protein expression was down-regulated significantly in the Fs group as compared to the other two groups (p < 0.05). In addition, the expression of stathmin showed no significant difference among these three groups (Figure 2).
Figure 2.
Western blot analysis for FUBP1 and stathmin expression of U251 cells treated with siRNA transfection
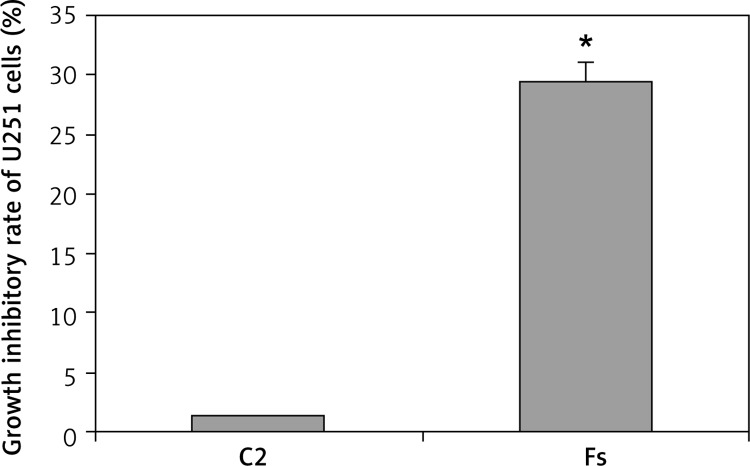
The OD490 values of the C1, C2 and Fs groups were 0.831 ±0.041, 0.819 ±0.036 and 0.586 ±0.033 respectively. The growth inhibitory rate increased from 1.4% in the C2 group to 29.5% in the Fs group (Figure 3), presenting significantly higher inhibition of cell proliferation in the Fs group (p < 0.05).
Figure 3.
Impact of FUBP1 gene silencing on U251 cell growth inhibitory rate
*p < 0.01 vs. C2 group.
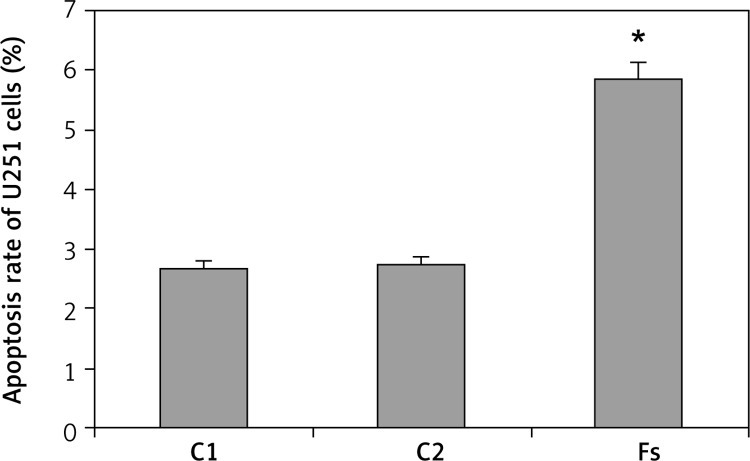
The apoptosis rate of the C1, C2 and Fs groups were 2.68 ±0.17%, 2.73 ±0.14% and 5.84 ±0.22%, respectively (Figure 4). There was no significant difference between the C1 and C2 groups (p > 0.05). The apoptosis rate in the Fs group was significantly elevated relative to the C1 and C2 groups (p < 0.05).
Figure 4.
Impact of FUBP1 gene silencing on U251 cell apoptosis rate
*p < 0.01 vs. C1 and C2 group.
Impact of FUBP1 gene silencing on chemotherapy sensitivity of human glioma U251 cells
Impact of FUBP1 gene silencing on growth inhibitory rate of U251 cells
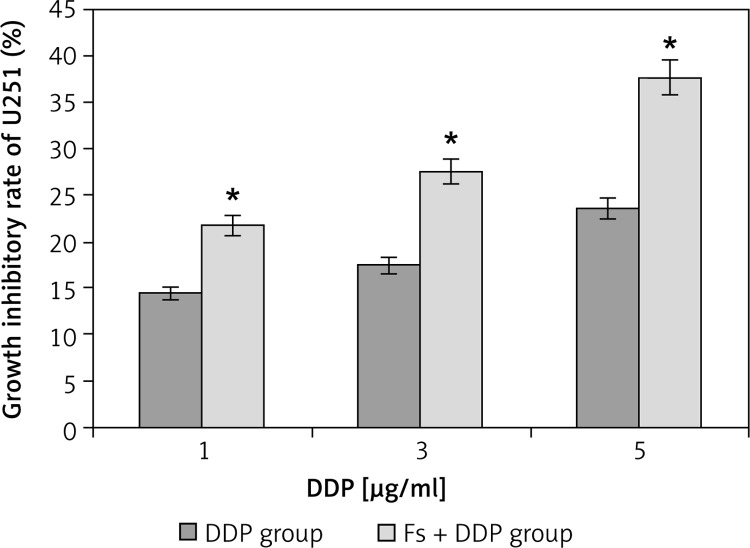
The OD490 values of the DDP group with concentrations of 1, 3, 5 µg/ml were 0.647 ±0.036, 0.624 ±0.031 and 0.578 ±0.038, while OD490 values for the Fs + DDP group were 0.647 ±0.036, 0.624 ±0.031 and 0.578 ±0.038 respectively, and the value of the blank group was 0.756 ±0.037. Following similar trends, the inhibition rates of the DDP group (1, 3, 5 µg/ml) were 14.42 ±0.11%, 17.46 ±0.10% and 23.55 ±0.14%, while the inhibition rates for the Fs + DDP group were 21.69 ±0.12%, 27.51 ±0.13% and 37.57 ±0.14% respectively (Figure 5). The inhibition rate at each DDP concentration was significantly higher in the Fs + DDP group than in the DDP group (all p < 0.05), indicating stronger inhibition of the U251 cell proliferation in the Fs + DDP group. The IC50 of DDP decreased from 5.12 ±0.31 µg/ml to 3.93 ±0.24 µg/ml (p < 0.05).
Figure 5.
Growth inhibitory rate of U251 cell in DDP group and Fs + DDP group at different DDP concentrations (1, 3, 5 µg/ml) (n = 3)
*p < 0.01 vs. each pair of DDP group and Fs + DDP group.
Impact of FUBP1 gene silencing on apoptosis rate of U251 cells
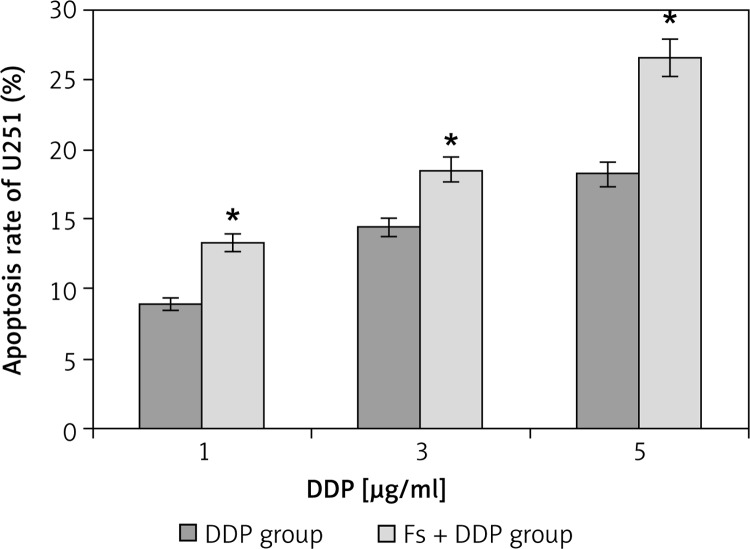
The growth apoptosis rate of U251 cells in the DDP group at DDP concentrations of 1, 3, 5 µg/ml were 8.85 ±0.46%, 14.37 ±0.57% and 18.21 ±0.62%, and the Fs + DDP group growth apoptosis rates were 13.25 ±0.54%, 18.46 ±0.58% and 26.52 ±0.46% respectively (Figure 6). The growth apoptosis rate at each DDP concentration was significantly higher in the Fs + DDP group than in the DDP group (all p < 0.05). Western blotting was used to show the expression of NOXA of U251 cells in the DDP group and Fs + DDP group at different DDP concentrations (Figure 7). The expression of NOXA at each DDP concentration was significantly higher in the Fs + DDP group than in the DDP group (all p < 0.05).
Figure 6.
Apoptosis rate of U251 cells in both DDP group and Fs + DDP group at different DDP concentrations (1, 3, 5 µg/ml) (n = 3)
*p < 0.01 vs. each pair of DDP group and Fs + DDP group.
Figure 7.
Western blot analysis for NOXA expression of U251 cells in both DDP group and Fs + DDP group at different DDP concentrations (1, 3, 5 µg/ml)
Discussion
The three FUBP family members (FUBP1, FUBP2, and FUBP3) belong to an ancient family of single-stranded DNA binding proteins. FUBP1 is a multifunctional factor which is required for proper regulation of the c-myc proto-oncogene. It has been related to various transcript processing steps in the precise control of c-myc transcription gene expression, which plays a role in proliferation, cell cycle progression, differentiation, apoptosis and cell metabolism [10, 11]. FUBP1 also interacts with specific RNAs, implicating additional functions in the regulation of neuronal differentiation, viral replication and cell growth [11]. Consequently, FUBP1 is involved in the regulation of the proliferation and differentiation of cells, which has been experimentally confirmed by some recent studies [8, 12]. Moreover, FUBP1 gene mutation or abnormal expression [12–14] has been reported in glioma and liver cancer in previous literature.
In this study, we performed semiquantitative real-time PCR and observed elevated expression of FUBP1 mRNA in brain glioma tissue, indicating the underlying correlation of FUBP1 with the carcinogenesis of human brain gliomas. Furthermore, the expression of FUBP1 significantly correlated with the pathologic differentiation and grade of gliomas. Our data demonstrated that high-level expression of FUBP1, which promoted tumor growth and migration, correlated with poor differentiation and high grade of glioma patients. This suggests that FUBP1 plays an important role in glioma pathogenesis, progression, invasiveness and metastasis. Liu et al. [15] reported similar results in a cohort of 37 patients with esophageal cancer, showing that the relative FUBP1 mRNA expression in esophageal cancer tissue was significantly higher than that in the peri-cancerous tissues shown by immunohistochemistry and fluorescence quantitative polymerase chain reaction (FQ-PCR). The FUBP1 mRNA expression was related to the degree of differentiation, and the occurrence of lymph node metastasis and distant metastasis, indicating that FUBP1 may have an important effect on the pathogenesis, development, infiltration, and metastasis of esophageal cancer. Further, increased FUBP1 expression enhanced susceptibility of esophageal tissue to carcinogenesis. The results of Baumgarten et al. [16] indicate that FUBP1 expression levels were increased in all glioma subtypes as compared to normal central nervous system (CNS) control tissue and were associated with increased proliferation, and FUBP1 mutation was associated with oligodendroglial differentiation. Consistent with these results, our study further demonstrates that the FUBP1 gene is positively correlated with pathologic grades, and functions as an oncogene in tumors. Moreover, we silenced FUBP1 gene expression in U251 cells and investigated the growth inhibitory rate and apoptosis rate. Our results showed that the gene silencing of FUBP1 induced remarkable apoptosis and reduced the proliferation ability of gliomas. Studies on the correlation between FUBP1 and apoptosis are very rare in the literature, calling for future efforts to investigate the mechanisms of how FUBP1 influences cell proliferation and apoptosis. In addition, we checked the expression of stathmin protein in U251 cells with FUBP1 silenced, and the expression of stathmin showed no significant difference. Malz et al. [17] reported that inhibition of FUBP1 reduced stathmin at the protein levels in liver cancer cells, which is not consistent with our data. We speculate that the difference between our study and their study might result from the different modulating mechanism of different tissues. Stathmin might not be involved in the process of FUBP1 influencing the cancer cell functions of the glioma.
Up to now, therapeutic approaches have been tailored for individual patients, depending on the nature of the tumor, the growth rate, the location and the patient's state. Upon initial diagnosis of glioma, standard treatment consists of maximal surgical resection, combined with optional radiotherapy and chemotherapy. Radiotherapy and chemotherapy are recommended for reducing the risk of recurrence and metastasis. Chemotherapy is the treatment of cancer with one or more cytotoxic anti-neoplastic drugs (“chemotherapeutic agents”) as part of a standardized regimen. At present, dosage of chemotherapy can be difficult due to a compromise between toxicity and efficacy. For this reason, chemotherapy sensitivity is of vital importance to give guidance on the customized dose for individuals to maximize the effectiveness and minimize side-effects [18]. FUBP1 is proven to be involved in regulating cell proliferation and apoptosis, and silencing of the FUBP1 gene induced remarkable apoptosis and reduced the proliferation ability of U251 cells. Therefore, we hypothesized that FUBP1 might influence the effect of chemotherapy on gliomas. For this reason, the FUBP1-silenced U251 cells were treated with different concentrations of DDP (1, 3, 5 µg/ml) [19, 20] and then characterized. The growth inhibitory rate and apoptosis rate increased dramatically as compared with normal U251 cells, indicating the inhibition of cell proliferation and indicating the possibility of better chemotherapy for patients. Another study reported by Malz et al. also found coordinated overexpression of two FUBP family members (FUBP1 and FUBP2) in liver cancer cells, and FUBP1 predominantly induced tumor cell proliferation [17]. They speculated that the coordinated activation of FUBP1 and FUBP2 represented a new target for pharmacological intervention. These possible therapeutic approaches ranged from inhibition of common positive upstream modulators for FUBP1/2 (e.g., growth factor receptors) to the activation of proteolytic degradation of FUBPs.
In conclusion, FUBP1 functions as an oncogene in glioma carcinogenesis. The silencing of FUBP1 could enhance the chemotherapy sensitivity of DDP in U251 cells. In this context, FUBP1 would be a new potential target for gene glioma treatment, or provide guidance to show chemosensitivity for chemotherapy.
Acknowledgments
This work was supported by the National Nature Science Foundation of China (81172408, 81301862, 81271566).
Conflict of interest
The authors declare no conflict of interest.
References
- 1.Ang C, Guiot MC, Ramanakumar AV, et al. Clinical significance of molecular biomarkers in glioblastoma. Can J Neurol Sci. 2010;37:625–30. doi: 10.1017/s0317167100010805. [DOI] [PubMed] [Google Scholar]
- 2.Mrugala MM. Advances and challenges in the treatment of glioblastoma: a clinician's perspective. Discov Med. 2013;15:221–30. [PubMed] [Google Scholar]
- 3.Nieder C, Astner ST, Mehta MP, Grosu AL, Molls M. Improvement, clinical course, and quality of life after palliative radiotherapy for recurrent glioblastoma. Am J Clin Oncol. 2008;31:300–5. doi: 10.1097/COC.0b013e31815e3fdc. [DOI] [PubMed] [Google Scholar]
- 4.Hegi ME, Rajakannu P, Weller M. Epidermal growth factor receptor: a re-emerging target in glioblastoma. Curr Opin Neurol. 2012;25:774–9. doi: 10.1097/WCO.0b013e328359b0bc. [DOI] [PubMed] [Google Scholar]
- 5.Liu J, Albrecht AM, Ni X, Yang J, Li M. Glioblastoma tumor initiating cells: therapeutic strategies targeting apoptosis and microRNA pathways. Curr Mol Med. 2013;13:352–7. [PubMed] [Google Scholar]
- 6.Kuijlen JM, Bremer E, Mooij JJ, et al. On TRAIL for malignant glioma therapy? Neuropathol Appl Neurobiol. 2010;36:168–82. doi: 10.1111/j.1365-2990.2010.01069.x. [DOI] [PubMed] [Google Scholar]
- 7.Avigan MI, Strober B, Levens D. A far upstream element stimulates c-myc expression in undifferentiated leukemia cells. J Biol Chem. 1990;265:18538–45. [PubMed] [Google Scholar]
- 8.Zhang J, Chen QM. Far upstream element binding protein 1: a commander of transcription, translation and beyond. Oncogene. 2013;32:2907–16. doi: 10.1038/onc.2012.350. [DOI] [PMC free article] [PubMed] [Google Scholar]
- 9.Gau BH, Chen TM, Shih YH, et al. FUBP3 interacts with FGF9 3’ microsatellite and positively regulates FGF9 translation. Nucleic Acids Res. 2011;39:3582–93. doi: 10.1093/nar/gkq1295. [DOI] [PMC free article] [PubMed] [Google Scholar]
- 10.Li H, Wang Z, Zhou X, et al. Far upstream element-binding protein 1 and RNA secondary structure both mediate second-step splicing repression. Proc Natl Acad Sci USA. 2013;110:E2687–95. doi: 10.1073/pnas.1310607110. [DOI] [PMC free article] [PubMed] [Google Scholar]
- 11.Olanich ME, Moss BL, Piwnica-Worms D, et al. Identification of FUSE-binding protein 1 as a regulatory mRNA-binding protein that represses nucleophosmin translation. Oncogene. 2011;30:77–86. doi: 10.1038/onc.2010.404. [DOI] [PMC free article] [PubMed] [Google Scholar]
- 12.Rabenhorst U, Beinoraviciute-Kellner R, Brezniceanu ML, et al. Overexpression of the far upstream element binding protein 1 in hepatocellular carcinoma is required for tumor growth. Hepatology. 2009;50:1121–9. doi: 10.1002/hep.23098. [DOI] [PMC free article] [PubMed] [Google Scholar]
- 13.Ma J, Chen M, Xia SK, et al. Prostaglandin E2 promotes liver cancer cell growth by the upregulation of FUSE-binding protein 1 expression. Int J Oncol. 2013;42:1093–104. doi: 10.3892/ijo.2013.1782. [DOI] [PubMed] [Google Scholar]
- 14.Sahm F, Koelsche C, Meyer J, et al. CIC and FUBP1 mutations in oligodendrogliomas, oligoastrocytomas and astrocytomas. Acta Neuropathol. 2012;123:853–60. doi: 10.1007/s00401-012-0993-5. [DOI] [PubMed] [Google Scholar]
- 15.Liu S, Wang Y. The expression and the significance of far upstream element-binding protein 1, Medical Journal of Chinese People. s Liberation Army. 2012;37:449–51. [Google Scholar]
- 16.Baumgarten P, Harter PN, Tönjes M, et al. Loss of FUBP1 expression in gliomas predicts FUBP1 mutation and is associated with oligodendroglial differentiation, IDH1 mutation and 1p/19q loss of heterozygosity. Neuropathol Appl Neurobiol. 2014;40:205–16. doi: 10.1111/nan.12088. [DOI] [PubMed] [Google Scholar]
- 17.Malz M, Weber A, Singer S, et al. Overexpression of far upstream element binding proteins: a mechanism regulating proliferation and migration in liver cancer cells. Hepatology. 2009;50:1130–9. doi: 10.1002/hep.23051. [DOI] [PubMed] [Google Scholar]
- 18.Yang I, Aghi MK. New advances that enable identification of glioblastoma recurrence. Nat Rev Clin Oncol. 2009;6:648–57. doi: 10.1038/nrclinonc.2009.150. [DOI] [PubMed] [Google Scholar]
- 19.Zhou YT, Li K, Tian H. Effects of vinorelbine on cisplatin resistance reversal in human lung cancer A549/DDP cells. Asian Pac J Cancer Prev. 2013;14:4635–9. doi: 10.7314/apjcp.2013.14.8.4635. [DOI] [PubMed] [Google Scholar]
- 20.Jiang S, Yuan S, Wang Y, et al. Study on sensitivity of neuroglioma to chemotherapeutic drugs. Hua Xi Yi Ke Da Xue Xue Bao. 2000;31:191–2. 232. [PubMed] [Google Scholar]


