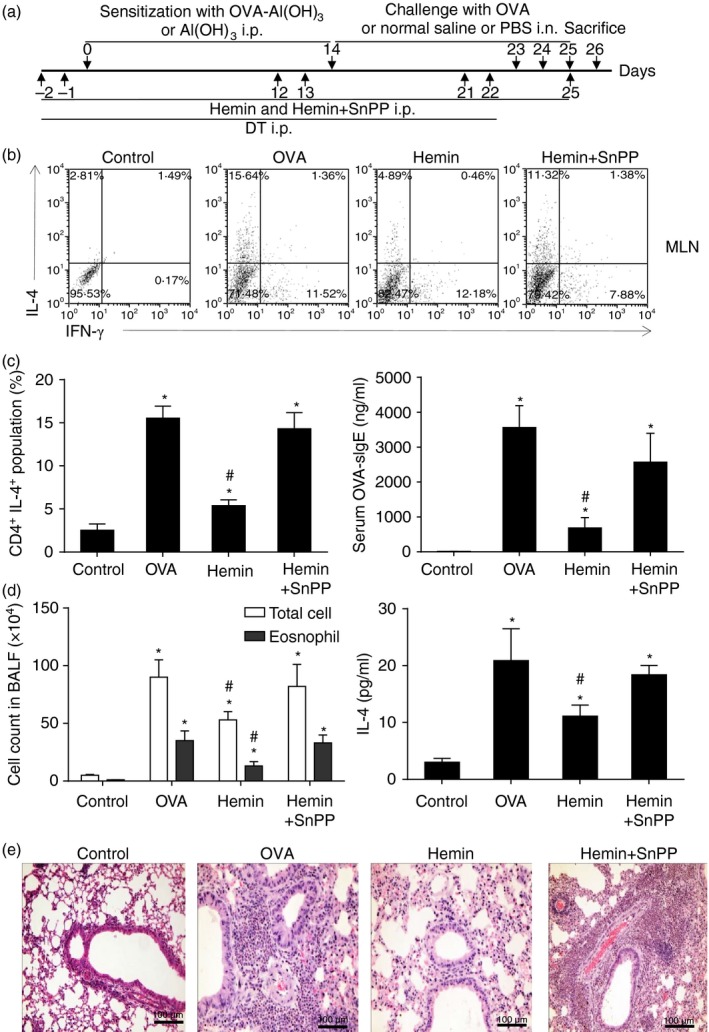
Figure 5.

Up‐regulation of HO‐1 attenuated Th2 immune responses and OVA ‐induced allergic airway inflammation. (a) The schematic diagram of OVA‐induced asthmatic mouse model and hemin or SnPP administration. (b) Isolated cells from mediastinal lymph nodes (MLNs) were cultured with 500 μg/ml OVA for 5 days followed by intracellular staining of IL‐4 and interferon‐γ (IFN‐γ). Th1/Th2 subsets were assessed by flow cytometry (gated on CD4+ cells). (c) Left, the percentage of CD4+ IL‐4+ population from MLNs (*P < 0·05, versus control group; #P < 0·05, versus OVA group); Right, serum OVA‐sIgE level was quantified by ELISA (*P < 0·05, versus control group; #, P < 0·05, versus OVA group). (d) Left, total cell numbers count and eosinophil numbers count in bronchoalveolar lavage fluid (*P < 0·05, versus control group; #P < 0·05, versus OVA group); Right, IL‐4 level in lung tissue were quantified by ELISA (*P < 0·05, versus control group; #P < 0·05, versus OVA group). (e) Pathological change of lung tissue, scale bar, 100 μm (haematoxylin & eosin stain, 40×). Data are representative of three independent experiments.
