

Summary
The Epstein–Barr virus‐induced gene 3 (EBI3) is a member of the interleukin‐12 (IL)‐12) family structurally related to the subunit p40 of IL‐12 and forms a heterodimer either with the p28 subunit to build IL‐27 or with p35 to form IL‐35. Interleukin‐27 is secreted by antigen‐presenting cells whereas IL‐35 appears to be produced mainly by regulatory T cells and regulatory B cells but both cytokines negatively regulate inflammatory immune responses. We here analysed the function of EBI3 during infection with the intracellular parasite Trypanosoma cruzi. Compared with C57BL/6 wild‐type mice, EBI3‐deficient (EBI3−/−) mice showed a higher parasitaemia associated with an increased mortality rate. The EBI3−/− mice displayed an elevated inflammatory immune response with an increased production of T helper type 1 (Th1‐), Th2‐ and Th17‐derived cytokines. The increased Th2 immune response appears to have over‐ridden the otherwise protective Th1 and Th17 immune responses by the induction of arginase‐1‐expressing alternatively activated macrophages in these mice. Hence, neutralization of IL‐4 and arginase‐1 activity partially restored protective immune responses in EBI3−/− mice. So far, our results demonstrate that EBI3 is an essential general regulator of inflammatory immune responses in experimental Chagas disease and is required for control of T. cruzi infection by inhibiting Th2‐dependent alternative macrophage activation. Further studies are needed to dissect the underlying mechanisms and clarify whether EBI3 association with IL‐27 or/and IL‐35 accounts for its anti‐inflammatory character in parasitic disease.
Keywords: alternative macrophage activation, interleukin‐27, interleukin‐35, parasitic infection
Abbreviations
- ALT
alanine transaminase
- APC
allophycocyanin
- AST
aspartate transaminase
- EBI3
Epstein–Barr virus‐induced gene 3
- Hprt
hypoxanthine‐guanine phosphoribosyltransferase
- IFN‐γ
interferon‐γ
- IL‐27Rα
IL‐27 receptor α
- IL
interleukin
- NKT
natural killer T
- norNOHA
N ω‐hydroxy‐l‐arginine
- NOS2
nitric oxide synthase 2
- Th
T helper
- Treg cells
regulatory T cells
Introduction
Trypanosoma cruzi is the causative agent of Chagas disease, affecting about 6–7 million people worldwide, mostly in Latin America.1 Within the mammalian host, macrophages represent an important site for T. cruzi replication, especially for reticulotropic T. cruzi strains. However, protective immunity against T. cruzi is based on the activation of macrophages to kill intracellular parasites. T helper type 1 (Th1) ‐derived interferon‐γ (IFN‐γ) induces expression of inducible nitric oxide synthase 2 (NOS2) and the production of reactive nitrogen intermediates in macrophages, which kill intracellular parasites by chemically modifying the structural properties of T. cruzi macromolecules.2 Accordingly, NOS2‐deficient (NOS2−/−) mice, as well as IFN‐γ receptor−/− mice, are highly susceptible to infection.3 Th17‐derived interleukin‐17A (IL‐17A) stimulates the phagocytosis of parasites by macrophages and contributes to intracellular killing and hence, in addition, to a Th1 immune response to protection.4 In contrast, the Th2 cytokines IL‐4 and IL‐10 have been associated with susceptibility to T. cruzi infection.5, 6, 7, 8, 9, 10 In this context, Th2‐dependent alternatively activated macrophages promote intracellular growth of T. cruzi parasites, probably through the arginase‐1‐dependent synthesis of polyamines, which are essential for intracellular parasite replication.11, 12
The Th1, Th17 and Th2 immune responses are modulated by the heterodimeric cytokines of the IL‐12 family, which include IL‐12, IL‐23, IL‐27 and IL‐35. Interleukin‐12, composed of p35 and p40, is the dominant factor in Th1 cell development, whereas IL‐23, composed of p19 and p40, is required for Th17 maintenance. In accordance with the pivotal role of Th1 and Th17 immune responses in macrophage activation, IL‐12p40−/−, IL‐12p35−/− and IL‐23p19−/− mice are highly susceptible to T. cruzi infection,4, 13, 14, 15 indicating that both cytokines IL‐12 and IL‐23 are indispensable for protection.
The p40 homologue Epstein–Barr virus‐induced gene 3 (EBI3) is a shared subunit of IL‐27 (composed of EBI3 and p28) and IL‐35 (composed of EBI3 and p35). Although IL‐27 was initially reported to induce Th1 development,16, 17, 18 subsequent work revealed that this cytokine can also suppress Th1, Th17 and Th2 immune responses.19, 20, 21, 22, 23 In accordance with the latter finding, the lack of the IL‐27 receptor α (IL‐27Rα) chain results in increased Th1 and Th2 immunity during T. cruzi infection in vivo, causing elevated liver pathology, enhanced motility and increased parasitaemia in these mice.24
Whereas IL‐12, IL‐23 and IL‐27 are all primarily produced by macrophages and dendritic cells, IL‐35 has so far been shown to be expressed by resting and activated regulatory T (Treg) cells25 and ‘regulatory’ B cells.26 Interleukin‐35 seems to act solely as an anti‐inflammatory cytokine by promoting the expansion of Foxp3+ Treg cells, suppressing in vivo Th17 development27 or by regulating the antigen‐presenting function of B cells,26 respectively. Mice deficient for the p35 subunit are highly susceptible to T. cruzi infection, as mentioned above.14 However, as these mice lack not only IL‐35, but also IL‐12, the role of IL‐35 is not known during T. cruzi infection.
In this study we analysed EBI3−/− mice that lack both IL‐27 and IL‐35 during infection with T. cruzi to clarify the role of EBI3 during experimental Chagas disease.
Materials and methods
Mice and parasites
EBI3−/− mice on a C57BL/6 background were kindly provided by Mark Birkenbach (Department of Medicine, Section of Rheumatology, Temple University, Philadelphia, PA) and bred under specific pathogen‐free conditions in the animal facility of the Research Centre Borstel (Germany). C57BL/6 mice were purchased from Charles River (Sulzfeld, Germany). For experiments, female mice aged 8–12 weeks were infected intraperitoneally with the T. cruzi strain Tulahuen (WHO reference strain M/HOM/CH/00/Tulahuen C2). To obtain high numbers of T. cruzi blood from trypomastigotes for infection experiments and to prevent the transfer of lymphocytes and antibodies, γcRAG2−/− or SCID mice (purchased from Charles River) were infected intraperitoneally with 3 × 10⁶ parasites in cryopreserved T. cruzi stabilates. On day 12 post infection, blood was collected from infected γcRAG2−/− or SCID mice, mixed with heparin and parasites were enriched in the plasma by differential centrifugation. Parasites were resuspended in PBS/0·5% glucose and used for infection. An infection dose of 500 or 1 × 10⁴ blood trypomastigotes was used to induce detectable inflammatory cytokine responses and pathology. For determining parasitaemia and mortality, a dose below the 50% lethal dose of 75 parasites was used. For IL‐4 blockade, mice received an intraperitoneal injection of anti‐IL‐4 (1 mg/mouse in 1 ml PBS, Leaf™ purified anti‐mouse; BioLegend, San Diego, CA) on days – 1, 3, 7, 10, 14, 17 and 21 post infection. For arginase‐1 inhibition, mice were treated daily with 600 μg/mouse N ω‐hydroxy‐nor‐l‐arginine (norNOHA; Alexis Biochemicals, San Diego, CA) in 200 μl PBS via intraperitoneal injection starting 2 days before infection. Control animals were treated with the same amount of PBS. During infection experiments, mice were kept under barrier conditions in the BSL 3 facility at the Research Centre Borstel in individually ventilated cages. All experiments were conducted according to the German animal protection laws and were approved by the Animal Research Ethics Board of the Ministry of Environment, Kiel, Germany.
Determination of parasitaemia
Blood parasitaemia was determined in 3 μl of tail vein blood that was lysed in 27 μl NH4Cl (0·87%, weight/volume). Viable parasites were counted in a haemocytometer.
Histology
For histology, organs were fixed in 4% formalin/PBS, set in paraffin blocks and sectioned (2 μm). Histopathological analyses were performed using standard protocols for haematoxylin & eosin staining. For NOS2 staining, tissue sections were stained with a polyclonal rabbit anti‐mouse NOS2 antibody (Upstate Biotechnology, Lake Placid, NY). For arginase‐1 staining, sections were stained using a monoclonal mouse anti‐mouse arginase‐1 antibody (BD Transduction™, Franklin Lakes, NJ) and the Vector M.O.M. immunodetection kit (Vector Laboratories, Burlingame, CA).
Aspartate transaminase and alanine transaminase assay
Serum was prepared using BD Microtainer SST Tubes (BD Pharmingen, San Diego, CA) and the aspartate transaminase (AST) and alanine transaminase (ALT) activity was determined using the Reflotron System of Diagnosis (Roche Diagnostics, Basel, Switzerland).
Quantitative real‐time PCR
Organs were homogenised in 4 m guanidinium‐isothiocyanate buffer and total RNA was extracted by acid phenol extraction. Complementary DNA was obtained using RevertAid H Minus M‐MuLV reverse transcriptase (Fermentas, Waltham, MA) and random hexamer (Fermentas) as a primer. Quantitative PCR was performed on a Light Cycler 480 Instrument (Roche Diagnostics). Data were analysed employing the ‘Second Derivative Maximum Method’ and ‘Standard Curve Method’ using hypoxanthine‐guanine phosphoribosyltransferase (Hprt) as a housekeeping gene to calculate the level of gene expression in relation to Hprt. The following primer and probe sets were employed: Arg1: sense 5′‐CCT GGA ACT GAA AGG AAA G‐3′, antisense 5′‐TTG GCA GAT ATG CAG GGA GT‐3′, probe 5′‐TTC TTC TG‐3′; Chi3l3: sense 5′‐GAA CAC TGA GCT AAA AAC TCT CCT G‐3′, antisense 5′‐GAG ACC ATG GCA CTG AAC G‐3′, probe 5′‐GGA GGA TG‐3′; Ebi3: sense 5′‐TCT TCG ATG GGT CAC TAA CTC G‐3′, antisense 5′‐GCT TAG AGC CAC GAG AGC TG‐3′, probe 5′‐CAG AGC CA‐3′; Hprt: sense 5′‐TCC TCC TCA GAC CGC TTT T‐3′, antisense 5′‐CCT GGT TCA TCA TCG CTA ATC‐3′, probe 5′‐AGT CCA G‐3′; Ifng: sense 5′‐ATC TGG AGG AAC TGG CAA AA‐3′, antisense 5′‐TTC AAG ACT TCA AAG AGT CTG AGG TA‐3′, probe 5′‐CAG‐AGC CA‐3′; Il12a: sense 5′‐CCA TCA GCA GAT CAT TCT AGA CAA‐3′, antisense 5′‐CGC CAT TAT GAT TCA GAG ACT G‐3′, probe 5′‐AGC TGG AG‐3′; Il13: sense 5′‐CCT CTG ACC CTT AAG GAG CTT AT‐3′, antisense 5′‐CGT TGC ACA GGG GAG TCT‐3′, probe 5′‐AGG AGC TG‐3′; Il17a: sense 5′‐TGT GAA GGT CAA CCT CAA AGT CT‐3′, antisense 5′‐GAG GGA TAT CTA TCA GGG TCT TCA T‐3′, probe 5′‐GCT CCA GA‐3′; Il22: sense 5′‐TTT CCT GAC CAA ACT CAG CA‐3′, antisense 5′‐TCT GGA TGT TCT GGT CGT CA‐3′, probe 5′‐CAG CTC CT‐3′; Il27: sense 5′‐CAT GGC ATC ACC TCT CTG AC‐3′, antisense 5′‐AAG GGC CGA AGT GTG GTA‐3′, probe 5′‐CTG CTT CC‐3′; Il4: sense 5′‐CAT CGG CAT TTT GAA CGA G‐3′, antisense 5′‐CGA GCT CAC TCT CTG TGG TG‐3′, probe 5′‐TTC TTC TG‐3′; Nos2: sense 5′‐CTT TGC CAC GGA CGA GAC‐3′, antisense 5′‐TCA TTG TAC TCT GAG GGC TGA C‐3′, probe 5′‐AGG CAG AG‐3′.
Quantification of cytokine production
To analyse the cytokine secretion into the supernatant of restimulated spleen cells, single cell suspensions were prepared at the indicated time‐points after infection and 1 × 10⁶ cells were stimulated with plate‐bound anti‐CD3 (clone 145‐2C11, 5 μg/ml; BD Pharmingen) for 24 hr. The concentration of the indicated cytokines in the supernatant was determined by cytometric bead array according to the manufacturer's instructions (BD Bioscience, Franklin Lakes, NJ). Cytokine concentrations were analysed using the FCS Filter and FCAP array software (Soft Flow Inc., St Louis Park, MN).
Measurement of serum nitrate/nitrite levels
For quantification of NO in individual plasma samples, serum was prepared using the BD Microtainer SST Tubes (BD Pharmingen) and plasma nitrate/nitrite concentrations were determined colorimetrically using the nitrate/nitrite colorimetric assay kit (Cayman Chemical, Ann Arbor, MI) according to the manufacturer's instructions.
Flow cytometry
Single‐cell suspensions of spleens were prepared at the indicated time‐points after infection and surface markers were stained with optimal concentrations of anti‐T‐cell receptor‐γδ‐FITC, anti‐NK‐1.1‐phycoerythrin, anti‐CD4‐V500 (all from BD Bioscience) and anti‐CD90.2‐allophycocyanin (APC)‐eFluor780 (eBioscience, San Diego, CA). The Treg cells were stained by using the mouse regulatory T‐cell staining kit (eBioscience). For intracellular cytokine staining, 1 × 10⁶ cells were stimulated with plate‐bound anti‐CD3/anti‐CD28 (clone 145‐2C11 and clone 37·51, respectively, 5 μg/ml; BD Pharmingen) for 4 hr in the presence of GolgiPlug™ (BD Biosciences). Cells were stained with optimal concentrations of anti‐CD4‐V500 (BD Biosciences), anti‐CD44‐FITC (BioLegend) and anti‐CD90.2‐APC‐eFluor780 (eBioscience). Afterwards cells were fixed and permeabilised with Cytofix/Cytoperm™ (BD Biosciences). Intracellularly accumulated cytokines were stained with anti‐IL‐17A‐Peridinin chlorophyll protein‐Cy5.5 (eBioscience) or anti‐IFN‐γ‐APC (BD Biosciences). Data were acquired on a FACSCanto™II (BD Biosciences) and analysed with the FCS express 4 Flow Cytometry software (De Novo Software, Los Angeles, CA).
Statistical analysis
For the majority of experiments, the Mann–Whitney U‐test was used. For the comparison of three groups, the Kruskal–Wallis test with Dunn's post test was used. Survival experiments were analysed with the Log‐rank test. For P‐values ≤ 0·05, results were considered statistically significant.
Results
Mice deficient in EBI3 display enhanced susceptibility to T. cruzi infection
To determine whether IL‐27 and IL‐35 were induced during T. cruzi infection, we examined the induction of the IL‐12 family genes Ebi3 (encoding IL‐27EBI3), Il12a (encoding IL‐12p35) and Il27 (encoding IL‐27p28) by quantitative real‐time PCR in the spleens of naive and infected C57BL/6 mice. An infection dose of 500 blood trypomastigotes was used to induce detectable inflammatory cytokine responses. EBI3 was constitutively expressed in non‐infected mice and stayed at a constant level during infection (Fig. 1a). In contrast, Il12a mRNA expression was down‐regulated, whereas Il27 mRNA expression was up‐regulated in response to T. cruzi infection (Fig. 1a). These results suggest a preferential induction of IL‐27 over IL‐35 during infection. We next examined whether EBI3 regulates host resistance to T. cruzi parasites. To assess parasitaemia and survival, we infected the mice with a sublethal dose of 50 parasites, which corresponds to a dose below the 50% lethal dose of 75 parasites. EBI3−/− mice displayed an increased susceptibility to infection, exhibiting an increased parasitaemia as well as an enhanced mortality rate over C57BL/6 mice (Fig. 1b). Hence, EBI3 is necessary for protection against T. cruzi infection in vivo.
Figure 1.
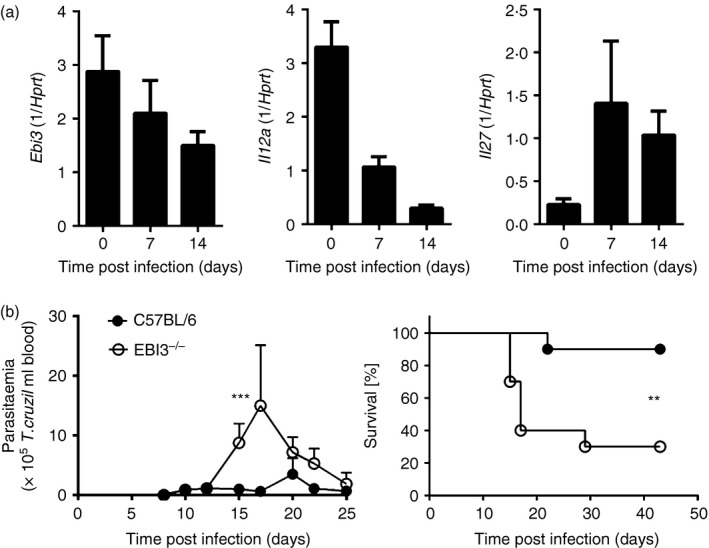
Epstein–Barr virus‐induced gene 3 (EBI3) is required for control of Trypanosoma cruzi infection in vivo. (a) C57BL/6 mice were infected intraperitoneally with 500 T. cruzi blood trypomastigotes and the mRNA expression of Ebi3, Il12a and Il27 in spleens was quantified by real‐time PCR at the indicated time‐points post infection. Results are expressed as means ± SD of five mice per group and are from one of two representative experiments performed. (b) C57BL/6 and EBI3−/− mice were infected intraperitoneally with a sublethal dose of 50 T. cruzi blood trypomastigotes. Parasitaemia and survival were assessed during the acute infection. Results are expressed as means ± SD of 10 mice per group. One out of three independent experiments with comparable results is shown. Statistical significance is shown (**P ≤ 0·01 and ***P ≤ 0·001, respectively) compared with C57BL/6 wild‐type mice.
Increased organ pathology in EBI3−/− mice after high‐dose T. cruzi infection
Because T. cruzi infects multiple organs during acute infection and causes organ pathology, we next assessed the impact of EBI3 deficiency on the T. cruzi‐induced pathology of liver, heart and spleen (Fig. 2). Fourteen days post infection with 500 T. cruzi blood trypomastigotes, microscopic examination of livers (Fig. 2a) revealed a comparable hepatic pathology with small necrotic areas in EBI3−/− and C57BL/6 mice. This result was consistent with comparable serum levels of AST and ALT in both mouse groups after infection (Fig. 2b). Heart sections exhibited only poor cellular infiltrates, which were also comparable between both mouse groups (Fig. 2c). Because Hamano et al. found increased liver pathology in IL‐27Rα −/− mice compared with C57BL/6 mice after high‐dose infection with 1 × 10⁴ blood trypomastigotes,24 we also assessed organ pathology in mice after inoculation of 1 × 10⁴ parasites. Fourteen days after high‐dose infection, liver sections displayed large necrotic areas in EBI3−/− mice, but only focal granuloma formation was observed in C57BL/6 mice (Fig. 2d). Consistently, AST and ALT serum levels were significantly increased in EBI3−/− mice compared with C57BL/6 mice (Fig. 2e). This increased tissue pathology was also reflected by a destruction of the splenic architecture in EBI3−/− mice (Fig. 2f). Together, T. cruzi‐induced organ pathology was comparable between C57BL/6 and EBI3−/− mice after infection with low amounts of parasites, but was enhanced in EBI3−/− mice after high‐dose infection.
Figure 2.
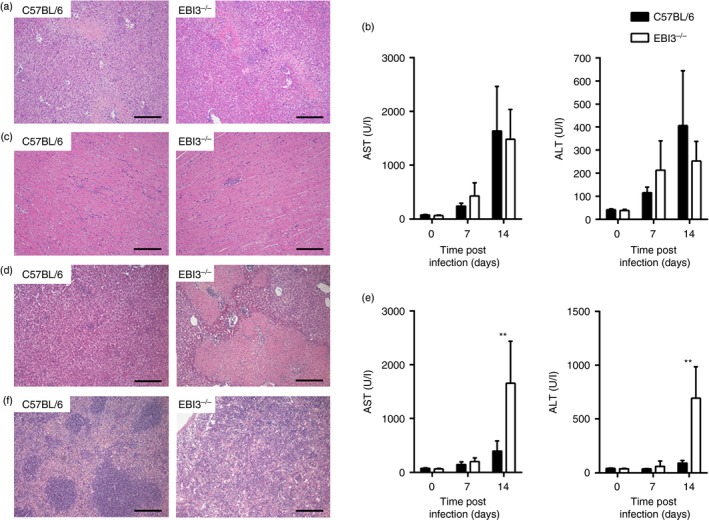
Increased pathology of Epstein–Barr virus‐induced gene 3‐deficient (EBI3−/−) mice in response to high‐dose Trypanosoma cruzi infection. C57BL/6 and EBI3−/− mice were infected intraperitoneally with 500 T. cruzi blood trypomastigotes (a–c) or with an unphysiologically high dose of 1 × 10⁴ T. cruzi blood trypomastigotes (d–f). Organ sections of liver (a, d), heart (c) and spleen (f) were prepared at day 14 post infection and stained with haematoxylin & eosin. Representative sections from five mice per group are shown. (b, e) Liver‐derived enzymes aspartate transaminase (AST) and alanine transaminase (ALT) were quantified in sera at the indicated time‐points after infection. Data represent means ± SD of five mice per group. Similar results were obtained in two independent experiments. Statistical significance (**P ≤ 0·01) is shown compared with C57BL/6 wild‐type mice. Bar, 200 μm.
EBI3−/− mice display reduced numbers of natural killer T cells, but increased numbers of CD4+ T cells
To determine, whether EBI3 deficiency influences T‐cell frequencies, we examined splenic T‐cell populations by flow cytometry in non‐infected mice and on day 7 and 14 after inoculation of 500 parasites (Fig. 3). T. cruzi induces a strong splenomegaly in C57BL/6 and EBI3−/− mice with an increase in the number of spleen cells on day 14 post infection. (Fig. 3a). However, apart from day 7 post infection, where EBI3−/− mice exhibited slightly increased numbers of spleen cells compared with wild‐type mice, no differences in spleen cell numbers were observed between both mouse groups. Additionally, the numbers of CD90.2+ cells in the spleen did not differ between both mouse groups (Fig. 3b). Within the CD90.2+ population the percentages of γδ T cells did not differ between C57BL/6 and EBI3−/− mice (Fig. 3c). However, EBI3−/− mice exhibited significantly decreased percentages of NK‐1.1+ spleen cells (Fig. 3d), but increased percentages of CD4+ T cells (Fig. 3e). Accordingly, the absolute cell numbers of γδ T cells were similar in both mouse groups, whereas EBI3−/− mice exhibited higher frequencies of CD4+ T cells and lower frequencies of NK‐1.1+ cells in their spleens (data not shown). The frequencies of macrophages (F4/80+ CD11b+), neutrophils (Gr1+ CD11b+ CD11c+) and dendritic cells (CD11c+ CD90.2− Gr1− F4/80− CD11b−) were unaffected by the absence of EBI3 (data not shown). In contrast to effector T cells that expand during T. cruzi infection, Foxp3+ Treg cells exhibit a decreased proliferation rate and the ratio between Treg cells and effector T cells decreases during the infection.28 This effect was also observed in C57BL/6 and in EBI3−/− mice, where the percentage of Foxp3+ Treg cells similarly decreased over the course of the infection (Fig. 3f). Although we observed decreased percentages of Foxp3+ Treg cells in EBI3−/− mice on day 7 after infection, the absolute cell numbers did not differ between both mouse groups (data not shown), suggesting that EBI3 does not affect the development of Treg cells in non‐infected mice and during T. cruzi infection. Taken together, during T. cruzi infection EBI3 deficiency influences the composition of the CD90.2+ splenic population, resulting in decreased percentages of NK‐1.1+ and increased percentages of CD4+ spleen cells.
Figure 3.
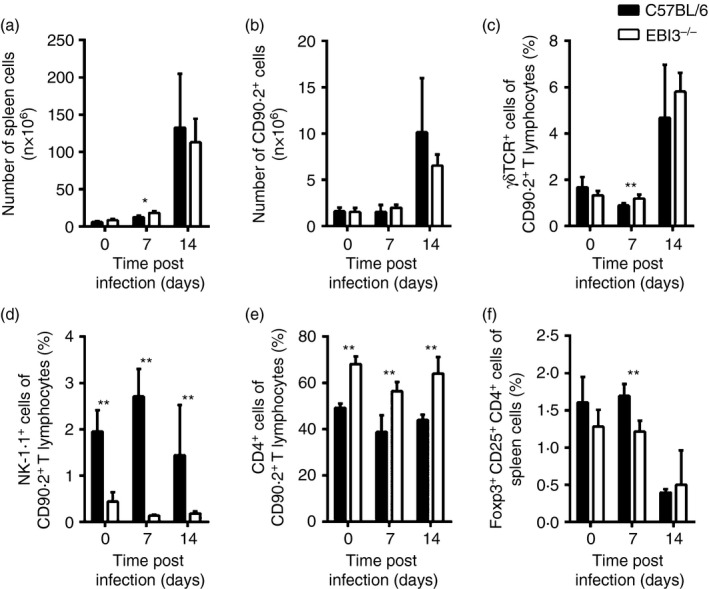
Trypanosoma cruzi‐infected Epstein–Barr virus‐induced gene 3‐deficient (EBI3−/−) mice displayed increased percentages of CD4+ T cells, but decreased percentages of NK‐1.1+ T cells in spleens. C57BL/6 and EBI3−/− mice were infected intraperiteonally with 500 T. cruzi blood trypomastigotes. (a) The total number of spleen cells was assessed over the course of infection. (b–f) Spleen cells were stained and analysed by flow cytometry at the indicated time‐points post infection. (b) The total number of CD90.2+ T lymphocytes in the spleens was calculated over the course of infection. The expression of T‐cell receptor‐γδ (TCR‐γδ) (c), NK‐1.1 (d) and CD4 (e) was analysed in the CD90.2+ T‐lymphocyte compartment. (e) The percentage of Foxp3+ CD25+ CD4+ spleen cells was determined. Results are expressed as means ± SD of five mice per group. One of two independent experiments with comparable results is shown. Statistical significance (*P≤ 0.05 and **P ≤ 0·01, respectively) is shown compared with C57BL/6 wild‐type mice.
EBI3−/− mice exhibit increased Th1, Th17 and Th2 immune responses in response to T. cruzi infection
We next analysed the impact of EBI3 deficiency on Th1, Th17 and Th2 cytokine expression during infection with 500 T. cruzi parasites (Fig. 4). In comparison to C57BL/6 animals, the EBI3−/− mice displayed enhanced mRNA expression levels of the Th1 cytokine IFN‐γ, the Th17 cytokines IL‐17A and IL‐22 as well as the Th2 cytokines IL‐4 and IL‐13 (Fig. 4a). Additionally, flow cytometric analyses revealed enhanced percentages of IFN‐γ‐secreting and IL‐17A‐secreting splenic CD4+ T cells in T. cruzi‐infected EBI3−/− mice (Fig. 4b). Consistently, we observed increased levels of IL‐17A and IL‐4 in the supernatants of re‐stimulated spleen cells, as measured by cytometric bead array (Fig. 4c). Taken together, EBI3 deficiency results in a simultaneous increase in Th1, Th17 and Th2 immune responses to T. cruzi infection.
Figure 4.
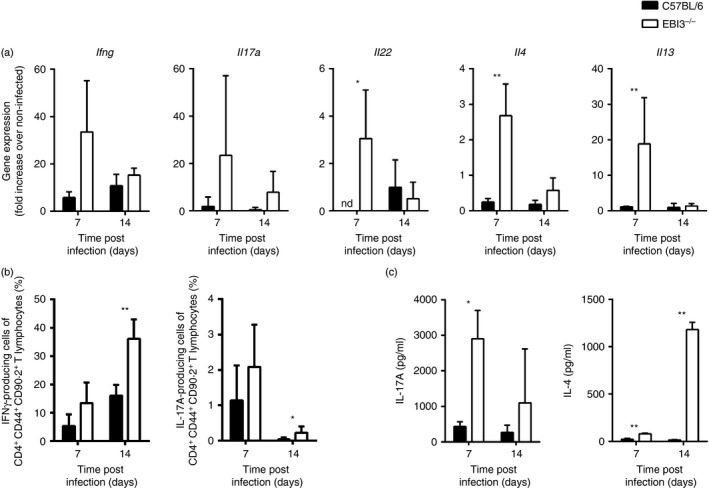
T helper type 1 (Th1), Th17 and Th2 immune responses are simultaneously increased in Trypanosoma cruzi‐infected Epstein–Barr virus‐induced gene 3‐deficient (EBI3−/−) mice. C57BL/6 and EBI3−/− mice were infected intraperitoneally with 500 T. cruzi blood trypomastigotes. (a) mRNA expression of Ifng, Il17a, Il22, Il4 and Il13 in spleens was quantified by real‐time PCR at the indicated time‐points post infection. (b) Spleen cells were re‐stimulated with immobilized anti‐CD3/anti‐CD28 for 4 hr and analysed for intracellular interferon‐γ (IFN‐γ) and interleukin‐17A (IL‐17A) production at the indicated time‐points. Percentage of IFN‐γ‐ or IL‐17A‐producing cells of CD4+ CD44+ CD90.2+ spleen cells are shown, respectively. (c) Spleen cells were cultured for 24 hr in the presence of immobilized anti‐CD3 and IL‐17A as well as IL‐4 secretion into the supernatant was detected by cytometric bead array. Results are expressed as means ± SD of four or five mice per group and are from one of two representative experiments performed. Statistical significance (*P ≤ 0·05 and **P ≤ 0·01, respectively) is shown compared with C57BL/6 wild‐type mice. nd, not detectable.
Increased alternative activation of macrophages in T. cruzi‐infected EBI3−/− mice
Macrophages represent an important site for T. cruzi replication in the acute phase of infection, especially for reticulotropic T. cruzi strains such as the Tulahuen strain. However, the main effector mechanisms that control infection by T. cruzi depend upon activation of macrophages by the Toll‐like receptors TLR2, TLR4 and TLR929, 30, 31, 32, 33 as well as by Th1‐dependent IFN‐γ 2, 7. Additionally, Th17‐derived IL‐17A promotes trypanocidal mechanisms in macrophages leading to parasite growth restriction.4 In contrast, IL‐4‐treated macrophages favour T. cruzi replication, which is dependent on the induction of arginase‐1.12 Therefore we next analysed the net effect of the simultaneous Th1, Th17 and Th2 cytokine production on macrophage activation in T. cruzi‐infected EBI3−/− mice (Fig. 5). Nos2 mRNA expression in spleens increased during T. cruzi infection in both C57BL/6 and EBI3−/− mice, but did not differ between these mouse groups (Fig. 5a). Accordingly, serum nitrate levels (Fig. 5b) and NOS2 expression in spleens, analysed by immunohistochemistry (Fig. 5c), were not altered upon EBI3 deficiency during T. cruzi infection. In contrast, mRNA expression of Chi3l3 encoding Ym1, a prototype marker of alternative macrophage activation, was strongly up‐regulated in spleens of infected EBI3−/− mice (Fig. 5d). Consistently, EBI3−/− mice displayed increased Arg1 mRNA expression (Fig. 5d) and arginase‐1 protein production in spleens (Fig. 5e). Hence, whereas both mouse groups displayed a classical activation of macrophages during infection with T. cruzi, EBI3−/− mice additionally exhibited an elevated alternative macrophage activation during infection.
Figure 5.
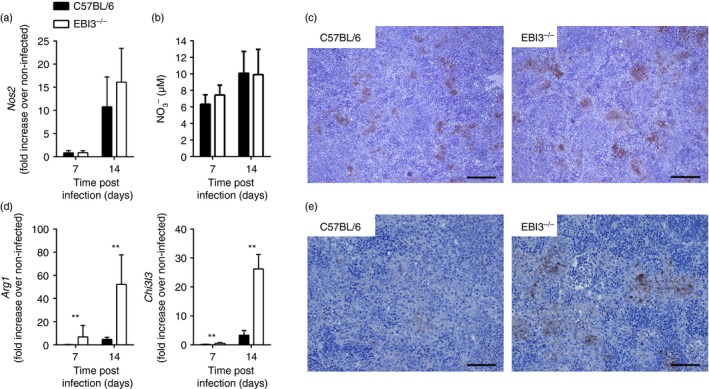
Increased splenic arginase‐1 expression in Trypanosoma cruzi‐infected Epstein–Barr virus‐induced gene 3‐deficient (EBI3−/−) mice. C57BL/6 and EBI3−/− mice were infected intraperitoneally with 500 T. cruzi blood trypomastigotes. The mRNA expression of Nos2 (a), Arg1 and Chi3l3 (d) in spleens was quantified by real‐time PCR at the indicated time‐points post infection. (b) Serum nitrate levels were determined by Griess reaction. Results are expressed as means ± SD of four or five mice per group. Statistical significance (**P ≤ 0·01) is shown compared with C57BL/6 wild‐type mice. (c, e) Spleen sections were stained for nitric oxide synthase 2 (NOS2) (c) or arginase‐1 (e) and counterstained with haematoxylin & eosin on day 14 post infection. Representative sections from five mice per group are shown. Bar, 200 μm. Every experiment was performed two or three times, showing similar results each time.
Enhanced Th2 immune responses in EBI3−/− mice contribute to increased parasitaemia and mortality during T. cruzi infection
Because Th2 immune responses have been associated with susceptibility to T. cruzi infection, we next sought to determine the effect of IL‐4 neutralization on parasitaemia and mortality in EBI3−/− mice. Therefore, mice were inoculated with 50 parasites and EBI3−/− mice were treated with anti‐IL‐4 at days – 1, 3, 7, 10, 14, 17 and 21 post infection (Fig. 6a,b). Control animals received PBS injection. Blockade of IL‐4 led to a reduction of parasitaemia during infection (Fig. 6a); however, treated EBI3−/− mice were not able to control parasite replication to the same extent as C57BL/6 mice. Nevertheless, IL‐4 neutralization resulted in a significantly prolonged survival compared with PBS‐treated EBI3−/− animals (Fig. 6b). Hence, augmented IL‐4 production due to EBI3 deficiency was responsible for the increased parasite replication and the enhanced mortality rate. Th2‐dependent alternatively activated macrophages might favour intracellular growth of T. cruzi parasites through the arginase‐1‐dependent synthesis of polyamines, which are essential for intracellular parasite replication. To determine whether the augmented arginase‐1 expression of alternatively activated macrophage promotes parasite growth, we inhibited arginase‐1 activity by daily norNOHA‐injection starting 2 days before T. cruzi infection. Arginase‐1 inhibition in EBI3−/− mice resulted in reduced parasitaemia in comparison with PBS‐treated EBI3−/− mice (Fig. 6c), but failed to influence the mortality rate (Fig. 6d).
Figure 6.
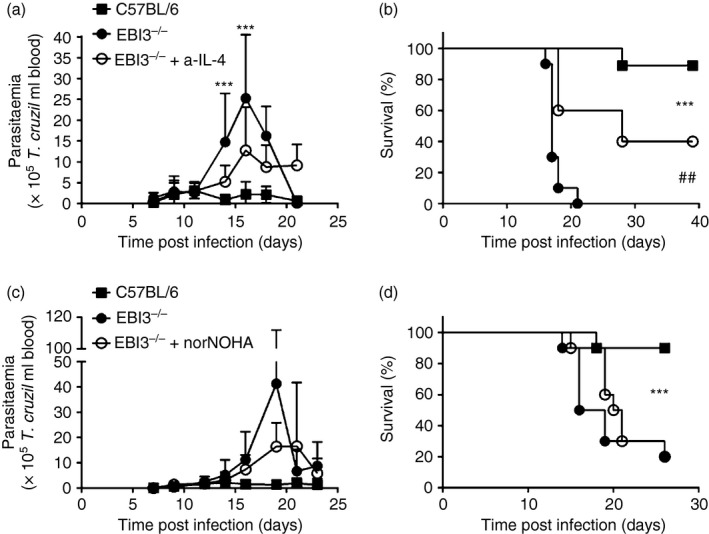
Inhibition of T helper type 2 (Th2) responses reduces parasitaemia in Epstein–Barr virus‐induced gene 3‐deficient (EBI3−/−) mice. C57BL/6 and EBI3−/− mice were infected intraperitoneally with a sublethal dose of 50 Trypanosoma cruzi blood trypomastigotes. (a, b) EBI3−/− mice were treated with 1 mg/ml anti‐interleukin‐4 (anti‐IL‐4) at days –1, 3, 7, 10, 14, 17 and 21 post infection. (c, d) EBI3−/− mice were treated daily with 600 μg/200 μl N ω‐hydroxy‐nor‐l‐arginine (norNOHA) starting 2 days before infection. Control animals were treated with the same amount of PBS. Parasitaemia (a, c) and survival (b, d) was assessed during acute infection. Results are expressed as means ± SD of five to ten mice per group. Statistical significance (***P ≤ 0·001 and ##P ≤ 0·01, respectively) is indicated between EBI3−/− mice and C57BL/6 mice or between EBI3−/− and anti‐IL‐4‐treated EBI3−/− mice, respectively.
Discussion
We show here that EBI3 contributes to protection against T. cruzi infection during experimental Chagas disease. Infected EBI3−/− mice developed an increased parasitaemia accompanied by an increased mortality compared with infected C57BL/6 mice. In C57BL/6 animals, Th1 and Th17 immune responses are induced during T. cruzi infection; however, in EBI3−/− animals an overproduction of various Th1 and Th17 cytokines occurs. Even more important, infected EBI3−/− mice displayed enhanced Th2 immune responses, whereas T. cruzi parasites failed to induce Th2 cytokines in C57BL/6 animals. Because augmented production of Th2 cytokines has been clearly associated with susceptibility to T. cruzi infection5, 7, 8, 9 the elevated Th2 immune response may account for the unrestricted parasite growth in EBI3−/− mice.
The differential induction of Th1, Th17 and Th2 immune responses in C57BL/6 and EBI3−/− mice resulted in a different outcome of macrophage activation in these two mouse groups. After infection, both C57BL/6 and EBI3−/− mice displayed similar classical macrophage activation with a comparable NOS2 expression and production of reactive nitrogen intermediates. In C57BL/6 mice, this activation was associated with restricted parasite growth. However, in contrast to C57BL/6 mice, EBI3−/− mice displayed a pronounced development of alternatively activated macrophages with increased arginase‐1 expression during infection. Macrophages with elevated arginase‐1 activity, induced by either IL‐4 or the T. cruzi component cruzipain, favour T. cruzi parasite replication and blockade of arginase‐1 leads to parasite growth restriction.11, 12 In accordance with this, the IL‐4‐dependent arginase‐1 production is responsible for increased parasite replication in EBI3−/− mice, because neutralization of IL‐4 and blockade of arginase‐1 resulted in reduction of parasitaemia. Also in IL‐27Rα −/− mice, an increased IL‐4 production is responsible for higher parasite burdens.24 Increased arginase‐1 expression can promote parasite replication by two possible mechanisms: (i) the depletion of the substrate l‐arginine, which is also used by NOS2 to generate NO; (ii) the production of polyamines, which might be essential for intracellular T. cruzi replication. These mechanisms are not mutually exclusive and might both account for the unrestrained parasite growth in EBI3−/− mice. However, as we found unaffected nitrate levels in the sera of EBI3−/− mice, we suggest that the latter mechanism might be responsible for the increased parasitaemia. At least during experimental Leishmania infection, the arginase‐1‐mediated production of polyamines is responsible for intracellular parasite growth.34
Although blockade of IL‐4 and arginase‐1 reduced parasitaemia in EBI3−/− mice, anti‐IL‐4‐treated and norNOHA‐treated animals were not able to control parasitaemia to the same extent as C57BL/6 mice. Therefore, other mechanisms might contribute to loss of protection in EBI3−/− mice. Naive EBI3−/− mice exhibit markedly reduced numbers of natural killer T (NKT) cells35 and also during T. cruzi infection we observed a reduction in the percentages of NKT cells compared with C57BL/6 mice. Because NKT cells provide protection against T. cruzi, at least against the CL strain,36 we hypothesize that the reduced percentage of NKT cells might account for the failure to completely restrict parasite growth in anti‐IL‐4‐treated and norNOHA‐treated EBI3−/− mice.
In our study, high parasitaemia is accompanied by enhanced mortality rates, albeit we did not observe an increase in pathology in EBI3−/− mice during low‐dose T. cruzi infection, suggesting that the increased parasitaemia might account for the increased mortality. In contrast, IL‐27Rα −/− mice displayed increased pathology during T. cruzi infection, which was clearly responsible for the increased mortality observed.24 This discrepancy might be due to different inoculum sizes, as we infected with 500 parasites whereas Hamano et al. used 1 × 10⁴ parasites for infection.24 When EBI3−/− mice were injected with higher doses of T. cruzi parasites, these mice also exhibited increased liver damage compared with C57BL/6 mice. Additionally, high‐dose‐infected EBI3−/− mice displayed overwhelming IFN‐γ and IL‐17A cytokine production compared with C57BL/6 mice (data not shown). Interferon‐γ is clearly associated with pathology during T. cruzi infection.24 In addition, IL‐17A has been previously shown to be involved in liver tissue damage, for example in human alcoholic liver disease37 or during Toxoplasma gondii infection.38 Infection of IL‐17A−/− mice with T. cruzi resulted in less severe liver damage, indicating that IL‐17A is involved in T. cruzi‐induced hepatic pathology.4 Therefore, we suggest that the augmented IFN‐γ and IL‐17A production in high‐dose‐infected EBI3−/− mice is responsible for the increased liver pathology. However, during low‐dose infection, the increased parasitaemia might account for the increased mortality. Consequently, the improved parasite control after IL‐4 neutralization is accompanied by longer survival rates during low‐dose infection. During high‐dose infection, an IL‐4 treatment of infected EBI3−/− mice would presumably affect the parasitaemia, but not the survival rate, as the higher immunopathology also contributes to the mortality rate, as shown for IL‐27Rα −/− mice24.
In contrast, norNOHA‐injection, which also reduced parasite burdens in EBI3−/− mice, failed to improve the survival rate. However, norNOHA has the side effect of inhibiting the host's urea cycle, which might contribute to the death of treated animals.
Taken together, in accordance with the anti‐inflammatory properties of IL‐27 and IL‐35, EBI3−/− mice displayed enhanced frequencies of CD4+ T cells and augmented Th1, Th17 and Th2 immune responses during T. cruzi infection. Interleukin‐27 uses the receptor chains gp130 and IL‐27Rα,39 whereas IL‐35 signals through the receptor chains IL‐12Rβ and gp130.40 A modulatory role of IL‐27 during T. cruzi infection has already been demonstrated by the infection of IL‐27Rα −/− mice,24 which exclusively lack the IL‐27 signalling. However, the role of IL‐35 is less clear. Because EBI3−/− mice lack both IL‐27 and IL‐35, differences between IL‐27Rα −/− and EBI3−/− mice could be due to the effect of IL‐35. A remarkable difference between IL‐27 and IL‐35 is their impact on Foxp3+ T cells. Whereas IL‐35 induces the development of Foxp3+ Treg cells,27 IL‐27 inhibits their development.41, 42 As we found no differences in the development of Foxp3+ Treg cells between EBI3−/− mice and C57BL/6 mice, IL‐27 might be more relevant than IL‐35 and exerts its inhibitory properties independent of Treg cells. However, B‐cell‐derived IL‐35 has recently been shown to act anti‐inflammatory, most probably on the antigen‐presenting function of B cells.26 However, because B cells in general have only a secondary role for protective immune responses during experimental Chagas disease43 and, more importantly, IL‐10‐producing B1 cells have been shown to mediate susceptibility to T. cruzi infection,44 IL‐35 produced by ‘regulatory’ plasma cells may contribute to the anti‐inflammatory property of EBI3.
In summary, EBI3 is required for control of T. cruzi infection by inhibiting Th2‐dependent alternative macrophage activation.
Disclosures
The authors have no conflicting financial interests.
Acknowledgements
This work was supported by the Cluster of Excellence Inflammation‐at‐Interfaces (EXC306).
The authors thank Johanna Volz, Alexandra Hölscher and Christiane Steeg for excellent technical assistance. We are grateful to Mark Birkenbach for providing EBI3−/− mice. We are also grateful to Kerstin Traxel and Gabriele Röver for supplying and cleaning the laboratory and to Ilka Monath for organising the animal facility and taking care of the mice.
JBö and CR designed and performed the experiments and analysed the results; JBe and TJ participated in experiments and analyses; CH and HE designed the study and drafted the figures and manuscript: CH, JBö and HE revised the manuscript.
References
- 1. World Health Organization : Chagas disease (American trypanosomiasis), Fact sheet No. 340. 2015.
- 2. Vespa GN, Cunha FQ, Silva JS. Nitric oxide is involved in control of Trypanosoma cruzi‐induced parasitemia and directly kills the parasite in vitro . Infect Immun 1994; 62:5177–82. [DOI] [PMC free article] [PubMed] [Google Scholar]
- 3. Hölscher C, Köhler G, Müller U, Mossmann H, Schaub GA, Brombacher F. Defective nitric oxide effector functions lead to extreme susceptibility of Trypanosoma cruzi‐infected mice deficient in γ interferon receptor or inducible nitric oxide synthase. Infect Immun 1998; 66:1208–15. [DOI] [PMC free article] [PubMed] [Google Scholar]
- 4. Erdmann H, Roßnagel C, Böhme J, Iwakura Y, Jacobs T, Schaible UE et al IL‐17A promotes macrophage effector mechanisms against Trypanosoma cruzi by trapping parasites in the endolysosomal compartment. Immunobiology 2013; 218:910–23. [DOI] [PubMed] [Google Scholar]
- 5. Abrahamsohn IA, Coffman RL. Trypanosoma cruzi: IL‐10, TNF, IFN‐γ, and IL‐12 regulate innate and acquired immunity to infection. Exp Parasitol 1996; 84:231–44. [DOI] [PubMed] [Google Scholar]
- 6. Hölscher C, Mohrs M, Dai WJ, Köhler G, Ryffel B, Schaub GA et al Tumor necrosis factor α‐mediated toxic shock in Trypanosoma cruzi‐infected interleukin 10‐deficient mice. Infect Immun 2000; 68:4075–83. [DOI] [PMC free article] [PubMed] [Google Scholar]
- 7. Gazzinelli RT, Oswald IP, Hieny S, James SL, Sher A. The microbicidal activity of interferon‐γ‐treated macrophages against Trypanosoma cruzi involves an l‐arginine‐dependent, nitrogen oxide‐mediated mechanism inhibitable by interleukin‐10 and transforming growth factor‐β . Eur J Immunol 1992; 22:2501–6. [DOI] [PubMed] [Google Scholar]
- 8. Abrahamsohn Ia, da Silva aP, Coffman RL. Effects of interleukin‐4 deprivation and treatment on resistance to Trypanosoma cruzi . Infect Immun 2000;68:1975–9. [DOI] [PMC free article] [PubMed] [Google Scholar]
- 9. Hiyama K, Hamano S, Nakamura T, Nomoto K, Tada I. IL‐4 reduces resistance of mice to Trypanosoma cruzi infection. Parasitol Res 2001; 87:269–74. [DOI] [PubMed] [Google Scholar]
- 10. Hunter CA, Ellis‐Neyes LA, Slifer T, Kanaly S, Grunig G, Fort M et al IL‐10 is required to prevent immune hyperactivity during infection with Trypanosoma cruzi . J Immunol 1997; 158:3311–6. [PubMed] [Google Scholar]
- 11. Stempin CC, Tanos TB, Coso OA, Cerban FM. Arginase induction promotes Trypanosoma cruzi intracellular replication in cruzipain‐treated J774 cells through the activation of multiple signaling pathways. Eur J Immunol 2004; 34:200–9. [DOI] [PubMed] [Google Scholar]
- 12. Stempin C, Giordanengo L, Gea S, Cerban F. Alternative activation and increase of Trypanosoma cruzi survival in murine macrophages stimulated by cruzipain, a parasite antigen. J Leukoc Biol 2002; 72:727–34. [PubMed] [Google Scholar]
- 13. Michailowsky V, Silva NM, Rocha CD, Vieira LQ, Lannes‐Vieira J, Gazzinelli RT. Pivotal role of interleukin‐12 and interferon‐γ axis in controlling tissue parasitism and inflammation in the heart and central nervous system during Trypanosoma cruzi infection. Am J Pathol 2001; 159:1723–33. [DOI] [PMC free article] [PubMed] [Google Scholar]
- 14. Müller U, Köhler G, Mossmann H, Schaub GA, Alber G, Di Santo JP et al IL‐12‐independent IFN‐γ production by T cells in experimental Chagas’ disease is mediated by IL‐18. J Immunol 2001; 167:3346–53. [DOI] [PubMed] [Google Scholar]
- 15. Galvao Da Silva AP, Jacysyn JF, De Almeida Abrahamsohn I. Resistant mice lacking interleukin‐12 become susceptible to Trypanosoma cruzi infection but fail to mount a T helper type 2 response. Immunology 2003;108:230–7. [DOI] [PMC free article] [PubMed] [Google Scholar]
- 16. Lucas S, Ghilardi N, Li J, de Sauvage FJ. IL‐27 regulates IL‐12 responsiveness of naive CD4+ T cells through Stat1‐dependent and ‐independent mechanisms. Proc Natl Acad Sci USA 2003; 100:15047–52. [DOI] [PMC free article] [PubMed] [Google Scholar]
- 17. Takeda A, Hamano S, Yamanaka A, Hanada T, Ishibashi T, Mak TW et al Cutting edge: role of IL‐27/WSX‐1 signaling for induction of T‐bet through activation of STAT1 during initial Th1 commitment. J Immunol 2003; 170:4886–90. [DOI] [PubMed] [Google Scholar]
- 18. Yoshida H, Hamano S, Senaldi G, Covey T, Faggioni R, Mu S et al WSX‐1 is required for the initiation of Th1 responses and resistance to L. major infection. Immunity 2001; 15:569–78. [DOI] [PubMed] [Google Scholar]
- 19. Batten M, Li J, Yi S, Kljavin NM, Danilenko DM, Lucas S et al Interleukin 27 limits autoimmune encephalomyelitis by suppressing the development of interleukin 17‐producing T cells. Nat Immunol 2006; 7:929–36. [DOI] [PubMed] [Google Scholar]
- 20. Stumhofer JS, Laurence A, Wilson EH, Huang E, Tato CM, Johnson LM et al Interleukin 27 negatively regulates the development of interleukin 17‐producing T helper cells during chronic inflammation of the central nervous system. Nat Immunol 2006; 7:937–45. [DOI] [PubMed] [Google Scholar]
- 21. Villarino A, Hibbert L, Lieberman L, Wilson E, Mak T, Yoshida H et al The IL‐27R (WSX‐1) is required to suppress T cell hyperactivity during infection. Immunity 2003; 19:645–55. [DOI] [PubMed] [Google Scholar]
- 22. Artis D, Villarino A, Silverman M, He W, Thornton EM, Mu S et al The IL‐27 receptor (WSX‐1) is an inhibitor of innate and adaptive elements of type 2 immunity. J Immunol 2004; 173:5626–34. [DOI] [PubMed] [Google Scholar]
- 23. Hölscher C, Hölscher A, Rückerl D, Yoshimoto T, Yoshida H, Mak T et al The IL‐27 receptor chain WSX‐1 differentially regulates antibacterial immunity and survival during experimental tuberculosis. J Immunol 2005; 174:3534–44. [DOI] [PubMed] [Google Scholar]
- 24. Hamano S, Himeno K, Miyazaki Y, Ishii K, Yamanaka A, Takeda A et al WSX‐1 is required for resistance to Trypanosoma cruzi infection by regulation of proinflammatory cytokine production. Immunity 2003; 19:657–67. [DOI] [PubMed] [Google Scholar]
- 25. Collison LW, Workman CJ, Kuo TT, Boyd K, Wang Y, Vignali KM et al The inhibitory cytokine IL‐35 contributes to regulatory T‐cell function. Nature 2007; 450:566–9. [DOI] [PubMed] [Google Scholar]
- 26. Shen P, Roch T, Lampropoulou V, O'Connor Ra, Stervbo U, Hilgenberg E et al IL‐35‐producing B cells are critical regulators of immunity during autoimmune and infectious diseases. Nature 2014;507:366–70. [DOI] [PMC free article] [PubMed] [Google Scholar]
- 27. Niedbala W, Wei X‐Q, Cai B, Hueber AJ, Leung BP, McInnes IB et al IL‐35 is a novel cytokine with therapeutic effects against collagen‐induced arthritis through the expansion of regulatory T cells and suppression of Th17 cells. Eur J Immunol 2007; 37:3021–9. [DOI] [PubMed] [Google Scholar]
- 28. González FB, Villar SR, Fernández Bussy R, Martin GH, Pérol L, Manarin R et al Immunoendocrine dysbalance during uncontrolled T. cruzi infection is associated with the acquisition of a Th‐1‐like phenotype by Foxp3+ T cells. Brain Behav Immun 2015; 45:219–32. [DOI] [PMC free article] [PubMed] [Google Scholar]
- 29. Ouaissi A, Guilvard E, Delneste Y, Caron G, Magistrelli G, Herbault N et al The Trypanosoma cruzi Tc52‐released protein induces human dendritic cell maturation, signals via Toll‐like receptor 2, and confers protection against lethal infection. J Immunol 2002; 168:6366–74. [DOI] [PubMed] [Google Scholar]
- 30. Oliveira AC, Peixoto JR, de Arruda LB, Campos Ma, Gazzinelli RT, Golenbock DT et al Expression of functional TLR4 confers proinflammatory responsiveness to Trypanosoma cruzi glycoinositolphospholipids and higher resistance to infection with T. cruzi . J Immunol 2004;173:5688–96. [DOI] [PubMed] [Google Scholar]
- 31. Petersen CA, Krumholz KA, Burleigh BA. Toll‐like receptor 2 regulates interleukin‐1β‐dependent cardiomyocyte hypertrophy triggered by Trypanosoma cruzi . Infect Immun 2005; 73:6974–80. [DOI] [PMC free article] [PubMed] [Google Scholar]
- 32. Campos MA, Closel M, Valente EP, Cardoso JE, Akira S, Alvarez‐Leite JI et al Impaired production of proinflammatory cytokines and host resistance to acute infection with Trypanosoma cruzi in mice lacking functional myeloid differentiation factor 88. J Immunol 2004; 172:1711–8. [DOI] [PubMed] [Google Scholar]
- 33. Koga R, Hamano S, Kuwata H, Atarashi K, Ogawa M, Hisaeda H et al TLR‐dependent induction of IFN‐β mediates host defense against Trypanosoma cruzi . J Immunol 2006; 177:7059–66. [DOI] [PubMed] [Google Scholar]
- 34. Kropf P, Fuentes JM, Fähnrich E, Arpa L, Herath S, Weber V et al Arginase and polyamine synthesis are key factors in the regulation of experimental leishmaniasis in vivo . FASEB J 2005; 19:1000–2. [DOI] [PubMed] [Google Scholar]
- 35. Nieuwenhuis EE, Neurath MF, Corazza N, Iijima H, Trgovcich J, Wirtz S et al Disruption of T helper 2‐immune responses in Epstein–Barr virus‐induced gene 3‐deficient mice. Proc Natl Acad Sci USA 2002; 99:16951–6. [DOI] [PMC free article] [PubMed] [Google Scholar]
- 36. Duthie MS, Kahn SJ. During acute Trypanosoma cruzi infection highly susceptible mice deficient in natural killer cells are protected by a single α‐galactosylceramide treatment. Immunology 2006; 119:355–61. [DOI] [PMC free article] [PubMed] [Google Scholar]
- 37. Lemmers A, Moreno C, Gustot T, Marechal R, Degre D, Demetter P et al The interleukin‐17 pathway is involved in human alcoholic liver disease. Hepatology 2009; 49:646–57. [DOI] [PubMed] [Google Scholar]
- 38. Kelly MN, Kolls JK, Happel K, Schwartzman JD, Schwarzenberger P, Combe C et al Interleukin‐17/interleukin‐17 receptor‐mediated signaling is important for generation of an optimal polymorphonuclear response against Toxoplasma gondii infection. Infect Immun 2005; 73:617–21. [DOI] [PMC free article] [PubMed] [Google Scholar]
- 39. Pflanz S, Hibbert L, Mattson J, Rosales R, Vaisberg E, Bazan JF et al WSX‐1 and glycoprotein 130 constitute a signal‐transducing receptor for IL‐27. J Immunol 2004; 172:2225–31. [DOI] [PubMed] [Google Scholar]
- 40. Collison LW, Delgoffe GM, Guy CS, Vignali KM, Chaturvedi V, Fairweather D et al The composition and signaling of the IL‐35 receptor are unconventional. Nat Immunol 2012; 13:290–9. [DOI] [PMC free article] [PubMed] [Google Scholar]
- 41. Huber M, Steinwald V, Guralnik A, Brüstle A, Kleemann P, Rosenplänter C et al IL‐27 inhibits the development of regulatory T cells via STAT3. Int Immunol 2008; 20:223–34. [DOI] [PubMed] [Google Scholar]
- 42. Neufert C, Becker C, Wirtz S, Fantini MC, Weigmann B, Galle PR et al IL‐27 controls the development of inducible regulatory T cells and Th17 cells via differential effects on STAT1. Eur J Immunol 2007; 37:1809–16. [DOI] [PubMed] [Google Scholar]
- 43. Kumar S, Tarleton RL. The relative contribution of antibody production and CD8+ T cell function to immune control of Trypanosoma cruzi . Parasite Immunol 1998; 20:207–16. [DOI] [PubMed] [Google Scholar]
- 44. Minoprio P, Cury M, Cheikh E, Murphy E, Hontebeyrie‐joskowicz M, Coffman R et al Xid‐associated resistance to experimental Chagas’ disease is IFN‐γ dependent. J Immunol 1993;151:4200–8. [PubMed] [Google Scholar]