

Abstract.
A scatter imaging technique for the differentiation of cancerous and healthy breast tissue in a heterogeneous sample is introduced in this work. Such a technique has potential utility in intraoperative margin assessment during lumpectomy procedures. In this work, we investigate the feasibility of the imaging method for tumor classification using Monte Carlo simulations and physical experiments. The coded aperture coherent scatter spectral imaging technique was used to reconstruct three-dimensional (3-D) images of breast tissue samples acquired through a single-position snapshot acquisition, without rotation as is required in coherent scatter computed tomography. We perform a quantitative assessment of the accuracy of the cancerous voxel classification using Monte Carlo simulations of the imaging system; describe our experimental implementation of coded aperture scatter imaging; show the reconstructed images of the breast tissue samples; and present segmentations of the 3-D images in order to identify the cancerous and healthy tissue in the samples. From the Monte Carlo simulations, we find that coded aperture scatter imaging is able to reconstruct images of the samples and identify the distribution of cancerous and healthy tissues (i.e., fibroglandular, adipose, or a mix of the two) inside them with a cancerous voxel identification sensitivity, specificity, and accuracy of 92.4%, 91.9%, and 92.0%, respectively. From the experimental results, we find that the technique is able to identify cancerous and healthy tissue samples and reconstruct differential coherent scatter cross sections that are highly correlated with those measured by other groups using x-ray diffraction. Coded aperture scatter imaging has the potential to provide scatter images that automatically differentiate cancerous and healthy tissue inside samples within a time on the order of a minute per slice.
Keywords: x-ray coherent scatter imaging, breast cancer, coded aperture
1. Introduction
Coherent scatter imaging has been shown to spatially differentiate healthy and cancerous breast tissue.1–3 Whereas conventional x-ray imaging provides contrast between different breast tissues primarily based on differences in electron density, coherent scatter imaging provides contrast based on molecular structure in the tissue. The source of this contrast, i.e., changes in molecular structure in the tissue, has been shown to accompany cancer as a disturbance in the structure of collagen in the breast tissue.1,4 As a result, the coherent scatter pattern associated with breast tissue has been demonstrated to consistently differentiate between adipose, fibroglandular, normal ( adipose/fibroglandular) and cancerous tissues.2,5–10
Specifically, the differences in the coherent scatter intensity distributions between cancerous and healthy breast tissue are shown in Fig. 5. As an example of why the coherent scatter behaviors are different for the different tissue-types: adipose tissue is comprised primarily of only fat molecules, whereas fibroglandular, adipose/fibroglandular, and cancerous tissues all contain more complex mixtures of stroma and (often) fat molecules.1 It has been suggested that the fat cells in adipose tissue are aligned to behave with a relatively higher degree of order, which results in adipose tissue having more evidence of diffraction effects or a sharper coherent scatter cross section peak.11
Fig. 5.

Comparison of the coherent scatter differential cross sections [] reconstructed for the voxels labeled in Fig. 3(d) with those from validated x-ray diffraction measurements of homogeneous samples from Kidane et al.11 The correlation of the curves reconstructed here with those from Kidane et al. enables the tissue identification performed in this work. The curves were normalized in order to optimize the match between the literature and experimental results.
Coherent scatter computed tomography (CSCT) has been successfully applied previously to identify malignant and other tissue types in the human body.3,12,13 In order to acquire coherent scatter signal to reconstruct cross-sectional images of the sample, CSCT is usually implemented with a collimated pencil beam of incident x-rays. The beam is raster scanned along two axes and then rotated about the target object at multiple projection angles to generate a tomographic CSCT image. This scanning approach makes it necessary to perform thousands of pencil beam acquisitions in order to reconstruct a three-dimensional (3-D) coherent scatter image of a sample. This process is prohibitively time-consuming and difficult to implement experimentally with high precision, particularly when volumes as large as a breast or lung must be imaged. Moreover, x-ray tube heating coupled with the inefficiency of collimating the source to produce thin pencil beams makes it prohibitive to generate thousands of pencil beams in a clinical setting. Long scan times degrade the clinical effectiveness of the imaging technology not only due to the inconvenience for patients and clinicians but also because patient-motion and its accompanying motion-artifacts become more significant with increasing imaging-time.
In this work, we demonstrate an alternative method of generating 3-D coherent scatter images without a need for tomographic rotation of the sample or of the imaging system.
We design and demonstrate the coded aperture coherent scatter spectral imaging14 technique for breast cancer imaging and diagnosis. Coded aperture coherent scatter spectral imaging, which has been used for material-identification in nonmedical 15,16 and medical 17–19 applications, uses a coded aperture placed in front of the detector to make multiplexed measurements of the scatter. When the coded aperture is placed in front of the x-ray detector, it spatially modulates the scattered x-rays by a frequency dependent on the location of the scatter origin. By identifying the origin of scatter along the pencil beam, the coded aperture enables reconstruction of images of the sample without any need for tomographic rotation.
To demonstrate the technique, we first performed a quantitative assessment of the accuracy of the imaging system using Monte Carlo simulations. We then constructed a pencil beam experimental x-ray coded aperture scatter imaging system and imaged two surgically resected human breast tissue samples. One of the samples contained cancerous tissue and the other did not (known a priori through histology). After imaging, the type of breast tissue in each voxel was identified by matching its reconstructed differential coherent scatter cross section to the known cross sections of different breast tissue types from literature. Volumetric images of the distributions of healthy and cancerous tissue in the samples were generated.
2. Methods
In this section, we first present the (a) Monte Carlo simulations used, (b) experimental implementation of the coded aperture imaging system, and (c) the algorithms used for image reconstruction and tissue classification.
2.1. Monte Carlo Modeling
Monte Carlo simulations of the imaging system were developed in GEANT4.20 We have previously described the use of this simulation in modeling medical imaging systems21,22 and the benchmarking of its electromagnetic physics against experiment.23,24 The code was used in this study to evaluate the accuracy of the imaging system.
A visualization of the Monte Carlo simulation of the coded aperture system is shown in Fig. 1(b). Instead of modeling a point source followed by pinhole collimators, we directly modeled a perfectly collimated pencil beam of x-rays in order to optimize total simulation time.
Fig. 1.
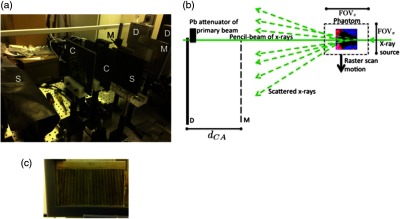
(a) Visualization of the Monte Carlo simulation, (b) picture of experimental implementation, and (c) picture of the coded aperture. In (a) and (b), the letter “S” stands for scatter shield, “C” for pinhole collimator, “M” for coded aperture mask, and “D” for detector. The simulation was modeled based on the experimental setup and was used to quantitatively assess the accuracy of the system for cancerous pixel detection. The coded aperture modulates the detected scattered x-rays to enable resolution along the beam direction, eliminating the need to rotate the sample as in tomography.
The energy spectrum of the x-rays was modeled to resemble an x-ray tube with a tungsten-rhenium anode at 125 kVp—in order to match the spectrum of the x-rays in the experiment—using the XSPECT software.25,26 The x-ray beam fluence in the simulation was made to match the fluence used in the experiment based on x-ray tube mAs: the x-ray tube mAs used in the experiment was recorded, and the x-ray tube mAs used in the simulation can be calculated based on recording the number of x-ray histories that are simulated and converting that number into the corresponding mAs from the fluence per unit mAs values calculated by XSPECT (which for the 125 kVp, tungsten-rhenium anode x-ray tube used in this work was x-rays per mAs in the 0.75 mm-diameter collimated pencil beam). The energy spectrum from XSPECT was validated in two ways: by measuring the directly transmitted x-ray beam spectrum in the experiment using an energy-sensitive photon-counting CdTe detector-array with 6.5 keV full width at half maximum (FWHM) energy resolution that we used for the coherent scatter imaging measurements in this work, and by measuring the Compton scatter off of a known object with a single energy-sensitive pixel (Amptek model XR100T) that has 1 to 2 keV FWHM energy resolution.
Finally, in order to optimize simulation time, the energy-sensitive detector array was modeled as a logical volume that reports 100% quantum or intrinsic detection efficiency along with the energy of each photon, as opposed to modeling it as a CdTe crystal. Spatial binning, energy binning, and energy blurring were performed as postprocessing steps.
The digital breast tissue phantom [Fig. 2(a)] taken from Ref. 27 was formed by inserting a mathematical lesion—whose shape is based on tomosynthesis images of breast tumors—into a 25-mm cube containing a distribution of healthy breast tissues taken from a segmented cone beam CT image of a healthy patient’s breast. Specifically, the lesion shape and size () were generated using a mathematical tumor model based on lesions segmented from high resolution transmission-based tomosynthesis images; the mathematical tumor model that was used was previously shown to be indistinguishable by radiologists from lesions in CT images.28 The tissue distribution was obtained from breast phantoms that comprise segmentations of three tissue-types (pure fibroglandular, pure adipose, and mixtures of the two) from high-resolution CT images of the breasts of a healthy patient. The segmentation was performed using three steps: (1) denoising the images using a 3-D anisotropic diffusion algorithm, (2) applying histogram thresholding to produce initial gland and skin segmentations, and (3) applying a glandular linking and extension protocol based on a skeletonization of the skin and glandular segmentations. This breast phantom and others produced using the same procedure have been shown to mimic realistic breast phantoms.
Fig. 2.

Comparison of the (c) classification results obtained for the reconstructed coherent scatter images from the Monte Carlo simulations with (b) the sampled ground-truth phantom and the (a) modeled phantom. As in Fig. 3(d) and Fig. 6(c), the color scheme used here is white (air), black (cancerous tissue), red ( adipose/fibroglandular tissue), magenta (fibroglandular tissue), and blue (adipose tissue). The sensitivity, specificity, and accuracy for classification of the cancerous pixels are 92.4%, 91.9%, and 92.0%, respectively, supporting the accuracy of the coherent scatter imaging technique for cancer imaging.
Because the electromagnetic interference that occurs between coherently scattered x-rays in diffraction is not inherently modeled in Monte Carlo simulations, we modified the GEANT4 code to model the spatial probabilistic distribution of coherent scattering for each of the different types of breast tissue described in Kidane et al11 (100 breast specimens validated through histological analysis), which are also shown in Fig. 5. The modification of the GEANT4 code is described in more depth in Ref. 29 and 30. Each breast specimen was assigned the coherent scatter attributes of the corresponding tissue type (as well as density from Ref. 31 and atomic composition from Ref. 32) prior to undergoing the simulated scan. Due to our modification, when an x-ray in the simulation undergoes coherent scattering in a breast tissue medium, the scatter angle of the x-ray is chosen based on the differential coherent scatter cross section for that breast tissue-type as measured in Ref. 11, as opposed to the simulation using the differential coherent scatter cross sections for the individual atoms in the medium (e.g., the Hubbell form factors from Ref. 33), which is what is modeled in the code by default.
As in the experimental acquisition, the virtual simulated scan was performed by raster scanning the breast sample through the pencil beam along the direction through a 28-mm field-of-view () in steps of 4 mm. An x-ray tube-current product of 290 mAs (which required the tracking of incident x-rays in the pencil beam in the simulation) was used for each acquisition, which was the x-ray fluence found to provide the best qualitative balance between simulation time and classification accuracy. The Monte Carlo simulations of all raster scans were run on a computer cluster of 300 parallel processors using the technique for distribution described in Ref. 34, which resulted in a 3-hour computational (i.e., x-rays). Other than the FOV and tube-current product, the remaining specifications of the system modeled in the Monte Carlo simulations were identical to the experimental system described in the Sec. 2.2.
2.2. Experimental Data Acquisition
The experimental setup (based on Ref. 14) comprised an x-ray tube, two pinhole collimators, a translation stage, a coded aperture, and a linear array of 128 energy-sensitive x-ray detector pixels. The experimental implementation of the coded aperture scatter imaging system is shown in Fig. 1(a). Each component of the experimental system is described later.
The x-ray tube (Varian model G1593BI) used a rotating tungsten-rhenium anode and a focal spot size of 0.8 mm, operating at 125 kVp and 50 mA. The x-rays were collimated to a pencil beam of diameter 0.75 mm at the detector with angular divergence of using a two-stage collimator. In the first stage, a pair of 1-mm slits was used to collimate the beam to cross section. Then, in the second stage, a 3-mm-thick lead sheet with a 0.75-mm diameter circular hole was used to further collimate the beam to 0.75-mm-diameter circular cross section. The beam spatial profile was verified using a higher spatial-resolution detector, specifically a stationary amorphous silicon indirect cesium iodide (CsI) flat panel energy-integrating detector (Paxscan, 4030 CB series, Varian Medical Systems) with a pixel size of .
Two breast samples were used in this study that were obtained through a protocol approval from the Duke University Health System Institutional Review Board. The pair of samples was surgically excised from the human breast: one was a healthy tissue sample and the other, a matched tumor excised from the same patient [see Fig. 3(a)]. The absence of cancer in the first sample and the presence of it in the second were confirmed using tissue histology (routine clinical workup through H&E staining35 performed prior to the tissue being procured by our group). Both samples weighed approximately 40 g and were roughly 2.5 cm in size. Each breast specimen was placed in the beam separately [see Fig. 6(a)] and scanned using a raster scanning method in (i.e., across the table, perpendicular to the beam) and (i.e., height above the table, perpendicular to the beam) using a computer-controlled translation stage for precise translation of the sample. The imaging was performed in a raster fashion with 2.5-mm-sized steps in both and directions in order to cover a area. Excluding the time required for allowing the x-ray tube to cool down between runs, the time required for this volumetric scan was approximately .
Fig. 3.

Images of the cancerous breast tissue sample scanned experimentally. The scatter intensity reconstructed from the sample is visualized in (b) and (c), whereas the pixels classified into different tissue types is shown in (d). In (d) white is air, black is cancerous tissue, red is adipose/fibroglandular tissue, magenta is fibroglandular tissue, and blue is adipose tissue. The results show that the coherent scatter imaging system is able to detect cancerous voxels inside the breast tissue sample that was known a priori to be cancerous.
Fig. 6.

Images of the healthy breast tissue sample. As in Fig. 3(d), the color scheme used here in Fig. 6(c) is white (air), black (cancerous tissue), red ( adipose/fibroglandular tissue), magenta (fibroglandular tissue), and blue (adipose tissue). The results show that the coherent scatter imaging system is able to rule out the presence of cancerous voxels in this breast tissue sample, which was known a priori to be healthy.
The resolution in (i.e., parallel to the beam) was achieved using the coded aperture. The coded aperture was constructed from a 1-mm slab of bismuth–tin alloy machined into a series of uniform slits [see Fig. 1(c)]. The spatial frequency of the periodic slits was , with each of the slits measuring (). The coded aperture was placed in front of the detector to modulate the scatter.
The scattered x-rays were measured using an array of 128 energy-sensitive CdTe detector pixels (Multix ME-100 Version 2) aligned along the -axis. The first detector pixel was placed at the beam center so that the remaining detector pixels were a known distance along off the beam axis. In addition, a lead attenuator was placed just in front of the first pixel to reduce the primary beam intensity in order to prevent the detector from being saturated by the primary beam. Each detector pixel measured . The spacing between adjacent energy bin centers was 2.2 keV (measured through energy calibration of the detector pixels), and the range of energies was to 160 keV over a total of 64 energy channels. The energy resolution of the detector pixels was 6.5 keV (FWHM) and was nearly uniform over the energy range of the detector.14
2.3. Image Reconstruction and Tissue Classification
Both the Monte Carlo simulation data and the experimental data were reconstructed using the same procedure, described in this subsection. The acquired data for each pencil beam acquisition in both the simulation and experiment were in the form of photon counts across the 128 pixels and 64 energy channels. The differential coherent scatter cross section [] as a function of (which is known as the momentum transfer) and position (i.e., location along the pencil beam) were reconstructed for each pencil beam acquisition using a maximum a posteriori estimation method with total-variation (TV) regularization based on the algorithm developed in Ref. 36. Each pencil beam acquisition was reconstructed separately and then finally combined to form the full image. As mentioned in the Sec. 1, the relative scatter intensity or the shape of the differential cross section [] for a given pixel in the field-of-view as a function of momentum transfer q can be used to identify the type of tissue at that point in space. Therefore, once is reconstructed for each pixel along in each of the pencil beam projections across the sample (in both and ), the resulting voxels in the reconstructed 3-D coded aperture scatter image can be classified to determine the corresponding tissue type: adipose, adipose/fibroglandular, fibroglandular, cancerous tissue (or there may no match) based on the shape of its function. Specifically, we classified each voxel in the 3-D coded aperture scatter images based on a match of its coherent scatter pattern [] with the scatter patterns reported in Kidane et al.11 The match was performed by evaluating the correlation coefficient between the actual (Kidane) and measured (Monte Carlo) scatter patterns. If a given voxel showed a correlation coefficient below 0.8 (minimum threshold value), it was not classified as tissue and was instead classified as air or “nothing.” Mixtures or cases of multiple tissue types within a single voxel were not explicitly considered in this work (other than adipose/fibroglandular tissue).
In the case of the Monte Carlo simulations, the ground-truth phantom is known and can therefore be used to do a quantitative accuracy assessment of the imaging system. The ground-truth phantom was sampled to match the sampling rate used in the reconstructed image, and was then used to calculate the sensitivity (true classification rate of positive voxels), specificity (true classification rate of negative voxels), and accuracy of the imaging system for the detection of cancerous voxels.
3. Results
The first step of this work was to use Monte Carlo simulations of the imaging system in order to evaluate its classification performance against a known ground truth. The classification results of the coherent scatter imaging generated from the imaging system in Monte Carlo simulations are shown in Fig. 2(c), juxtaposed with the ground truth shown in Fig. 2(b). The ground truth image in Fig. 2(b) is the original phantom from Fig. 2(a) used in the simulations but subsampled based on the raster-scan step-size along (4 mm) used in the image acquisition process. When we quantitatively assess the accuracy of the pixel classification—specifically for the task of detecting cancerous pixels—the classification image shown in Fig. 2(c) was found to have a sensitivity (i.e., the percentage of cancerous pixels that were correctly identified as being cancerous) of 92.4%, specificity (i.e., the percentage of healthy pixels correctly identified as healthy) of 91.9%, and accuracy for cancerous pixel detection of 92.0%. The 8% of pixels classified inaccurately were primarily attributed to spatial blurring due to the finite spatial resolution of the system along the -direction (i.e., along beam propagation), Poisson noise and residual model error in the reconstruction. The spatial blurring along leads to misclassification in two ways: (a) detection of signal in pixels where the object was not originally present, and (b) blending of the differential coherent scatter cross sections between neighboring pixels causing one or both of them to be misclassified. Despite this error margin, the imaging system demonstrated high classification accuracy (92%) for cancer classification, strengthening the promise of the technique for experimental implementation.
Experimental coherent scatter images for the cancerous breast tissue sample are shown in Figs. 3(b)–3(d), and volume renderings of the four types of breast tissue classified in the sample are shown in Fig. 4. Figure 3(b) shows the volume rendering of the sample based on its measured scatter intensity, and Figure 3(c) shows the scatter intensity for a single slice through the sample. Figure 3(d) shows the material identification results for the sample with the material type in each pixel classified as one of the four available tissue types: cancerous (black), adipose/fibroglandular (red), adipose (blue) tissue (note: fibroglandular tissue was not explicitly detected in this slice). As expected for this cancerous tissue sample, the classified image showed several pixels of cancerous tissue, which are visible in Fig. 3(d) in the region labeled “A.” It can be seen that the scatter intensity alone from Fig. 3(c), which would be akin to the transmission image, is insufficient to identify regions of cancer.
Fig. 4.

Volume renderings of the four types of tissue in the cancerous tissue sample based on voxel classification results of the reconstructed coherent scatter image from Fig. 3. The coherent scatter imaging technique can be used to determine the distribution of cancerous tissue through the volume, which would prove to be an important capability for diagnostic medical applications such as surgical margin detection.
Figure 5 shows the coherent scatter differential cross sections reconstructed at pixel locations labeled “A,” “B,” and “C” in Fig. 3(d). For reference, Fig. 5 also shows the expected coherent scatter differential cross sections from Kidane et al. for cancerous, adipose/fibroglandular and adipose tissue. The correlation of the curves in Fig. 5 that were reconstructed here to those from Kidane et al. is the basis used for classifying the type of tissue in the voxel. The adipose/fibroglandular and adipose curves measured experimentally in this study strongly resembled the average curves reported by Kidane et al., whereas the carcinoma curves measured here deviated to a certain degree from those reported by Kidane et al. These deviations in our sample could stem from structural changes caused by repeated thawing and freezing of the specimen. In addition, the variations in coherent scatter signal in the cancerous specimen are also caused by the known heterogeneity of cancer: a variety of types of carcinoma occur and samples that fall into the histological classification for carcinoma typically contain some healthy tissue.11
Experimental images for the healthy breast tissue specimen from the same patient are shown in Fig. 6. The material-classified image in Fig. 6(c) shows that no cancerous tissue was present in the sample.
4. Discussion
4.1. Accuracy of Imaging System and Potential Medical Applications
In this work, we measured coherent scatter cross-sections and compared them against theoretical values reported in literature. The match between the experimental and theoretical differential coherent scatter cross sections not only corroborates the utility of coherent scatter imaging in cancer detection, but also attests to the presence of population-invariant attributes that make x-ray diffraction useful for tissue identification and differentiation. The coherent scatter imaging system accurately determined the nature of the specimen (i.e., malignant or healthy) by identifying the tissue type in each voxel within the specimen. Cancer was found only in the specimen known to be malignant, whereas the specimen known to be healthy was classified as adipose/fibroglandular. Finally, the Monte Carlo assessment of the imaging system showed a cancer detection accuracy of 92.0% (Fig. 2).
In current clinical practice, transmission-based x-ray imaging is the most commonly used noninvasive diagnostic technique for breast cancer identification.37 However, the advantage of coherent scatter imaging over conventional transmission imaging lies in its material identification ability, which is shown in Figs. 3(d), 6(c) and 2(c), which comes from the increased contrast between cancerous and healthy tissue that is attainable from the scatter signal as opposed to the transmission signal. In a conventional transmission image, a radiologist must manually read the image and identify suspicious regions to detect cancer or other abnormalities. On the other hand, the coherent scatter images provide the differential coherent scatter cross section for every voxel in the sample that can be used as an identifying molecular signature of the tissue in that voxel, thereby enabling accurate and automatic classification (and subsequently detection) of the disease.
The coded aperture scatter imaging technique described in this work was able to map out the distribution of cancerous breast tissue in the specimen using a single-angle imaging approach (i.e., without any tomographic rotation of the sample or of the imaging system). This approach results in reduced dose and short scan-durations, making it appealing for both ex vivo and in vivo analyses in clinical settings. An example of a clinical application of ex vivo analysis of breast tissue is in surgical margin detection, where a surgically removed tumor must be analyzed to confirm positive margins (i.e., the absence of cancer cells along the periphery of the tumor). The coded aperture scatter imaging technique could be an effective tool to obtain such confirmation through a quick x-ray scan obtained directly in the operating room immediately following surgery.
The results of this work also support the use of coherent scatter imaging for in vivo applications where the path-length of the beam through the object is less than (i.e., the sizes of the tissue samples imaged here). Based on our other investigations using thicker objects,29 the imaging system can be optimized to image thicker objects such as compressed breasts typically imaged through mammography. These findings suggest that coherent scatter imaging could potentially evolve as a standalone diagnostic tool or serve as a complementary tool to mammography for breast cancer detection.
4.2. Future Improvements to Spatial Resolution and Scan Duration
The spatial resolution along the beam () direction determined in this work was (whereas the spatial resolution along the and directions is the beam width, which was 0.75 mm). While this is an encouraging start, it would be insufficient for clinical applications. For example, the long thin spicules that are typically seen in breast lesions have width that is submillimeter,38 which would make them difficult to detect if the spicule were oriented perpendicular to the direction of the imaging system. However, the spatial resolution provided by coherent scatter imaging is most likely superior to the sampling rate achieved using tissue histology which has been shown to sample only 10 to 15% of a tissue specimens surface in intraoperative margin detection.39
The resolution could be improved further. As seen in Fig. 2, the extent along the -direction is larger for the classified object than the ground truth, which is due to the limited spatial resolution achieved by the coded aperture. The use of a coded aperture with finer features or greater spatial frequency would improve this spatial resolution,16 especially at the boundaries of the sample, which are the most important regions of the specimen for the surgical margin application. In addition, acquiring additional projection data at a second view that is 90 deg from the original view would also improve the spatial resolution along the direction. (Acquiring data for a second view will increase the total scan time). Finally, we are currently developing random forest algorithms and spectral unmixing approaches to classification for classifying fractions of each tissue-type in a given voxel, which will result in more accurate cancer-detection results for a fixed spatial resolution.
Similarly, although the scan duration in this work was acceptable (), it can be reduced further by using additional detector pixel arrays: adding detector pixel arrays, which increases the total area across which scattered photons are measured, will increase the intensity of scattered photon signal that we collect per unit of scan time, thereby reducing the scan time that we require. As an example, the Monte Carlo simulations in this study modeled an x-ray tube-current product of , which would result in a scan time of 41 s to acquire the entire slice shown in Fig. 2(c) using an x-ray tube operating at 50 mA (as was used in the experimental part of this work). Increased parallelism in the measurements such as using a fan beam instead of a pencil beam is also a potential future strategy to realize additional speedup in scan time.40
5. Conclusion
In this work, we have demonstrated experimentally that the coded aperture scatter imaging technique can be used to map the distribution of cancerous and other types of breast tissue inside a sample. Using Monte Carlo simulations, we demonstrated that the system has the potential to achieve high cancer detection accuracy (92.0% in this simulation study). The differential coherent scatter cross sections obtained for adipose, adipose/fibroglandular and cancerous tissue in our work closely resembled those measured in other x-ray diffraction studies. Coded aperture scatter imaging can generate volumetric images without the need for tomographic rotation of the sample, and it can map the distribution of different types of breast tissue in the sample automatically (as opposed to requiring a human reader). Therefore, it could serve as an effective tool for analyzing breast tissue samples in a clinical context in the future.
Biographies
Manu N. Lakshmanan is a graduate student at Duke University.
Joel A. Greenberg is an assistant research professor at Duke University.
Ehsan Samei is a professor at Duke University Medical Center.
Anuj J. Kapadia is an assistant professor at Duke University Medical Center.
References
- 1.Round A. R., “Ultra-structural analysis of breast tissue,” PhD Thesis, Cranfield University, Cranfield, Bedfordshire, United Kingdom: (2006). [Google Scholar]
- 2.Sidhu S., et al. , “Classification of breast tissue using a laboratory system for small-angle x-ray scattering (SAXS),” Phys. Med. Biol. 56, 6779–6791 (2011). 10.1088/0031-9155/56/21/002 [DOI] [PubMed] [Google Scholar]
- 3.Ghammraoui B., et al. , “Including the effect of molecular interference in the coherent x-ray scattering modeling in MC-GPU and PENELOPE for the study of novel breast imaging modalities,” Proc. SPIE 9033, 90334N (2014). 10.1117/12.2042799 [DOI] [Google Scholar]
- 4.Theodorakou C., Farquharson M. J., “Human soft tissue analysis using x-ray or gamma-ray techniques,” Phys. Med. Biol. 53, R111–R149 (2008). 10.1088/0031-9155/53/11/R01 [DOI] [PubMed] [Google Scholar]
- 5.Cunha D. M., et al. , “X-ray scattering profiles of some normal and malignant human breast tissues,” X-Ray Spectrom. 35, 370–374 (2006). 10.1002/xrs.921 [DOI] [Google Scholar]
- 6.Ryan E. A., Farquharson M. J., “Breast tissue classification using x-ray scattering measurements and multivariate data analysis,” Phys. Med. Biol. 52, 6679–6696 (2007). 10.1088/0031-9155/52/22/009 [DOI] [PubMed] [Google Scholar]
- 7.Conceição A. L. C., Antoniassi M., Poletti M. E., “Analysis of breast cancer by small angle x-ray scattering (SAXS),” Analyst 134, 1077–1082 (2009). 10.1039/b821434d [DOI] [PubMed] [Google Scholar]
- 8.Elshemey W. M., et al. , “The diagnostic capability of x-ray scattering parameters for the characterization of breast cancer,” Med. Phys. 37(8), 4257 (2010). 10.1118/1.3465046 [DOI] [PubMed] [Google Scholar]
- 9.Pani S., et al. , “Characterization of breast tissue using energy-dispersive x-ray diffraction computed tomography,” Appl. Radiat. Isot. 68, 1980–1987 (2010). 10.1016/j.apradiso.2010.04.027 [DOI] [PubMed] [Google Scholar]
- 10.Elshemey W. M., Mohamed F. S., Khater I. M., “X-ray scattering for the characterization of lyophilized breast tissue samples,” Radiat. Phys. Chem. 90, 67–72 (2013). 10.1016/j.radphyschem.2013.04.019 [DOI] [Google Scholar]
- 11.Kidane G., et al. , “X-ray scatter signatures for normal and neoplastic breast tissues,” Phys. Med. Biol. 44, 1791–802 (1999). 10.1088/0031-9155/44/7/316 [DOI] [PubMed] [Google Scholar]
- 12.Lakshmanan M. N., et al. , “X-ray coherent scatter imaging for surgical margin detection: a Monte Carlo study,” Proc. SPIE 9033, 903361 (2014). 10.1117/12.2043856 [DOI] [Google Scholar]
- 13.Lewis K. G., “Coherent scatter computed tomography (CSCT)—a Monte Carlos simulation study,” PhD Thesis, Vanderbilt University, Nashville, Tennessee: (2013). [Google Scholar]
- 14.Greenberg J. A., Krishnamurthy K., Brady D., “Snapshot molecular imaging using coded energy-sensitive detection,” Opt. Express 21(21), 25480 (2013). 10.1364/OE.21.025480 [DOI] [PubMed] [Google Scholar]
- 15.Greenberg J., Krishnamurthy K., Brady D., “Compressive single-pixel snapshot x-ray diffraction imaging,” Opt. Lett. 39, 111–114 (2014). 10.1364/OL.39.000111 [DOI] [PubMed] [Google Scholar]
- 16.Greenberg J. A., et al. , “Optimization of a coded aperture coherent scatter spectral imaging system for medical imaging,” Proc. SPIE 9412, 94125E (2015). 10.1117/12.2082110 [DOI] [Google Scholar]
- 17.Morris R., et al. , “Mo-f-campus-i-04: characterization of fan beam coded aperture coherent scatter spectral imaging methods for differentiation of normal and neoplastic breast structures,” Med. Phys. 42(6), 3575–3575 (2015). 10.1118/1.4925455 [DOI] [Google Scholar]
- 18.Albanese K., et al. , “Mo-f-campus-i-03: tissue equivalent material phantom to test and optimize coherent scatter imaging for tumor classification,” Med. Phys. 42(6), 3575–3575 (2015). 10.1118/1.4925454 [DOI] [Google Scholar]
- 19.Lakshmanan M. N., et al. , “Experimental implementation of coded aperture coherent scatter spectral imaging of cancerous and healthy breast tissue samples,” Proc. SPIE, 9412, 94121F (2015). 10.1117/12.2082318 [DOI] [PMC free article] [PubMed] [Google Scholar]
- 20.Agostinelli S., et al. , “Geant4—a simulation toolkit,” Nucl. Instrum. Methods A 506(3), 250–303 (2003). 10.1016/S0168-9002(03)01368-8 [DOI] [Google Scholar]
- 21.Lakshmanan M. N., Kapadia A. J., “Quantitative assessment of lesion detection accuracy, resolution, and reconstruction algorithms in neutron stimulated emission computed tomography,” IEEE Trans. Med. Imaging 31, 1426–1435 (2012). 10.1109/TMI.2012.2192134 [DOI] [PubMed] [Google Scholar]
- 22.Lakshmanan M. N., et al. , “Simulations of breast cancer imaging using gamma-ray stimulated emission computed tomography,” IEEE Trans. Med. Imaging 33, 546–555 (2014). 10.1109/TMI.2013.2290287 [DOI] [PubMed] [Google Scholar]
- 23.Lakshmanan M. N., et al. , “Nuclear resonance fluorescence (NRF) in GEANT4: development, validation, and testing,” in IEEE Nucl. Sci. Symp. & Med. Imag. Conf., Anaheim, California, pp. 1731–1734 (2012). 10.1109/NSSMIC.2012.6551406 [DOI] [Google Scholar]
- 24.Lakshmanan M. N., et al. , “Simulations of nuclear resonance fluorescence in Geant4,” Nucl. Instrum. Methods Phys. Res., Sect. A 763, 89–96 (2014). 10.1016/j.nima.2014.06.030 [DOI] [Google Scholar]
- 25.Storm E., “Calculated bremsstrahlung spectra from thick tungsten targets,” Phys. Rev. A 5(6), 2328 (1972). 10.1103/PhysRevA.5.2328 [DOI] [Google Scholar]
- 26.Storm E., “Emission of characteristic L and K radiation from thick tungsten targets,” J. Appl. Phys. 43(6), 2790–2796 (1972). 10.1063/1.1661596 [DOI] [Google Scholar]
- 27.Lakshmanan M. N., et al. , “Volumetric x-ray coherent scatter imaging of cancer in resected breast tissue: a Monte Carlo study using virtual anthropomorphic phantoms,” Phys. Med. Biol. 60(16), 6355–6370 (2015). 10.1088/0031-9155/60/16/6355 [DOI] [PubMed] [Google Scholar]
- 28.Solomon J., Samei E., “A generic framework to simulate realistic lung, liver and renal pathologies in CT imaging,” Phys. Med. Biol. 59(21), 6637 (2014). 10.1088/0031-9155/59/21/6637 [DOI] [PubMed] [Google Scholar]
- 29.Lakshmanan M. N., et al. , “An x-ray scatter system for material identification in cluttered objects: a Monte Carlo simulation study,” Nucl. Instrum. Methods Phys. Res., Sect. B 335, 31–38 (2014). 10.1016/j.nimb.2014.05.021 [DOI] [Google Scholar]
- 30.Kapadia A. J., et al. , “Monte-Carlo simulations of a coded-aperture x-ray scatter imaging system for molecular imaging,” Proc. SPIE 8668, 86680B (2013). 10.1117/12.2008484 [DOI] [Google Scholar]
- 31.Ullman G., et al. , “Implementation of pathologies in the Monte Carlo model in chest and breast imaging,” Tech. Rep. 94, Linkšping University, Linkšping, Sweden: (2003). [Google Scholar]
- 32.Ng K., et al. , “Discriminant analysis of normal and malignant breast tissue based upon INAA investigation of elemental concentration,” App. Rad. Isot. 48(1), 105–109 (1997). 10.1016/S0969-8043(96)00055-3 [DOI] [PubMed] [Google Scholar]
- 33.Hubbell J. H., et al. , “Atomic form factors, incoherent scattering functions, and photon scattering cross sections,” J. Phys. Chem. Ref. Data 4, 471–538 (1975). 10.1063/1.555523 [DOI] [Google Scholar]
- 34.Harrawood B. P., et al. , “GEANT4 distributed computing for compact clusters,” Nucl. Instrum. Methods Phys. Res., Sect. A 764, 11–17 (2014). 10.1016/j.nima.2014.07.014 [DOI] [Google Scholar]
- 35.Cendán J. C., Coco D., Copeland E. M., “Accuracy of intraoperative frozen-section analysis of breast cancer lumpectomy-bed margins,” J. Am. Coll. Surg. 201, 194–198 (2005). 10.1016/j.jamcollsurg.2005.03.014 [DOI] [PubMed] [Google Scholar]
- 36.Greenberg J. A., et al. , “Coding and sampling for compressive x-ray diffraction tomography,” Proc. SPIE 8858, 885813 (2013). 10.1117/12.2027128 [DOI] [Google Scholar]
- 37.Markey M. K., Physics of Mammographic Imaging, CRC Press, Boca Raton, Florida: (2012). [Google Scholar]
- 38.Suri J. S., Rangayyan R. M., Recent Advances in Breast Imaging, Mammography, and Computer-Aided Diagnosis of Breast Cancer, Vol. 155, SPIE Press, Bellingham, Washington: (2006). [Google Scholar]
- 39.Ravi S. B., Annavajjula S., “Surgical margins and its evaluation in oral cancer: a review,” J. Clin. Diagn. Res.: JCDR 8(9), ZE01 (2014). 10.7860/JCDR/2014/9755.4836 [DOI] [PMC free article] [PubMed] [Google Scholar]
- 40.Greenberg J. A., et al. , “Structured illumination for tomographic x-ray diffraction imaging,” Analyst 139, 709–713 (2014). 10.1039/C3AN01641B [DOI] [PubMed] [Google Scholar]