Abstract
Haematopoietic stem and progenitor cell (HSPC) transplant is a widely used treatment for life-threatening conditions including leukemia; however, the molecular mechanisms regulating HSPC engraftment of the recipient niche remain incompletely understood. Here, we developed a competitive HSPC transplant method in adult zebrafish, using in vivo imaging as a non-invasive readout. We used this system to conduct a chemical screen and identified epoxyeicosatrienoic acids (EET) as a family of lipids1,2 that enhance HSPC engraftment. EETs’ pro-haematopoietic effects were conserved in the developing zebrafish embryo, where 11,12-EET promoted HSPC specification by activating a unique AP-1/runx1 transcription program autonomous to the haemogenic endothelium. This effect required the activation of the PI3K pathway, specifically PI3Kγ. In adult HSPCs, 11,12-EET induced transcriptional programs, including AP-1 activation, which modulate multiple cellular processes, such as migration, to promote engraftment. Finally, we demonstrated that the EET effects on enhancing HSPC homing and engraftment are conserved in mammals. Our study established a novel method to explore the molecular mechanisms of HSPC engraftment, and discovered a previously unrecognized, evolutionarily conserved pathway regulating multiple haematopoietic generation and regeneration processes. EETs may have clinical application in marrow or cord blood transplantation.
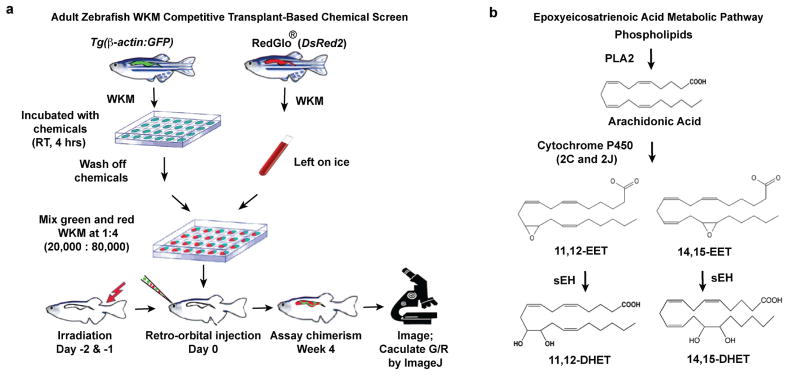
Transplanting zebrafish whole kidney marrow (WKM), the equivalent of mammalian whole bone marrow (WBM), can rescue lethally irradiated zebrafish as well as mutants with haematopoietic defects3–5. In an effort to quantify HSPC activity in zebrafish, we developed a competitive transplantation system in a transparent mutant zebrafish, casper, which allows visualization of engraftment in vivo6. We co-injected WKM cells from two ubiquitous green and red transgenic donors, Tg(β-actin:GFP)4 and RedGlo® fish7, into sub-lethally irradiated casper (Fig. 1a). We could directly visualize donor-derived green and red fluorescence within the same kidney region, and calculate relative engraftment as the ratio of the green-to-red fluorescence intensity (G/R) (Fig. 1b). This assay enables quick, quantitative, and non-invasive evaluation of marrow engraftment repeatedly over time, even up to 3 months post transplant. We validated the quantitative potential of this imaging-based approach by comparing with flow cytometry-based analysis of WKM from the same recipient. The two results were linearly correlated (Fig. 1c). The assay was also sensitive to changes in the relative number of green-tored donor cells. We observed an increase of recipient G/R readouts accompanying the increasing green-to-red ratio of transplanted donor cells (Fig. 1d). Additionally, our system successfully detected the effects of two known chemical modulators of HSPC engraftment: dmPGE2 (16, 16-dimethyl-prostaglandin E2), a stabilized derivative of PGE28, and BIO (6-bromoindirubin-3′-oxime), a GSK-3β inhibitor9. Green WKM transiently exposed for 4 hrs to either of these chemicals and transplanted together with untreated red WKM showed significantly enhanced engraftment capability compared to vehicle-only controls (Fig. 1e). Therefore, within the cell dose and ratio range tested above, our zebrafish competitive transplantation system can successfully detect changes of relative engraftment of HSPCs.
Figure 1. Zebrafish whole kidney marrow (WKM) competitive transplantation-based chemical screen identifies EETs as enhancers of marrow engraftment.
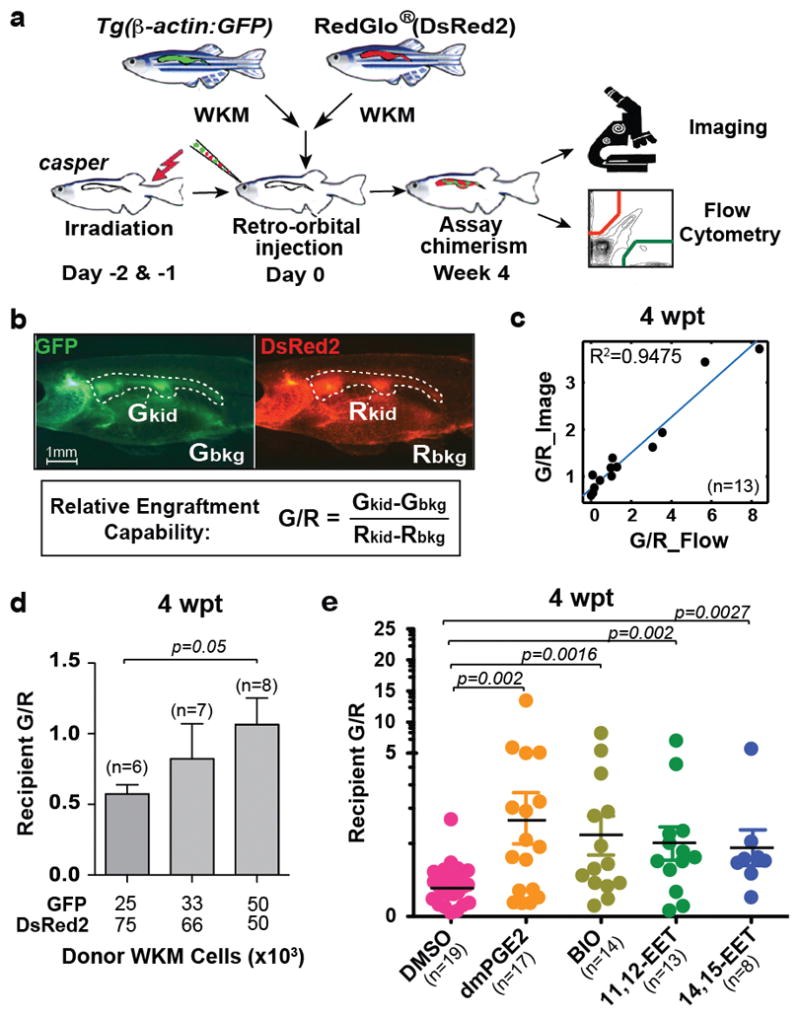
a, Schematic of zebrafish WKM competitive transplantation. b, Calculation of relative engraftment capability (G/R). White dashed line: kidney; Gkid/Rkid, kidney fluorescence intensity; Gbkg/Rbkg, background fluorescence intensity. c, The G/R ratios from imaging linearly correlated with flow cytometry analysis of the same recipients (linear regression). wpt, weeks post transplant. d, Serial dilution competitive transplantation with varying donor GFP:DsRed2 ratios. e, 4 hr transient chemical treatment increased WKM engraftment. 11,12- and 14,15-EET, 0.5 μM. Unpaired two-tailed t-test, mean with s.e.m. (d–e).
To our knowledge, a screen-based forward-genetic approach to understand transplantation biology has never been attempted. We used our assay to screen 480 compounds with known bioactivities, which had been selected to cover diverse signaling pathways (Extended Data Fig. 1a). 10 compounds significantly increased the G/R ratio reproducibly, including PGE2 and Ro 20-1724, which activates the cAMP pathway downstream of PGE28. The other hits target pathways that previously have not been linked to HSPC engraftment, including 11,12-epoxyeicosatrienoic acid (EET) and 14,15-EET (Fig. 1e). These are arachidonic acid-derived eicosanoids synthesized through the cytochrome P450 epoxygenase pathway (Extended Data Fig. 1b)1,2. A gene expression study previously reported mouse Cyp2j6, a cytochrome P450 epoxygenase, as one of the 93 genes enriched in long-term HSC10.
Despite years of research on the potent effects of EETs in numerous physiological processes11–13, knowledge about their direct target(s) and downstream pathway(s) is still very limited. To tackle this problem, a robust system allowing easy genetic perturbation is crucial. Since adult regeneration often reactivates pathways important for development, we decided to probe EETs’ effects on haematopoiesis during embryo development. Analogous to mammalian development, zebrafish HSPCs form from a flk1+ population, named haemogenic endothelium, at 24 hpf (hours post fertilization) and become runx1+ at 36 hpf in the evolutionarily conserved aorta-gonad-mesonephros (AGM) region14–16. HSPCs enter circulation after they emerge from the AGM15–17, and seed the caudal haematopoietic tissue (CHT), a secondary haematopoietic site equivalent to the mammalian fetal liver (Fig. 2a)18,19. 11,12-EET treatment between 24–36 hpf strongly increased the HSPC marker runx1 in the AGM, and surprisingly induced runx1 in a non-haematopoietic region of the tail mesenchyme, where runx1 is not normally expressed (Fig. 2b). This indicates 11,12-EET might be inducing a conserved transcriptional program. We confirmed this AGM phenotype with in vivo time-lapse imaging of HSPC birth from the haemogenic endothelium. Tg(CD41:GFP; flk1:DsRed2) embryos treated with 11,12-EET starting at 24 hpf showed a significant increase in the number of double-positive HSPCs in the AGM from 30–46 hpf (Fig. 2c–d). Single-cell analysis showed this change is mainly due to a significant increase in the frequency of HSPCs directly specified from the haemogenic endothelium, while no increase in the rate of cell division or AGM retention was observed (Extended Data Fig. 2). The additional HSPCs produced upon 11,12-EET treatment successfully homed to their next niche, resulting in increased numbers of HSPCs in the CHT, which was verified by in situ hybridization for the HSPC marker cmyb (Fig. 2e, Extended Data Fig. 3). Time-lapse imaging of Tg(Runx1+23:GFP) zebrafish showed that 11,12-EET treatment between 24–48 hpf increased the rate of arrival of GFP+ HSPCs to the CHT (Fig. 2f, Supplementary Video 1,2), presumably due to enhanced HSPC specification in the AGM.
Figure 2. 11,12-EET enhances HSPC specification in the zebrafish embryo AGM.
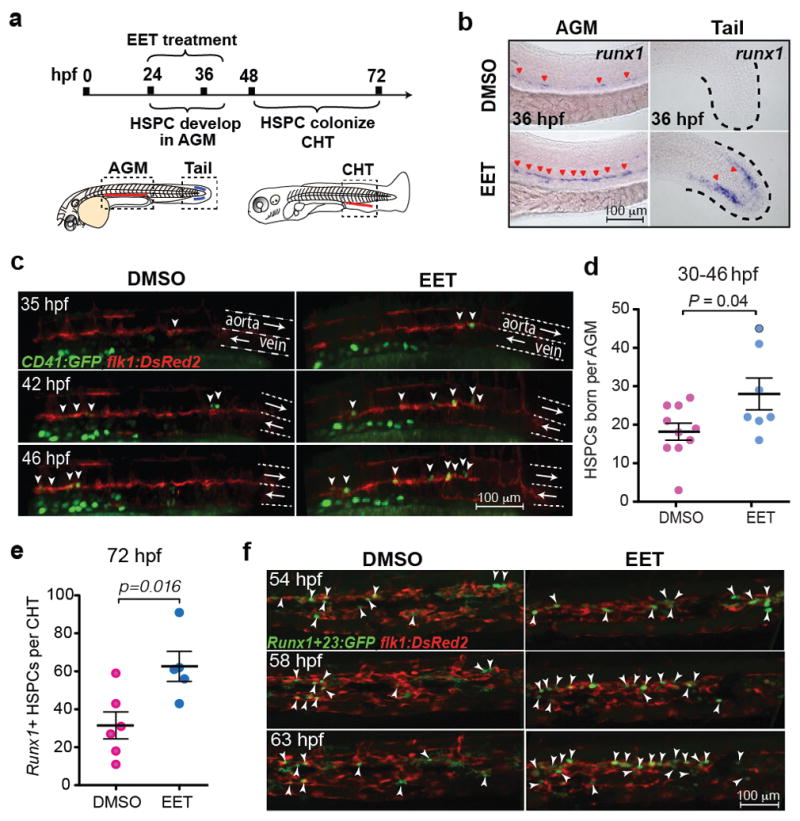
a, Schematic of HSPC development in zebrafish embryos. hpf, hours post fertilization; AGM, aorta-gonad-mesonephros; CHT, caudal haematopoietic tissue. b, Representative images of whole-mount in situ hybridization showing 11,12-EET (24–36 hpf treatment) induced HSPC marker runx1 in the AGM and a tail non-haematopoietic tissue (>8 independent experiments, n>100). c–d, 11,12-EET (24–46 hpf) enhanced CD41:GFP/flk1:NRAS-mCherry double positive HSPCs (white arrowheads) emerging in the AGM. Arrows indicate blood flow. e–f, Same treatment increased the number of HSPCs in the CHT. mCherry+ HSPCs quantified in the Tg(Runx1+23:mCherry) CHT (e). Representative montage images of Runx1+23:GFP HSPCs (white arrowheads) engrafting CHT. flk1:DsRed2, endothelial cells (f). Unpaired two-tailed t-test, mean with s.e.m. (d–e).
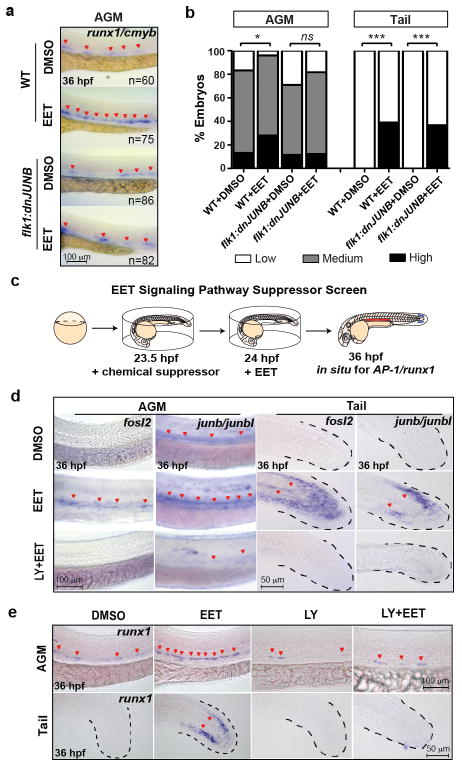
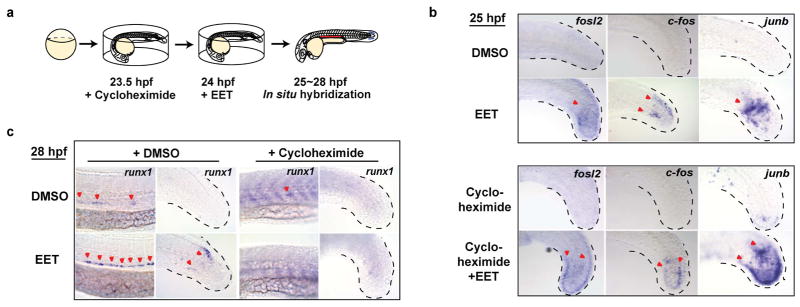
To further dissect the molecular mechanism leading to runx1 induction, we performed microarray analysis on 11,12-EET-treated 36 hpf embryos (Table S3). The upregulation of multiple AP-1 (Activator Protein 1) family transcription factors, including fosl2, and duplicated orthologs of human JUNB, junb and junbl, was among the most prominent changes. Whole-mount in situ hybridization confirmed the induction both in the AGM and the non-haematopoietic region of the tail mesenchyme (Fig. 3d, top two rows). AP-1 mRNA transcripts were detectable within 1 hr of 11,12-EET treatment and insensitive to the protein translation inhibitor cycloheximide (Extended Data Fig. 4a–b), indicating AP-1 members are immediate targets of EET signaling. In contrast, runx1 induction required at least 4 hrs of 11,12-EET treatment and was completely blocked by cycloheximide (Extended Data Fig. 4c). Therefore, we hypothesized that EET-induced AP-1 expression is necessary for increasing runx1 transcription.
Figure 3. 11,12-EET induces a PI3K-dependent AP-1/runx1 transcriptional program to increase HSPC specification.
a–b, Stable flk1:dnJUNB-2A-GFP expression blocking AP-1 function suppressed 11,12-EET-enhanced HSPCs in the AGM. Representative images of runx1/cmyb in situ hybridization (a) and quantification (b) after 11,12-EET treatment (24–36 hpf). Embryos scored as high, medium, or low runx1/cmyb, summed across 4 experiments. *, p=0.01; ***, p<0.0001 by Chi-square. WT, wild-type. c, Schematic of chemical screen for EET signaling pathway suppressors. d–e,11,12-EET induced AP-1 family transcription factors (fosl2, junb/junbl) (d) and runx1 (e), suppressed by cotreatment with LY294002, a PI3K inhibitor, in the AGM and tail (d–e) (3 independent experiments, n>40). Same images from Fig. 2b as staining controls (e).
To genetically test this hypothesis, we globally knocked down AP-1 with anti-sense morpholinos targeting junb/junbl, which blocked runx1 expression without affecting endothelial cells of the AGM (Extended Data Fig. 5), suggesting that AP-1 might be required for HSPC specification from haemogenic endothelium. To test if AP-1 function is autonomous to the haemogenic endothelium, we delivered a dominant-negative form of JunB protein (dnJUNB) specifically to the flk1+ endothelial cells, before the induction of runx1, to functionally inhibit all AP-1 activity. Although flk1:dnJUNB did not significantly reduce the expression of runx1 in DMSO-treated embryos, it suppressed the EET-induced increase of runx1 in the AGM (Fig. 3a–b). Combined with the gene expression data, these genetic analyses showed that 11,12-EET activates an AP-1/runx1 transcriptional cascade of cell fate specification autonomous to the haemogenic endothelium.
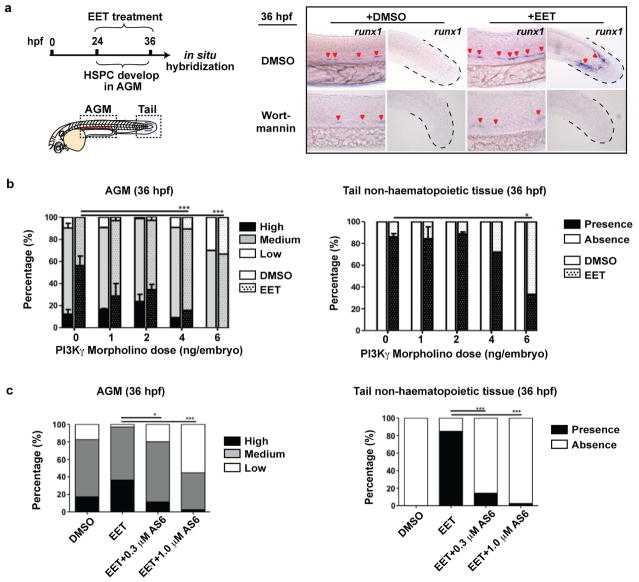
In an effort to define downstream signaling events for 11,12-EET, we performed a chemical suppressor screen in zebrafish embryos by examining the capability of various chemicals to suppress the 11,12-EET-induced AP-1/runx1 gene signature (Fig. 3c). Multiple PI3K inhibitors completely blocked the signature without detrimental effects to overall embryonic development (Fig. 3d–e, Extended Data Fig. 6a). To interrogate specific PI3K catalytic subunits, we assayed subunit-specific chemical inhibitors and morpholinos targeting individual Class I PI3K subunits. Among α-, β-, γ-, and δ-subunits of PI3K, only PI3Kγ loss of function specifically abrogated the runx1 induction in the AGM and tail non-haematopoietic tissue (Extended Data Fig. 6b–c). Additionally, 11,12-EET enhanced PI3K activity in immortalized human umbilical vein endothelial cells, assayed by Akt phosphorylation (data not shown). No such increase was seen in human umbilical cord blood CD34+ HSPCs, although EET-induced gene expression changes could be partially blocked in these cells by co-treatment with PI3K inhibitors. This indicates PI3K functions either directly downstream of 11,12-EET or as a parallel pathway, depending on the cellular context. In either case, PI3K activity is required for inducing the AP-1/runx1 transcription cascade in the AGM.
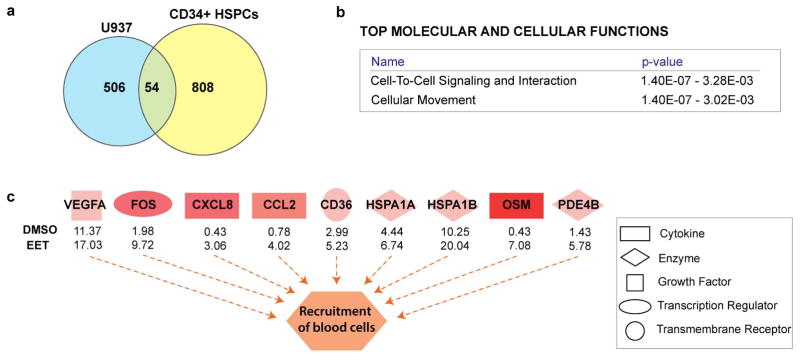
To understand how 11,12-EET treatment leads to increased engraftment in already specified HSPCs, we performed RNA-sequencing in human umbilical cord blood CD34+ HSPCs and a human myeloid cell line (U937), and utilized Ingenuity Pathway Analysis to decipher the biological pathways regulated by 11,12-EET in both cell types (Extended Data Fig. 7, Table S4). Cell-to-cell signaling and cellular movement networks topped the list of activated biological pathways, including the AP-1 members, which have been shown to modulate cell migration in many cell types20,21. AP-1 thus appears to be a common target of EET signaling, which leads to the induction of runx1 in the haemogenic endothelium (Fig. 3), and likely supports cell migration and cell-cell signaling of already-specified haematopoietic cells. In contrast, RUNX1 is not upregulated in already-specified HSPCs, which is consistent with previous studies showing that Runx1 is dispensable for HSPCs to engraft later haematopoeitic sites22. Several cytokines, such as CXCL8, OSM and CCL2, were also upregulated and involved in the cell migration network. These data show that besides promoting HSPC specification from the haemogenic endothelium, 11,12-EET can also directly induce gene expression programs beneficial for engraftment in already-specified HSPCs. Similarly, 11,12-EET treatment of zebrafish embryos after 48 hpf, when AGM HSPC production has already completed, leads to increased HSPCs in the CHT in a PI3Kγ-dependent manner, without affecting cell apoptosis or proliferation (Extended Data Fig. 8). Our data strongly suggest that 11,12-EET modulates cell migration and cell-cell interaction during HSPC engraftment.
To test the evolutionary conservation of EET-induced haematopoietic phenotypes, we examined the effect of 11,12-EET on HSPC engraftment in mammalian bone marrow competitive transplantation. Consistently, 11,12-EET promoted greater short-term chimerism by 4 weeks post transplant (wpt) compared to control-treated cells (Fig. 4a–b). Even up to 24 weeks, EET-treated marrow maintained greater multi-lineage contribution (Fig. 4c). Enhanced short- and long-term engraftment suggests that 11,12-EET may impact both stem and progenitor cells, perhaps by establishing a competitive advantage at the early stage of engraftment. In a WBM homing assay, we found 11,12-EET promoted the initial seeding of progenitor cells in the bone marrow (Fig. 4d–e). The early effect could be due to an enhanced cell migration and cell-cell signaling program, since assaying cell proliferation or apoptosis in whole marrow immediately after 11,12-EET treatment did not show significant changes (Extended Data Fig. 9). However, this does not exclude the possibility of a later onset of anti-apoptotic effects upon transplantation. Finally we found transient inhibition of PI3K partially blocked EET-induced enhancement of long-term, multi-lineage engraftment following mouse bone marrow transplant (Fig. 4f). Thus, the EET effect on enhancing HSPC engraftment is evolutionarily conserved in fish and mammals.
Figure 4. 11,12-EET enhances HSPC engraftment and homing in mammals.
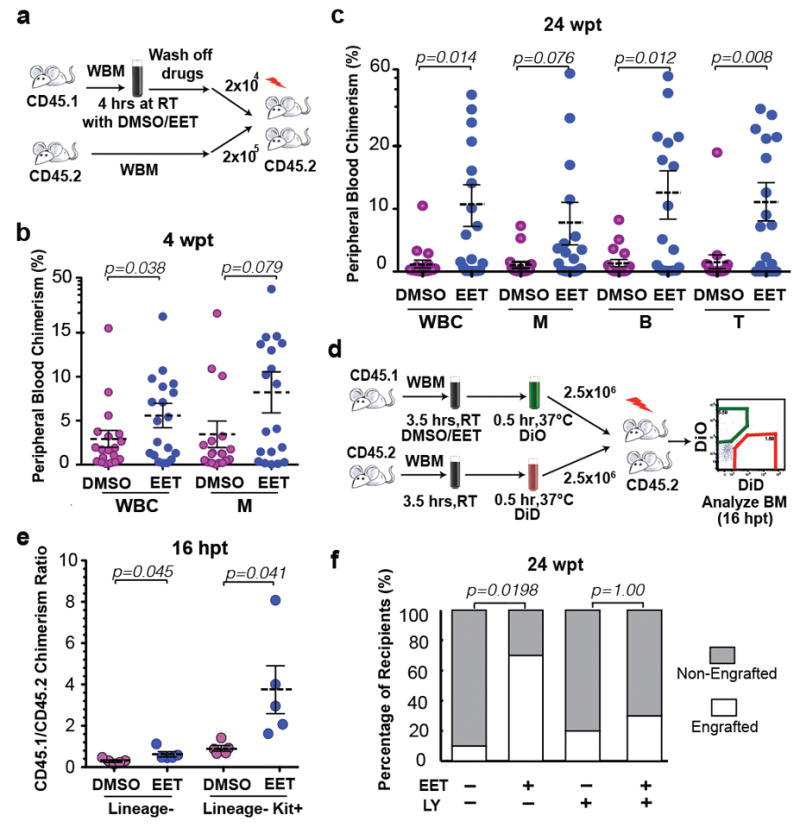
a, Schematic of mouse WBM (whole-bone marrow) competitive transplantation. RT, room temperature. b–c, 4 hrs of 11,12-EET treatment promoted short-term WBM engraftment at 4 wpt (b) and long-term multilineage engraftment at 24 wpt (c). WBC, white blood cells; M, myeloid cells; B, B cells; T, T cells. 2 independent experiments combined, n=20 total. d, Schematic of WBM competitive homing assay. hpt, hours post transplant. e, 11,12-EET increased homing efficiency of Lin- cells and Lin-Kit+ HSPCs (n=5). f, PI3K activation is required for EET-enhanced mouse WBM engraftment (n=10). LY, 10 μM LY294002. Recipients characterized as engrafted or non-engrafted based on peripheral blood WBC chimerism, two-tailed Fisher’s Exact test (b,f); unpaired two-tailed t-test (c,e), mean with s.e.m..
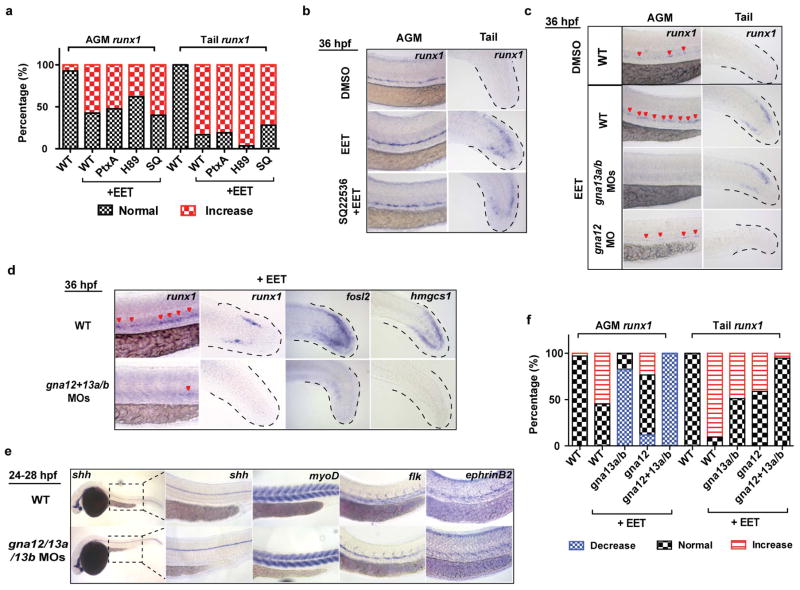
Our unbiased chemical genetic studies elucidate a new eicosanoid pathway for haematopoiesis, which increases HSPC specification in the AGM by inducing AP-1/runx1, and also enhances HSPC engraftment by modulating several biological pathways, such as migration and cell-cell signaling. Previous work in our lab discovered a different eicosanoid, PGE2, could also enhance marrow engraftment8,9. Both PGE2 and EETs are arachidonic acid-derived eicosanoids that are locally produced near wounds, and may facilitate progenitor recruitment, engraftment, and proliferation. Despite their common origin, the underlying molecular signaling mechanisms and activities of PGE2 and EETs are different (Table S5). Although the direct receptor for EETs is unknown, several studies have provided biochemical evidence that EETs bind to a G-protein coupled receptor (GPCR)23,24. GPCRs signal through various Gα subunits25. Previously we showed that PGE2 signals through the cAMP-dependent Gαs-coupled PGE2 receptor for its pro-haematopoietic effects7. Using chemical inhibition and genetic loss-of-function approaches, we screened all families of zebrafish Gα subunits. Interestingly, we found that gna12/13 are specifically required for EET-induced AP-1 and runx1 expression (Extended Data Fig. 10). Inhibiting Gαs did not suppress the EET phenotypes, indicating EETs and PGE2 have different signaling mechanisms.
During marrow transplantation, the achieved chimerism over time is critical, and the time to adequate neutrophil engraftment is an important milestone for treatment success. In addition to improving long-term repopulation, EETs seem to have a prominent effect on progenitor engraftment, as shown by increased chimerism early after transplantation. Our studies highlight the importance of lipid mediators in regulating HSPC engraftment, and the manipulation of these pathways could have clinical impact for patients undergoing transplantation.
METHODS
Zebrafish strains
Zebrafish were maintained in accordance with Animal Research Guidelines at Boston Children’s Hospital (BCH). The following transgenic zebrafish were used in this study: Tg(β-actin:GFP)4, casper6, Tg(flk1:DsRed2)26, Tg(CD41:GFP)27, Tg(Runx1+23:mCherry)19 and Tg(Runx1+23:GFP)19. The +23 enhancer region of mouse Runx1 was used to drive HSPC-specific expression28. Tg(flk1:dnJUNB-2A-GFP) was constructed by cloning a human JUNBΔN into a tol2 transgenesis vector29.
Chemical treatment
The ICCB Known Bioactive Library was purchased from BIOMOL (Enzo Life Sciences) and used for the adult zebrafish transplantation-based chemical screen. Chemicals were diluted at a 1:200 ratio. Chemicals used for the secondary round of screening for confirmation were from a different aliquot of the library, independent of the primary screen plate. 11,12-EET (Cayman Chemical, Cat. 50511) was resuspended in DMSO with original organic solvent evaporated. AS605240 (Sigma-Aldrich Cat. A0233) was resuspended in DMSO. The following chemicals were used for zebrafish marrow treatment: dmPGE2 (Cayman, Cat. 14750), 10 μM; BIO (EMD), 0.5 μM. 0.5 μM 11,12-EET and 14,15-EET were used for zebrafish WKM treatment (Fig. 1e); 2 μM 11,12-EET for all mouse WBM treatment (Fig. 4); 5 μM 11,12-EET for all zebrafish embryo treatment (Fig. 2, 3). The concentrations were chosen based on dose titration pilot experiments with doses spanning 0.1–50 μM. For the chemical suppressor screen, the suppressors were added 30 min prior to 11,12-EET. Zebrafish embryos were incubated with inhibitors at three different concentrations. The highest effective concentrations tested without causing general toxicity are listed in Supplementary Table S1.
Adult zebrafish kidney marrow transplantation and chemical screen
Adult zebrafish transplantation-based chemical screen was done at the hESC core at BCH. 3-month old casper recipients (both male and female) received split-dose irradiation of 15 Gy each two days and one day prior to transplantation. Adult zebrafish kidney marrow cells from multiple donors were dissected, pooled together, processed into single-cell suspension and injected retro-orbitally as described previously30. Tg(β-actin:GFP) WKM cells were incubated with DMSO control or chemicals in 0.9xDPBS plus 5% heat-inactivated FBS for 4 hrs at room temperature, at a density of 1000 cells/μl. Chemicals were washed off before 20,000 treated Tg(β-actin:GFP) WKM and 80,000 untreated RedGlo® WKM were mixed together and co-injected into irradiated capser recipients. The number of recipients per treatment condition in the chemical screen (n=10) was estimated based on preliminary experiments comparing the WKM treated with DMSO or the positive control chemical, dmPGE2. In each experiment, recipients were randomly assigned to each treatment group. All primary hits were cherry-picked and tested in a secondary round of screening (n=10 each). Recipients that died before 4 wpt, mostly due to infection, were excluded from the analysis. No statistically significant association was observed between recipients’ survival rate and a particular drug treatment.
Adult zebrafish fluorescence imaging and quantification
All zebrafish WKM transplantation results shown were obtained at 4 wpt (weeks post transplant). Transplanted adult casper recipients were anesthetized with 0.2% Tricaine and imaged using a Zeiss Discovery V8 fluorescence stereomicroscope with GFP/RFP filters. To quantify the relative engraftment level in adult zebrafish, the kidney region was manually annotated for each fish, and the average fluorescence intensity of GFP and DsRed2 within the same region was measured (Gkid and Rkid) using ImageJ. The average background fluorescence intensity (Gbkg and Rbkg) was measured in a region outside the fish and a mean from multiple images within an experiment was used for all the background subtraction. The relative engraftment level was calculated as G/R= (Gkid - Gbkg) / (Rkid - Rbkg). The investigator analyzing the data was blind to the chemical treatment conditions. For the chemical treatment and screen results (Fig. 1e), the mean G/R in the DMSO group was normalized to 1, and all other groups were normalized to the mean G/R of DMSO. Normalized results from 2–3 independent experiments were pooled for the same chemical.
Zebrafish embryo live imaging
For live imaging, zebrafish embryos were embedded in agarose as described before15, 19. Single-frame image or time-lapse movies were taken on a spinning disk confocal microscope with an incubation chamber. Images of HSPC birth in the AGM were taken every 10 minutes. Images of the CHT engraftment process were taken every 2 minutes. Image post-processing and the creation of the supplementary videos were done with Fluorender, ImageJ, and Imaris.
Zebrafish embryo whole-mount in situ hybridization, anti-sense morpholino knockdown, and mRNA overexpression
Whole-mount mRNA in situ hybridization experiments were performed based on the standard protocol with some modifications (http://zfin.org/zf_info/zfbook/chapt9/9.8.html). Embryos were scored blindly. All of the morpholinos were initially tested at 2, 4, and 6 ng to decide the effective dosage. If the morpholino did not produce a phenotype at 6 ng, additional higher doses were tested (8 ng, 12 ng), until the morpholino caused toxicity. See Supplementary Table S2 for morpholino sequences. PtxA (Pertussis toxin A, Gαi inhibitor) mRNA (Addgene, Plasmid 16678)31 was in vitro transcribed with SP6 RNA polymerase (Ambion, mMESSAGE mMACHINE SP6, AM1340) and injected into 1-cell stage zebrafish embryos at 3 pg / embryo, causing morphological defects but no general toxicity.
Zebrafish embryo proliferation and apoptosis assays
Zebrafish embryos were chemically treated between 48–72 hpf and fixed at 72 hpf. For proliferation analysis, embryos were permeablized and stained with primary antibody against phospho-Histone H3, and FITC-conjugated secondary antibody. Embryos were imaged and phospho-H3 positive cells in the CHT were manually counted. Secondary antibody-only control showed no non-specific staining. For apoptosis analysis, embryos were stained using the colorimetric TUNEL staining kit (Promega).
Cell culture
Human CD34+ cells were isolated from fresh umbilical cord blood by Ficoll separation of mononuclear cells and subsequent positive selection of CD34+ cells using magnetic beads (Miltenyi). Cells were treated in serum-free IMDM media (Sigma-Aldrich) with either DMSO or 5 μM 11,12-EET for 2 hrs at 37°C. U937 cells32 were cultured in RPMI-1640 Medium (Sigma-Aldrich) and 10% FBS at 5% CO2 in air atmosphere according to the protocol (ATCC). For in vitro treatment, cells were serum-starved for one hour and then treated with either DMSO or 5 μM 11,12-EET for 2 hrs at 37°C. The conditions for use of human umbilical cord blood CD34+ cells are governed by the associated institution’s Internal Review Board (IRB) on behalf of the DF/HCC in accordance with Department of Health and Human Services regulations at 45 CFR Part 46. Informed consent was obtained from all subjects.
Mouse bone marrow transplant
All mice were maintained according to IACUC approved protocols in accordance with BCH animal research guidelines. 9-week-old CD45.1 and CD45.2 (C57/BL6) male mice were purchased from Jackson Laboratories and housed for 2–3 weeks before the experiments. All CD45.2 recipients received an 11 Gy split dose of γ-irradiation prior to transplantation, and were randomly assigned to each treatment group. 20,000 CD45.1 WBM cells from age- and gender- matched BL6 donors were treated in DMEM + 2% FBS at room temperature for 4 hrs with 2 μM 11,12-EET. For the suppressor experiment (Fig. 4f), 10 μM LY294002 was added to the cells a half-hour prior to the addition of 11,12-EET. Chemicals were washed off before cells were resuspended in 1x PBS and mixed with 200,000 fresh CD45.2 mouse WBM cells. Donor cells were retro-orbitally injected into CD45.2 recipients. Each treatment condition included 10 recipients per experiment. The 12-week survival rate in each experiment was 90–95%, and recipients that died before 12 wpt were excluded from the analysis.
Mouse peripheral blood chimerism analysis
Peripheral blood was stained with lineage-specific antibodies and analyzed on LSRII (BD Biosciences) to assess engraftment. The following antibodies were used: Gr1 (RB6-8C5), Mac1 (M1/70), B220 (RA3-B2), CD3 (145-2C11), and Ter119 from eBioscience; CD45.1 and CD45.2 from BD Biosciences. The CD45.1 chimerisms in non-irradiated, untransplanted CD45.2 mice were used as a negative staining control. Recipients with multi-lineage chimerism above the average negative-control chimerism plus 3 standard deviations were considered to have multi-lineage engraftment (Fig. 4f).
Mouse competitive homing assay
The mouse competitive homing experiment was performed as described, with modifications33. In brief, CD45.1 mouse WBM were treated with either DMSO or 2 μM 11,12-EET at room temperature for 3.5 hrs at a density of 2×10⁶ cells/ml. DiO dye was added to the cell suspension (1:200) and incubated at 37°C for 30 min. At the same time, WBM from CD45.2 mice were incubated at RT for 3.5 hrs without chemical treatment, then labeled with DiD dye (1:200) at 37°C for 30 min. After the incubation and labeling, the chemicals and dyes were washed off. The DiO-labeled CD45.1 bone marrow and DiD-labeled CD45.2 WBM were mixed at a 1:1 ratio and competitively transplanted into CD45.2 recipients (2.5×10⁶ from each donor). Recipients received total body irradiation of 11 Gy one day before transplantation. 16 hours after transplant, the recipients were sacrificed and bone marrow was analyzed by flow cytometry for both DiO/DiD and surface lineage markers (Gr1, Mac1, B220, CD3, Ter119, from Ebioscience) and c-Kit (2B8, BD Biosciences). The ratio between the percentages of DiO+ (Donor) and DiD+ (Competitor) cells within different cell populations was quantified. DiO and DiD are from VybrantTM Multicolor Cell-Labeling Kit (Molecular Probes, V-22889).
Mouse bone marrow apoptosis and proliferation assays
For apoptosis analysis, mouse WBM cells were treated with DMSO or 2 μM 11,12-EET for 4 hrs in vitro and stained using the AnnexinV apoptosis kit (BD Biosciences), together with antibodies against lineage markers, Sca-1 (E13-161.7) and c-Kit (2B8). The 7-AAD-/AnnexinV+ cells are the apoptotic population. For proliferation analysis, mouse WBM were treated with DMSO or 2 μM 11,12-EET for 4 hrs in vitro, in the presence of 10 μM BrdU, then fixed, permeabilized and stained with anti-BrdU antibody (BD Pharmingen BrdU Flow Kits)34, together with antibodies against lineage markers, Sca-1 and c-Kit.
Gene expression profiling and IPA analysis
Gene expression profiling data have been deposited with GEO (Accession No. GSE39707, GSE66767). For the zebrafish embryo gene expression study, total RNA was extracted from 36 hpf zebrafish embryos treated with DMSO or 5 μM 11,12-EET between 24–36 hpf, with 3 biological replicates each and n=25 in each group. Microarray hybridization was performed with the Affymetrix GeneChip Zebrafish Genome Array. Hybridized microarray was background-corrected, normalized and multiple-tested using Goldenspike (http://www2.ccr.buffalo.edu/halfon/spike/) in R/Bioconductor35. Genes with q<0.1 by SNR test were considered differentially expressed (Supplementary Table S3). For RNAseq analysis on human cells, total RNA was extracted from treated CD34+ and U937 cells with the RNeasy mini plus kit from Qiagen. After quality control on the Bioanalyzer (Agilent), total RNA was depleted of ribosomal RNA with the RiboZero gold kit (Epicentre). Enriched mRNA was applied to library preparation according to manufacturer’s protocol (NEBNext Ultra). After repeated quality control for average DNA input size of 300 bp, samples were sequenced on a HiSeq Illumina sequencer with 2×100 bp paired-end reads. Quality control of RNA-Seq datasets was performed by FastQC (http://www.bioinformatics.babraham.ac.uk/projects/fastqc/) and Cutadapt36 to remove adaptor sequences and low quality regions. The high-quality reads were aligned to UCSC build hg19 of the human genome using Tophat 2.0.11 without novel splicing form calls37. Transcript abundance and differential expression were calculated with Cufflinks 2.2.138. FPKM values were used to normalize and quantify each transcript. Log2fc (log2 fold change), p- and q- values were calculated. As the experiment was not performed in biological replicates, the p- and q- values were not taken into consideration for further analysis of the data. Results are listed with a cutoff of log2fc>0.5 for upregulated genes and log2fc<-0.5 for downregulated genes in Supplementary Table S4. Analysis of overlapping up-regulated genes in both cell types after EET treatment was done using Venny (http://bioinfogp.cnb.csic.es/tools/venny/index.html). The list of overlapping genes was analyzed using Ingenuity® Pathway Analysis (IPA®, QIAGEN) to map enriched bio-functions.
Statistics
The comparison of multi-lineage engraftment in Fig. 4d and 4f were done by two-tailed Fisher’s Exact Test by comparing the number of engrafted vs non-engrafted recipients. Using the mean chimerism plus 2 × s.e.m. (standard error of mean) in the DMSO control group as the cutoff, recipients with a chimerism higher than the cutoff were considered engrafted (Fig. 4d). Embryos in the in situ hybridization experiments were scored blindly and analyzed by Chi-square tests or two-tailed Fisher’s Exact Test in the case of small sample sizes. The rest of the statistics were done with unpaired two-tailed t-test. Graphs show mean with s.e.m..
Extended Data
Extended Data Figure 1. Zebrafish whole kidney marrow (WKM) competitive transplantation-based chemical screen identifies EETs as enhancers of marrow engraftment.
a, WKM from Tg(β-actin:GFP) donors were dissected, dissociated as single cell suspension, and incubated with chemicals at room temperature for 4 hrs in a round-bottom 96-well plate. Meanwhile, WKM were dissected from RedGlo® zebrafish, counted and kept on ice. After the drug treatment, chemicals were washed off and cells were resuspended in 0.9 X DPBS + 5% FBS. 20,000 treated green WKM and 80,000 untreated red WKM were co-injected retro-orbitally into sublethally irradiated capser zebrafish (n=10 per chemical). For every independent screening day, negative control (DMSO) and positive control (10 μM dmPGE2) were used for normalization and quality assurance. The engraftment was measured at 4 wpt (weeks post transplant) by fluorescence imaging and ImageJ quantification as described in Fig. 1b. b, EET metabolic pathway: arachidonic acid is released by PLA2 (phospholipase A2) from the membrane lipid bilayer. EETs (epoxyeicosatrienoic acids) are synthesized directly from arachidonic acid by the cytochrome P450 family of epoxygenases, especially 2C and 2J in human39, and get degraded by soluble epoxide hydrolase (sEH), generating DiHET (dihydroxyeicosatrienoic acids). Four isomers of EET exist in vivo: 5,6-, 8,9-, 11,12- and 14,15-EET.
Extended Data Figure 2. 11,12-EET enhances HSPC specification in the AGM in zebrafish embryos.
Tg(CD41:GFP/flk1:NRAS-mCherry) embryos were treated with DMSO or 5 μM 11,12-EET starting at 24 hpf (hours post fertilization), then mounted for spinning disc confocal timelapse imaging from 30–46 hpf in the presence of the chemicals. Bars show mean and s.e.m., unpaired two-tailed t-tests, n=10 for DMSO, n=7 for EET. a, More HSPCs are directly specified in EET-treated AGM. Graph shows HSPCs born by direct specification/budding only, excluding cells born by division of an already-budding cell. b–c, 11,12-EET does not influence the rate of HSPC division in the AGM, shown by per movie, percentage of budding HSPCs that divide at least once (b) and divide twice or more (c) before leaving the AGM or before the end of timelapse recording. n.s., not statistically significant.
Extended Data Figure 3. 11,12-EET treatment between 24–48 hpf increases the number of HSPCs in the CHT.
a, Embryos were treated between 24–48 hpf with either DMSO or 5 μM 11,12-EET. Chemicals were washed off at 48 hpf, and embryos grew in drug-free environment for another 24 hrs. b, 11,12-EET treatment increased the number of mCherry+ HSPCs in the CHT in Tg(Runx1+23:mCherry) embryos (see also Fig. 2e). Representative images of the CHT from the two groups. c, The same chemical treatment increased the staining of cmyb, a HSPC marker, by whole-mount RNA in situ hybridization. Representative images from each group (a total of n>60 from 3 independent experiments).
Extended Data Figure 4. EET signaling pathway activates AP-1 family members as primary transcriptional targets, and runx1 as secondary transcriptional target.
a, Wild-type embryos were incubated with 300 μM cycloheximide, a translation blocker, for 30 min before the addition of 5 μM 11,12-EET at 24 hpf. Embryos were fixed for in situ hybridization at 25 hpf or 28 hpf. b. AP-1 transcription was induced upon 1 hr treatment with 11,12-EET, insensitive to cycloheximide inhibition. This means AP-1 induction does not depend on de novo protein synthesis, indicating AP-1 members are primary transcriptional targets of the EET signaling pathway. c. runx1 transcription was induced upon 4 hr treatment with EET (left two columns) and cycloheximide completely blocked EET-induced runx1 expression (right two columns). This suggests runx1 transcription depends on de novo protein synthesis of an upstream factor(s) upon EET stimulation, indicating that runx1 is a secondary transcriptional target of the EET signaling pathway. Representative images from each group (a total of n>30 from 2 independent experiments).
Extended Data Figure 5. Knocking down junb/junbl inhibits HSPC specification in the AGM.
a, Wild-type (WT) embryos were injected with antisense morpholinos at 1-cell stage, and treated with DMSO or 5 μM 11,12-EET starting from 24 hpf. Embryos were fixed at 36 hpf for in situ hybridization of runx1. b, Knocking down junb completely blocked runx1 expression at 36 hpf both in the AGM and the tail non-haematopoietic tissue (middle row). In contrast, knocking down c-jun did not block the increase of runx1 (bottom row), consistent with the lack of c-jun upregulation in EET-treated embryos (data not shown). c, junb morphants still developed normal vascular structure in the AGM at 28 hpf, as shown by endothelial marker flk1 (c). Representative images from each group (a total of n>40 from 3 independent experiments).
Extended Data Figure 6. PI3Kγ activation is specifically required for EET-induced gene expression signature.
a, Similar to LY294002 (Fig. 3e), another pan-PI3K/AKT inhibitor, wortmannin (1 μM) blocked EET-induced runx1 expression both in the AGM and tail. Representative images from each group (a total of n>60 from 3 independent experiments). b, Morpholinos specific to PI3Kγ, but not α, β, and δ subunits (data not shown), prevented EET-induced runx1 in the AGM and tail. Embryos injected at 1–2 cell stage with indicated amount of morpholino and treated with DMSO or 5 μM 11,12-EET from 24–36 hpf. In situ hybridization for runx1 performed at 36 hpf and percentages of embryos having high, medium, or low expression in the AGM and present or absent expression in the tail are shown. Graph summarizes 3 experiments, n≥10 embryos for each condition (0, 1, and 2 ng, bars show mean and s.e.m.) or one experiment n≥9 for all conditions (4 and 6 ng). c, The PI3Kγ specific inhibitor AS605240 (AS6) recapitulates the morpholino phenotype. Embryos treated from 24–36 hpf with DMSO or 5 μM 11,12-EET, with or without 0.3–1.0 μM AS6, then fixed and stained for runx1 at 36 hpf. DMSO, n=23; EET, n=33; EET+0.3 μM AS6, n=35; EET+1.0 μM AS6, n= 38. * p<0.05, *** p<0.001, two-tailed Fisher’s Exact Test.
Extended Data Figure 7. 11,12-EET up-regulates genes involved in cell-to-cell signaling and cellular movement in haematopoietic progenitors.
a, Venn diagram showing a common set of 54 genes up-regulated (log2fc>0.5) after 2 hrs of 11,12-EET treatment (5 μM), both in human myeloid U937 cells and human umbilical cord CD34+ HSPCs (see also Supplementary Table S4 for lists of up- and down-regulated genes). b–c, Ingenuity Pathway Analysis (IPA) of the overlapping gene set between the two cell types for enrichment of bio-functions. b, Biological processes, such as cell-to-cell signaling and cellular movement, were highly enriched, supporting EETs’ capability of enhancing engraftment (see also Supplementary Table S4 for a comprehensive list of all biological functions predicted to be activated or suppressed based on the same gene set). c, Activation of recruitment of blood cells is caused by up-regulation of chemokines and cytokines such as CXCL8 and OSM after EET treatment, as well as by up-regulation of transcription factors, such as AP-1 genes (FOS). Orange dashed arrows depict activation. Shades of red represent the level of activation. Numbers underneath factors show RNAseq FPKM values in U937 cells.
Extended Data Figure 8. 11,12-EET treatment after HSPC specification still enhances the number of HSPCs in the CHT.
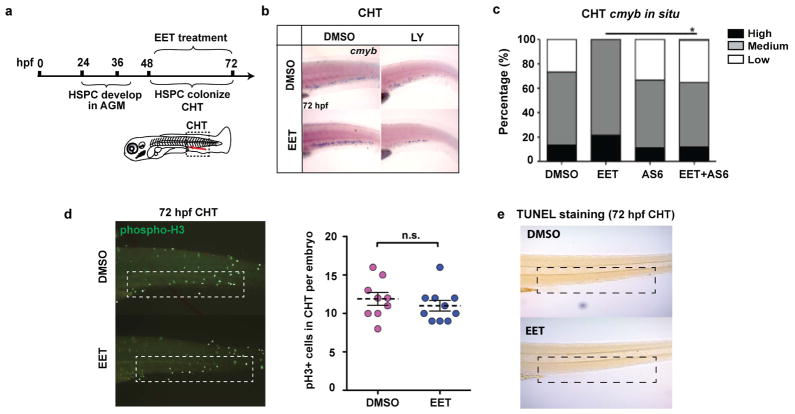
a, Embryos were treated with DMSO or 5 μM 11,12-EET between 48–72 hpf to bypass the HSPC specification process in the AGM. 72 hpf embryos were fixed and tested on the following assays. b, In situ hybridization for cmyb, a marker for HSPCs. EET treatment significantly increased the staining, while LY294002, a pan-PI3K inhibitor, suppressed the effect. Representative images from each group (a total of n>60 from 4 independent experiments). c, A PI3Kγ-specific inhibitor AS605240 (AS6) also blocked the EET-induced increase of cmyb staining. Percentage of embryos having high, medium, or low expression in the CHT is shown. n≥11 for all conditions. Chi-square analysis. d, The increase of HSPCs in the CHT is not due to effects on proliferation. Immunofluorescence staining for phospho-Histone H3 (pH3) as a marker for proliferating cells. The number of pH3 positive cells was manually counted. Two-tailed t-test showed no significant difference between DMSO vs EET treated embryos. n=9 for DMSO, n=10 for EET. e, TUNEL staining as an assay for apoptotic cells. Apoptosis was minimal in the CHT at 72 hpf. As a staining control, obvious apoptosis was detected in the same embryos in the brain region, and was comparable between DMSO and EET treated embryos (data not shown).
Extended Data Figure 9. 11,12-EET treatment of mouse whole bone marrow (WBM) does not lead to immediate changes in cell proliferation or apoptosis.
a, in vitro apoptosis assay on WBM treated with DMSO or 2 μM 11,12-EET for 4 hrs. The 7-AAD negative and AnnexinV positive population are the cells undergoing apoptosis. No significant differences between the two groups were observed either in Lin-Sca-Kit+ or Lin-Sca+Kit+ progenitor populations (n=4 each), mean with s.e.m.. b–c, in vitro proliferation assay on WBM treated with DMSO or 2 μM 11,12-EET for 4 hrs, in the presence of 10 μM BrdU. No significant differences between the two groups were observed either in Lin-Sca-Kit+ (b) or Lin-Sca+Kit+ populations (c) for any cell-cycle stage. Unpaired two-tailed t-test, n=4 each, bar showing mean. D, DMSO; E, EET; n.s., not significant.
Extended Data Figure 10. Gα12/13 is specifically required for EET-induced phenotypes in zebrafish embryos.
All embryos were treated with DMSO or 5 μM 11,12-EET between 24–36 hpf. Chemical inhibitors were added 30 min before EET. mRNA or morpholinos (MO) were injected at 1-cell stage. a–b, Inhibiting Gαs or Gαi had no effect on EET-induced runx1 expression. Embryos were categorized into two groups with either normal or increased runx1 expression level (n>20 each). PtxA, pertussis toxin A, 3 pg, inhibiting Gαi31; H89, 5 μM, PKA inhibitor downstream of Gαs9; SQ, SQ22536, 50 μM, adenylate cyclase inhibitor downstream of Gαs9. Representative images from each group (b) (a total of n>40 from 2 independent experiments). c–e, Synergistic effects of gna12/13a/13b knockdown on suppressing runx1 expression. Knocking down gna13a/b or gna12 alone partially inhibited EET-induced runx1 expression in the AGM and tail (c). gna12 MO: 2 ng; gna13a/13b MOs: 1 ng each. Triple morpholinos against gna12, gna13a and gna13b (0.67 ng each) completely blocked EET-induced multiple gene expression, including runx1, genes in regeneration (fosl2) and cholesterol metabolism (hmgcs1) (d), while other major tissue development processes were not significantly affected, such as notochord (shh), muscle (myoD), and blood vessels (flk, ephrinB2) (e). The results were quantified in (f). Embryos were categorized as having decreased, normal or increased runx1 expression. The bar graph represents the percentage of embryos in each group (n>30).
Supplementary Material
Acknowledgments
We thank C. R. Lee, M. L. Edin, and N. Gray for providing reagents; Y. Zhou, A. Dibiase, S. Yang, S. Datta, P. Manos, R. Mathieu, and M. Ammerman for technical assistance; H. Huang for providing graphic illustration; R. M. White, T. E. North and C. Mosimann for discussion. Microarray studies were performed by the Molecular Genetics Core Facility at Boston Children’s Hospital, supported by NIH-P50-NS40828 and NIH-P30-HD18655. S. Li in Y. Zhang’s lab at the Longwood HHMI joint core facility helped with RNA-seq.
This work was supported by HHMI and NIH grants R01 HL04880, P015PO1HL32262-32, 5P30 DK49216, 5R01 DK53298, 5U01 HL10001-05, R24 DK092760, and 1R01HL097794-04 (to L.I.Z.). This work was also funded, in part, by the Intramural Research Program of the NIH, National Institute of Environmental Health Sciences (Z01 ES025034 to D.C.Z.), the National Cancer Institute grant ROCA148633-01A5 (D.P.), and DFG and Care-for-Rare Foundation (V.B.). L.I.Z. is a founder and stockholder of Fate, Inc. and a scientific advisor for Stemgent. G.Q.D. is a member of the Scientific Advisory Boards of MPM Capital, Inc., Epizyme, Inc., and iPierian, Inc.
Footnotes
Author Contributions: P.L. and L.I.Z. designed the study, analyzed data and wrote the manuscript, with help from J.L.L. and V.B.. P.L. developed the zebrafish competitive transplantation and performed the chemical screen with technical help from E.K.P.. P.L. performed the mouse experiments with technical help from T.V.B., S.M. and G.C.H.. P.L. performed the zebrafish microarray and embryo chemical/genetic suppressor screens with technical help from E.B.R.. J.L.L. performed zebrafish embryo genetic studies and AGM timelapse imaging. V.B. performed RNA-seq and analysis on human cells with technical help from F.G.B.. O.J.T. performed CHT time-lapse imaging. T.M.S. provided the chemical library. D.P. and D.C.Z. offered reagents and information related to the EET study. All authors discussed the results and commented on the manuscript.
References
- 1.Spector AA, Kim H-YY. Cytochrome P450 epoxygenase pathway of polyunsaturated fatty acid metabolism. Biochimica et biophysica acta. 2014 doi: 10.1016/j.bbalip.2014.07.020. [DOI] [PMC free article] [PubMed] [Google Scholar]
- 2.Node K, et al. Anti-inflammatory properties of cytochrome P450 epoxygenase-derived eicosanoids. Science (New York, NY) 1999;285:1276–1279. doi: 10.1126/science.285.5431.1276. [DOI] [PMC free article] [PubMed] [Google Scholar]
- 3.Traver D, et al. Effects of lethal irradiation in zebrafish and rescue by hematopoietic cell transplantation. Blood. 2004;104:1298–1305. doi: 10.1182/blood-2004-01-0100. [DOI] [PubMed] [Google Scholar]
- 4.Traver D, et al. Transplantation and in vivo imaging of multilineage engraftment in zebrafish bloodless mutants. Nat Immunol. 2003;4:1238–1246. doi: 10.1038/ni1007. [DOI] [PubMed] [Google Scholar]
- 5.Stachura DL, et al. Clonal analysis of hematopoietic progenitor cells in the zebrafish. Blood. 2011;118:1274–1282. doi: 10.1182/blood-2011-01-331199. [DOI] [PMC free article] [PubMed] [Google Scholar]
- 6.White RM, et al. Transparent adult zebrafish as a tool for in vivo transplantation analysis. Cell Stem Cell. 2008;2:183–189. doi: 10.1016/j.stem.2007.11.002. [DOI] [PMC free article] [PubMed] [Google Scholar]
- 7.Blake A, Crockett R, Essner J, Hackett P, Nasevicius A. Recombinant constructs and transgenic fluorescent ornamental fish therefrom. US7,700,825 B2. US patent. 2010
- 8.North TE, et al. Prostaglandin E2 regulates vertebrate haematopoietic stem cell homeostasis. Nature. 2007;447:1007–1011. doi: 10.1038/nature05883. [DOI] [PMC free article] [PubMed] [Google Scholar]
- 9.Goessling W, et al. Genetic interaction of PGE2 and Wnt signaling regulates developmental specification of stem cells and regeneration. Cell. 2009;136:1136–1147. doi: 10.1016/j.cell.2009.01.015. [DOI] [PMC free article] [PubMed] [Google Scholar]
- 10.Forsberg EC, et al. Molecular signatures of quiescent, mobilized and leukemia-initiating hematopoietic stem cells. PLoS One. 2010;5:e8785. doi: 10.1371/journal.pone.0008785. [DOI] [PMC free article] [PubMed] [Google Scholar]
- 11.Panigrahy D, Greene ER, Pozzi A, Wang DW, Zeldin DC. EET signaling in cancer. Cancer Metastasis Rev. 2011 doi: 10.1007/s10555-011-9315-y. [DOI] [PMC free article] [PubMed] [Google Scholar] [Retracted]
- 12.Pfister SL, Gauthier KM, Campbell WB. Vascular pharmacology of epoxyeicosatrienoic acids. Adv Pharmacol. 2010;60:27–59. doi: 10.1016/B978-0-12-385061-4.00002-7. [DOI] [PMC free article] [PubMed] [Google Scholar]
- 13.Wang Y, et al. Arachidonic acid epoxygenase metabolites stimulate endothelial cell growth and angiogenesis via mitogen-activated protein kinase and phosphatidylinositol 3-kinase/Akt signaling pathways. The Journal of pharmacology and experimental therapeutics. 2005;314:522–532. doi: 10.1124/jpet.105.083477. [DOI] [PubMed] [Google Scholar]
- 14.Lam EY, Hall CJ, Crosier PS, Crosier KE, Flores MV. Live imaging of Runx1 expression in the dorsal aorta tracks the emergence of blood progenitors from endothelial cells. Blood. 2010;116:909–914. doi: 10.1182/blood-2010-01-264382. [DOI] [PubMed] [Google Scholar]
- 15.Bertrand JY, et al. Haematopoietic stem cells derive directly from aortic endothelium during development. Nature. 2010;464:108–111. doi: 10.1038/nature08738. [DOI] [PMC free article] [PubMed] [Google Scholar]
- 16.Kissa K, Herbomel P. Blood stem cells emerge from aortic endothelium by a novel type of cell transition. Nature. 2010;464:112–115. doi: 10.1038/nature08761. [DOI] [PubMed] [Google Scholar]
- 17.Boisset JC, et al. In vivo imaging of haematopoietic cells emerging from the mouse aortic endothelium. Nature. 2010;464:116–120. doi: 10.1038/nature08764. [DOI] [PubMed] [Google Scholar]
- 18.Murayama E, et al. Tracing hematopoietic precursor migration to successive hematopoietic organs during zebrafish development. Immunity. 2006;25:963–975. doi: 10.1016/j.immuni.2006.10.015. [DOI] [PubMed] [Google Scholar]
- 19.Tamplin OJ, et al. Hematopoietic stem cell arrival triggers dynamic remodeling of the perivascular niche. Cell. 2015;160:241–252. doi: 10.1016/j.cell.2014.12.032. [DOI] [PMC free article] [PubMed] [Google Scholar]
- 20.Renaud SJ, Kubota K, Rumi MA, Soares MJ. The FOS transcription factor family differentially controls trophoblast migration and invasion. J Biol Chem. 2014;289:5025–5039. doi: 10.1074/jbc.M113.523746. [DOI] [PMC free article] [PubMed] [Google Scholar]
- 21.Gilan O, et al. PR55alpha-containing protein phosphatase 2A complexes promote cancer cell migration and invasion through regulation of AP-1 transcriptional activity. Oncogene. 2014;0 doi: 10.1038/onc.2014.26. [DOI] [PubMed] [Google Scholar]
- 22.Chen MJ, Yokomizo T, Zeigler BM, Dzierzak E, Speck NA. Runx1 is required for the endothelial to haematopoietic cell transition but not thereafter. Nature. 2009;457:887–891. doi: 10.1038/nature07619. [DOI] [PMC free article] [PubMed] [Google Scholar]
- 23.Chen Y, Falck JR, Manthati VL, Jat JL, Campbell WB. 20-Iodo-14,15-epoxyeicosa-8(Z)-enoyl-3-azidophenylsulfonamide: photoaffinity labeling of a 14,15-epoxyeicosatrienoic acid receptor. Biochemistry. 2011;50:3840–3848. doi: 10.1021/bi102070w. [DOI] [PMC free article] [PubMed] [Google Scholar]
- 24.Yang W, et al. Characterization of epoxyeicosatrienoic acid binding site in U937 membranes using a novel radiolabeled agonist, 20–125i-14,15-epoxyeicosa-8(Z)-enoic acid. J Pharmacol Exp Ther. 2008;324:1019–1027. doi: 10.1124/jpet.107.129577. [DOI] [PubMed] [Google Scholar]
- 25.Lappano R, Maggiolini M. G protein-coupled receptors: novel targets for drug discovery in cancer. Nat Rev Drug Discov. 2011;10:47–60. doi: 10.1038/nrd3320. [DOI] [PubMed] [Google Scholar]
- 26.Kikuchi K, et al. Retinoic acid production by endocardium and epicardium is an injury response essential for zebrafish heart regeneration. Dev Cell. 2011;20:397–404. doi: 10.1016/j.devcel.2011.01.010. [DOI] [PMC free article] [PubMed] [Google Scholar]
- 27.Ma D, Zhang J, Lin HF, Italiano J, Handin RI. The identification and characterization of zebrafish hematopoietic stem cells. Blood. 2011;118:289–297. doi: 10.1182/blood-2010-12-327403. [DOI] [PMC free article] [PubMed] [Google Scholar]
- 28.Bee T, et al. The mouse Runx1 +23 hematopoietic stem cell enhancer confers hematopoietic specificity to both Runx1 promoters. Blood. 2009;113:5121–5124. doi: 10.1182/blood-2008-12-193003. [DOI] [PubMed] [Google Scholar]
- 29.Ikebe D, Wang B, Suzuki H, Kato M. Suppression of keratinocyte stratification by a dominant negative JunB mutant without blocking cell proliferation. Genes to cells : devoted to molecular & cellular mechanisms. 2007;12:197–207. doi: 10.1111/j.1365-2443.2007.01043.x. [DOI] [PubMed] [Google Scholar]
- 30.Pugach EK, Li P, White R, Zon L. Retro-orbital injection in adult zebrafish. J Vis Exp. 2009 doi: 10.3791/1645. [DOI] [PMC free article] [PubMed] [Google Scholar]
- 31.Slusarski DC, Corces VG, Moon RT. Interaction of Wnt and a Frizzled homologue triggers G-protein-linked phosphatidylinositol signalling. Nature. 1997;390:410–413. doi: 10.1038/37138. [DOI] [PubMed] [Google Scholar]
- 32.Sundstrom C, Nilsson K. Establishment and characterization of a human histiocytic lymphoma cell line (U-937) International journal of cancer Journal international du cancer. 1976;17:565–577. doi: 10.1002/ijc.2910170504. [DOI] [PubMed] [Google Scholar]
- 33.Lam BS, Cunningham C, Adams GB. Pharmacologic modulation of the calcium-sensing receptor enhances hematopoietic stem cell lodgment in the adult bone marrow. Blood. 2011;117:1167–1175. doi: 10.1182/blood-2010-05-286294. [DOI] [PMC free article] [PubMed] [Google Scholar]
- 34.Challen GA, Boles N, Lin KK, Goodell MA. Mouse hematopoietic stem cell identification and analysis. Cytometry. Part A : the journal of the International Society for Analytical Cytology. 2009;75:14–24. doi: 10.1002/cyto.a.20674. [DOI] [PMC free article] [PubMed] [Google Scholar]
- 35.Choe SE, Boutros M, Michelson AM, Church GM, Halfon MS. Preferred analysis methods for Affymetrix GeneChips revealed by a wholly defined control dataset. Genome biology. 2005;6:R16. doi: 10.1186/gb-2005-6-2-r16. [DOI] [PMC free article] [PubMed] [Google Scholar]
- 36.Martin M. Cutadapt removes adapter sequences from high-throughput sequencing reads. EMBnet.journal. 2011;17 [Google Scholar]
- 37.Trapnell C, Pachter L, Salzberg SL. TopHat: discovering splice junctions with RNA-Seq. Bioinformatics. 2009;25:1105–1111. doi: 10.1093/bioinformatics/btp120. [DOI] [PMC free article] [PubMed] [Google Scholar]
- 38.Trapnell C, et al. Transcript assembly and quantification by RNA-Seq reveals unannotated transcripts and isoform switching during cell differentiation. Nature biotechnology. 2010;28:511–515. doi: 10.1038/nbt.1621. [DOI] [PMC free article] [PubMed] [Google Scholar]
- 39.Lee CR, et al. Endothelial expression of human cytochrome P450 epoxygenases lowers blood pressure and attenuates hypertension-induced renal injury in mice. Faseb J. 2010;24:3770–3781. doi: 10.1096/fj.10-160119. [DOI] [PMC free article] [PubMed] [Google Scholar]
Associated Data
This section collects any data citations, data availability statements, or supplementary materials included in this article.


