Abstract
Background:
Brickfield workers in India perform manual materials handling (MMH) and as a result, are at a high risk of developing oxidative stress. This results in an alteration of the various markers of metabolic oxidative stress at the cellular level. Since red blood cell (RBC) is the central point where oxygen, glucose-6-phosphate dehydrogenase (G-6-PD), and glutathione (GSH) are involved, the surface roughness and its alteration and modeling with respect to workers exposed to MMH may be considered as helpful determinants in predicting early damage to the cell and restoring better health to the exposed population, that is, the worker exposed to stress. Hence, nanometric analysis of the surface roughness of the RBC may serve as an early indicator of the stress-related damage in these individuals.
Aims:
The purpose of the study was to identify early red blood corpuscular surface damage profile in terms of linear modeling correlating various biochemical parameters. Linear modeling has been aimed to be developed in order to demonstrate how individual oxidative stress markers such as malondialdehyde (MDA), G-6-PD, and reduced GSH are related to the RBC surface roughness [root mean square (RMS)].
Materials and Methods:
Conventional analysis of these biochemical responses were evaluated in MMH laborers (age varying between 18 years and 21 years) and a comparable control group of the same age group (with sedentary lifestyles). Peak expiratory flow rate (PEFR) and RBC surface analysis by atomic-force microscopy (AFM) and correlated scanning probe microscopy (SPM-analytical software) with corresponding image analysis were performed immediately after completion of standardized exercise (MMH) at the brickfield.
Results:
A number of correlated significances and regressive linear models were developed among MDA, G-6-PD, GSH, and RBC surface roughness.
Conclusion:
It appears that these linear models might be instrumental in predicting early oxidative damages related to specific occupational hazards.
Keywords: Atomic-force microscopy (AFM), glutathione (GSH), glucose-6-phosphate dehydrogenase (G-6-PD), malondialdehyde (MDA), peak expiratory flow rate (PEFR), root mean square (RMS)
Introduction
Millions of people take time off work annually to treat and recover from work-related musculoskeletal pain or impairment in the lower back or upper extremities.[1] Manual handling and lifting are the major causes of work-related back pain.[2] However, back pain and in particular lower back pain are also common in other work environments such as seated work where there is no lifting or manual handling.[3] Work-related musculoskeletal disorders often lead to hidden pain sensation, which compels human error. Recent findings suggest[4] that human error is the primary cause of 60-90% major accidents. Factors such as poor discriminability, memory lapses, and communication breakdown lie behind human errors or even according to James Reason's Error Model, 1990[5] mistakes may be due to hidden health problems.
In humans, reactive oxygen species (ROS) and malondialdehyde (MDA) are globally accepted as markers of metabolic oxidative stress.[6] In contrast, glutathione (GSH) is considered as one of the important antioxidant enzymes and is a metabolic respondent of the oxidative stress.[7] Glucose-6-phosphate dehydrogenase (G6PD), a vital enzyme in all cells, catalyzes the first reaction of the pentose phosphate pathway allowing the conversion of glucose-6-phosphate to 6-phosphogluconolactone. In this reaction, nicotinamide adenine dinucleotide phosphate (NADP) is reduced to NADPH, which is also used in the protective process against physiologically high levels of oxidative damage.[8] In red blood cells (RBCs), G6PD reaction is the only source of NADPH, making them more vulnerable than other cells to the destruction due to oxidative stress.[9]
MMH and strenuous exercise are again alternately considered as stress situation and oxidative stress in particular, respectively. For example, Ghosh et al.[6] found that nanometrically assessed measure of corrugation in the erythrocyte surface morphology of stressed subjects is highly correlated with their corresponding metabolic feedback profile of stress (MDA).
The early risk factor, as appeared in the cell's metabolic alterations must first be identified.
Typically, brickfield workers in India perform MMH activities such as clay extraction, grinding, crushing, and water-mixing, molding, soft mud molding, and brick drying and firing (preheating, firing, and cooling) for approximately 10 h per day.
Since RBC is the central point where oxygen, G-6-PD, and GSH are involved, the surface roughness and its alteration and modeling with respect to workers exposed to vibration may be considered as helpful determinants in predicting early damage to the cell and restoring better health to the exposed population, that is, the workers exposed to stress.
Erythrocyte membrane surface corrugation, a nanometric vibration parameter, on the other hand can be quantitatively assessed as markers of work-related oxidative stress situation and these two events are planned to be simulated in this paper.
In this particular study, oxidative stress as a function of biochemical alterations, the RBC surface roughness and its dynamics are hypothesized to be a key clinical parameter in this regard.
The present work therefore, is an attempt to determine the early signatures of such biochemical metabolic stress responses, and to correlate the responses with the altered nanoscopic version of the erythrocyte topography of the exposed workers and the control group of brickworkers.
Peak expiratory flow rate (PEFR) is the maximum flow generated during expiration performed with maximal force and started after a full inspiration.
An abnormally low PEFR may be due to:
Obstructive lung disease.
Restricted lung expansion (stiff chest cage, muscular or neurogenic disorder, etc.).
Measurements of PEFR are of value in identifying airflow limitation. Of the pathological situations that impair PEFR, by far the most common is that of a disorder of the structure or function of the intrathoracic airways, which increases resistance to airflow within them. PEFR may also be impaired by: Obstruction in extrathoracic airways; conditions that limit chest expansion or which affect respiratory muscle function; and by the integrity of the neural system. In restrictive processes due to interstitial lung disease, the effect of a loss in lung volume on PEFR may be offset by increased lung elastic recoil. In subjects with severe airflow obstruction, PEFR may include air coming from the collapsing airway in addition to flow coming from the lungs.
Since all the subjects performing MMH are compulsorily exposed to severe dust and mud- and brickkiln-related air pollutants, there is every possibility of lung airway impairment with reduced flow rate. This may lead to augmented oxidative stress.
Since oxygen is highly involved in oxidative stress, its entry by means of respiratory capacity was also assessed in the present study. Chronic inflammation and oxidative stress are important features in the pathogenesis of chronic obstructive pulmonary disease (COPD).[10] PEFR can be assessed to detect any change that might have taken place at the pulmonary level; carriage of oxygen inside the blood/body must be assessed by means of biochemical parameters and the nanoscopic changes in the surface roughness of the RBC membrane.
The present study thereby hypothesizes the following:
Quantitative prediction of work stress-related damage in the early stages of its onset in brickfield workers.
RBC surface roughness dynamics as a function of oxidative stress are claimed as a novel and key clinical parameter in stress management.
Early signatures of the metabolic stress responses are primarily reflected on altered nanoscopic versions of the erythrocyte topography of the exposed workers.
Linear modeling has been aimed to be developed in order to demonstrate how individual oxidative stress markers such as MDA, G-6-PD, and reduced GSH are related to RBC surface roughness (RMS).
Materials and Methods
Participants
Thirty female brickfield workers (age in years: 19.05 ± 0.48, height in cm: 152.13 ± 7.32, weight in kg: 47.16 ± 8.20, body surface area in m2: 1.34 ± 0.10) were randomly chosen for the double-blind study from Nadia district of West Bengal, India. These volunteers represented the common socioeconomic background. Participants’ normal lifestyles were encouraged and they were asked to maintain the same for the whole session of sampling. Thirty (30) arbitrarily chosen shopkeepers of comparative socioeconomic status, age groups and lifestyles from the same area of study were taken into account as a control group. The study was performed following the ethical guidelines for biomedical research on human participants as directed by the Indian Council of Medical Research, Government of India (ICMR) and was duly approved by the Institutional Research Ethics Board of Presidency University, Kolkata, West Bengal, India. All stakeholders, namely, the volunteers, employers of the volunteers, and local administrative bodies unanimously agreed to give their consent after understanding the objectives and the tentative outcome of the study concerned.
Experimental protocol
The daily MMH activities of the subjects have been treated as an intense exercise and so the participants were tested in the morning before they began their work in the brickfield. During the entire period of their MMH activities in the field, their heart rate was monitored using a “polar heart beat monitor”. Ambient vibration around the workers were assessed by digital vibration meter (vibration meter, Digital Lurton, Taiwan, Model VB-8200), and similarity was noted as in the field condition.
Biochemical responses
Single blood sample per participant was withdrawn from the participants in the fasting condition before they began their daily shopkeeping and MMH activities in the brickfield for the assessment of the following:
Hemoglobin (in g%) by cyanmethemoglobin method.[11]
Serum lipid peroxidation in terms of serum MDA[12] using thiobarbituric acid (TBA).
Blood G6PD enzyme (quantitative) by UK-kinetic method.[13]
Reduced form of serum GSH in a standardized enzyme-linked immunosorbent assay (ELISA) plate reader using OxiSelect™ Total Glutathione (GSSG/GSH) Assay Kit.
Blood for RBC surface roughness analysis was drawn immediately after completion of the participants’ daily shopkeeping and MMH activities. Standardized Wright's Peak Flow Meter was used to assess the PEFR in liter/min among all the subjects immediately after they completed their daily MMH activities. Since most of the stress situations are inversely related to PEFR at different gradations, PEFR was treated here as a performance parameter, as observed in the present study.
The environmental temperature varied between 24°C and 28°C and the relative humidity was about 78% during the entire study period.
Data analysis
We studied the variations of MDA, GSH, G-6-PD, and PEFR with the damage of an erythrocyte (RBC). This prompted us to measure the damage of an erythrocyte by its surface roughness. This measure automatically provides zero roughness for a smooth surface of an RBC.
This specific study used root mean square (RMS) value to assess RBC surface roughness. The software for Veeco atomic-force microscopy (AFM) includes two offtime Nanoscope commands, Analyze/Power Spectral Density, and Modify/two dimensional Spectrum utilizing Fourier analysis to extract information from images. A third method, Analyze/Auto Covariance Function (ACF), utilizes a related discrete method for analyzing images. Fast Fourier Transforms (FFT), Power Spectral Densities (PSD), autocovariance, and RMS roughness of erythrocytes may be interrelated mathematically. This relationship may be stated as follows:
PSD = FFT2 = FFT (ACF) = RMS2
The external measurement of vibration damaging human health can be assessed by the RMS descriptive measure, whereas the internal silent and hidden damages of the human body from within is claimed to be primarily assessed by the RMS roughness of the erythrocyte, which is duly supported by the oxidative stress-induced biochemical parameters in the form of changes in MDA, G-6-PD, and GSH.
To calculate the surface roughness, the following approach was followed:[14]
The normal height hi at any point on the surface of an RBC cell was measured from any arbitrary level. Collecting all data of hi (depending on the location on the surface), the average of these heights was calculated, h̄ (say). Now the RMS roughness (RMSR), r is defined as follows:

where N is the total number of data. This r now gives the right choice of the variable. The MDA, GSH, G-6-PD, and PEFR are studied as a function of r and shown in the Figures 1, 2, 4, and 7.
Figure 1.
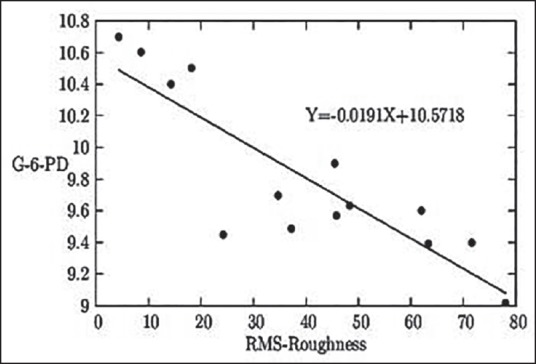
The graphical representation of the relationship between the RBC surface roughness in nm and whole blood quantitative G6PD status in U/g Hb
Figure 2.
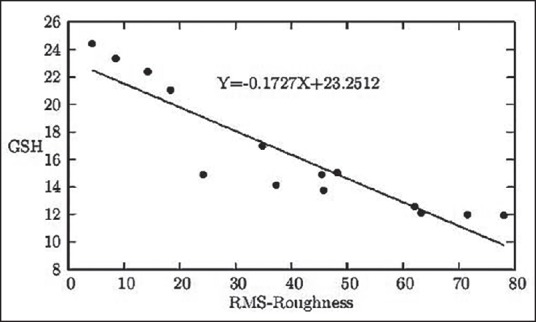
The graphical representation of the linear relationship between the RBC surface roughness in nm and serum GSH status in mg/100 mL blood
Figure 4.
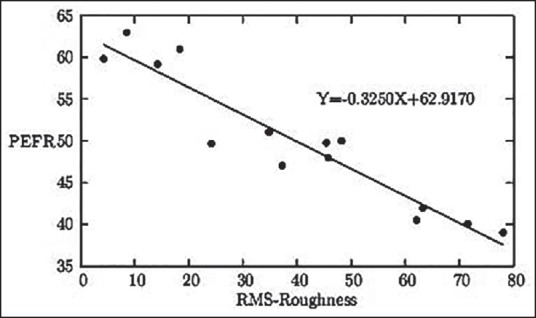
The graphical representation of the linear relationship between the RBC surface roughness in nm and PEFR in liter/min
Figure 7.
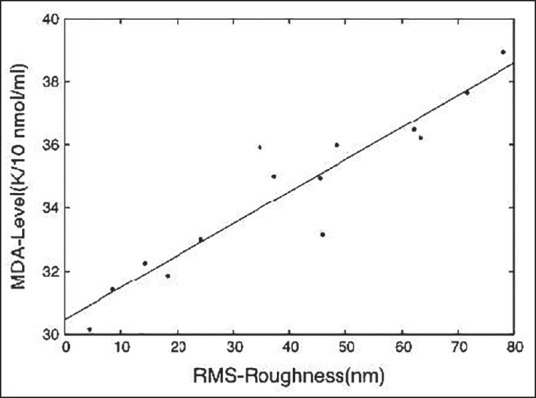
The graphical representation of the linear relationship between the RBC surface roughness (RMS) in nm and the respective MDA status in k × 10-1 nmol/mL of serum
After careful observation of the linear fit models, we decided to fit these variations by least square fit, generating a linear relationship such as y = mx + c. The quantity Q is defined as Q(m,c) = ∑i(yi − mxi − c)2. To get the least square fit, one has to minimize Q with respect to m and c, consequently,  and
and  . As a result of demanding partial derivatives equal to zero, one will get two linear simultaneous equations, ∑i xi(yi − mxi − c) = 0 and ∑i(yi − mxi − c) = 0. Solving these two equations the slope m and intercept c become:


Let us denote the roughness of RBC surface by x and the MDA level by y. If the data are fitted by straight line, the form will be y = mx + c. The error is given as:
Q(m,c) = ∑i(yi − mxi − c)2 (4)
The least square method of fitting suggests minimizing Q with respect to m and c, which gives


Differentiating partially Q (m, c) (Eqn. 4) with respect to m and c results in
∑i(yi − mxi − c)xi = 0 (7)
and ∑i(yi − mxi − c) = 0 (8)
Now solving these two (Eqns.7 and 8) simultaneous linear equations (in m and c), we get
Eqn (2) and (3), i.e.,

where n is the total number of data (x, y).[15]
The term “vibration” (i.e., roughness) refers to any oscillatory motion around a central point and is usually described in three dimensions. Vibration is measured with an accelerometer, which can be attached to the vibration source or to a bony spot on a person's body. This device measures displacement acceleration in one or more dimensions.
The most common descriptive measure of vibration is the RMS value, used in “di nanoscopic command”
RMS = \/I /T x2 (t) dt,
where x (t)  is displacement along a particular dimension (usually specified as X, Y, or Z in three-dimensional space) as a function of time. RMS is roughly the square root of the average squared displacement for a fixed interval of time T. An accelerometer should be as small as possible and be sensitive to the ranges of acceleration and frequencies expected from the vibration source.[16] Since our data represent a cross-sectional part of the population, it may be treated as a discrete type of variation (and not continuous one) and hence, the abovementioned integral definition of RMS in case of RBC surface morphology is not applicable in our study.
Statistical analysis
All the observations were statistically analyzed by Minitab Software Minitab-15 (Minitab Inc. PA, USA) version 2009. The correlations between RMS roughness, serum MDA level, blood G-6-PD level, GSH level, and PEFR were assessed. Statistical significance was set at 5% level, (P < 0.05).
Results
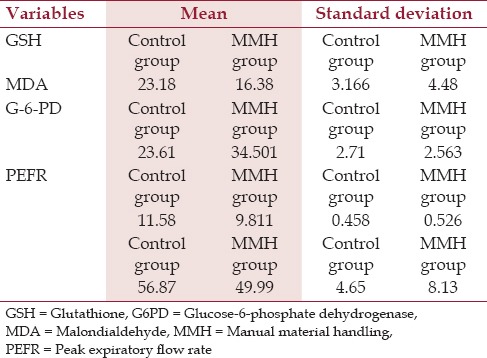
Results indicate that the PEFR (49.99 ± 8.13), GSH (16.38 ± 4.48) and G-6-PD (9.811 ± 0.526) values of the experimental group, i.e., the brickfield workers, were significantly lower as compared to the PEFR (56.87 ± 4.65), GSH (23.18 ± 3.17), and G-6-PD (11.58 ± 0.46) values of the control group (P < 0.01). On the contrary, MDA value (34.501 ± 2.563) of the brickfield workers was significantly (P < 0.01) higher in comparison to the control group. Furthermore, the RMS roughness of the erythrocyte surface membrane also exhibited a much higher value (P < 0.05) for the brickfield workers (39.75 ± 23.67) than the control group (16.93 ± 3.83). All these findings indicated that the brickfield workers were exposed to a much higher level of oxidative stress, as a result of which there was a decrease in their intrinsic antioxidant levels, i.e., GSH and G-6-PD levels. The increasing oxidative assault expressed itself by a higher degree of MDA and RMSR value in the experimental group [Table 1].
Table 1.
Comparative table showing central tendency between MMH group and control counterpart
The linear best fit of data is obtained by minimizing the R2 value with respect to m and C. So for used values of m and C, the value of R2 is minimum and of the order of 10-6. Since the slope m is given up to 4th decimal place (10-4), the value of R2 (10-6) is insignificant. However, since the data are consistent all throughout and P values of all the seven equations were found to be within 0.001 and 0.005 indicating statistical significance, individual representations were omitted.
The results indicate a linear relationship between all the parameters with different slopes and intercepts [Table 2]. The central tendency of these linear relationships is present in figures [Figures 1-7], which may be instrumental for developing newer “oxidative stress markers” in the long run.
Table 2.
Specifications of linear models developed by pairs of variables correlated to oxidative stress
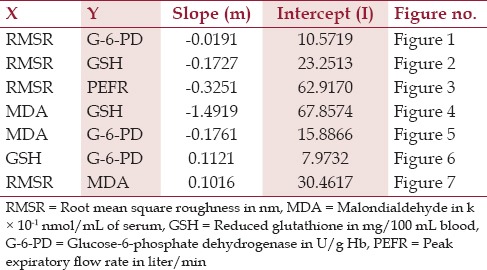
Figure 1 indicates that with the rise in the RBC surface roughness level, the G6PD level decreases.
With respect to MMH-induced oxidative stress, another newly emerged tendency can be visualized between increasing values of RBC surface roughness and simultaneous decrease of serum GSH level [Figure 2]. The specific linear correlation between serum MDA level and serum GSH level (both being established biomarkers of oxidative stress) with respect to MMH-induced oxidative stress can be visualized [Figure 3]. With rise in surface roughness, the PEFR values decrease at a specific rate [Figure 4].
Figure 3.
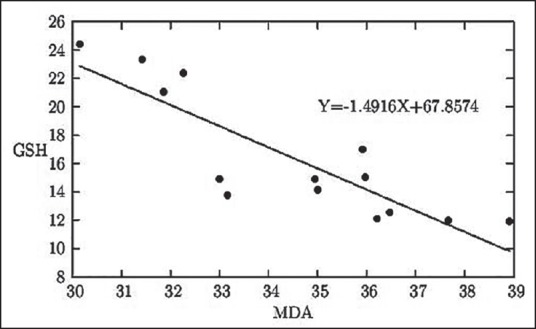
The graphical representation of the linear relationship between serum MDA level in k × 10-1 nmol/mL of serum and serum GSH status in mg/100 mL blood
With increase in MDA level, as occurs due to MMH induced oxidative stress there is a decrease in the G-6-PD level [Figure 5], which indicates the protective antioxidative role of G6PD within the erythrocyte.
Figure 5.
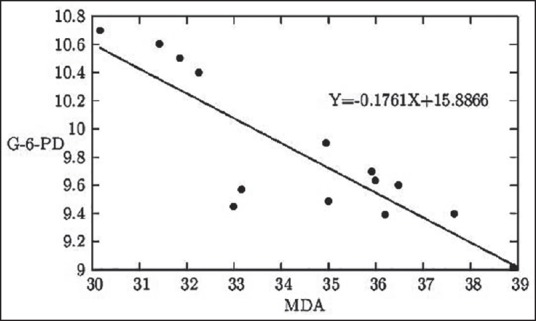
The graphical representation of the linear relationship between serum MDA level in k × 10-1 nmol/mL of serum and whole blood quantitative G6PD status in U/g Hb
A positive correlation has been established between reduced GSH level and G6PD status and reaffirmed in this study [Figure 6]. Though the interrelationship between GSH and G6PD level is well-known, the regression line as developed between the two parameters in the MMH workers of the eastern part of India is the first of its type, we claim.
Figure 6.
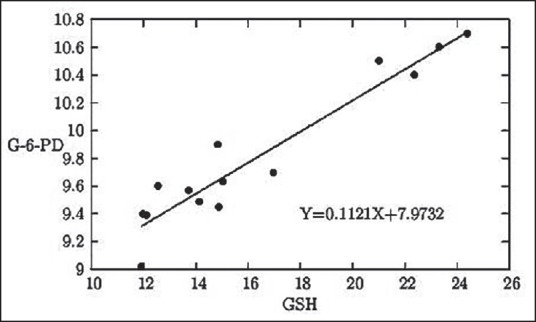
The graphical representation of the linear relationship between serum GSH status in mg/100 mL blood and whole blood quantitative G6PD status in U/g Hb
The greater the oxidative assault, the lower the values of GSH and G6PD [Figures 3 and 5] with both being bonafide members of the antioxidative defense systems of the body and this is reflected by an increase in the surface roughness of the erythrocyte membrane [Figure 7].
Figure 8 shows observed a comparison of the AFM picture of the erythrocyte membrane surface topography of a non-MMH exposed erythrocyte and an erythrocyte after MMH-induced oxidative stress. Scanning probe software analytical studies indicate deviations of the surface morphology of the erythrocyte with increase in the corrugations from a non-MMH exposed erythrocyte.
Figure 8.
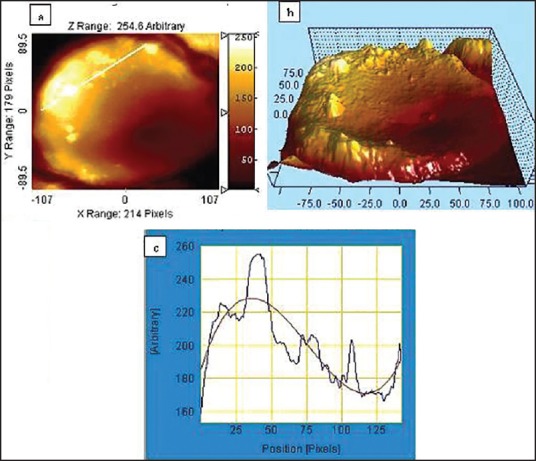
(a) Surface image of damaged erythrocyte measuring the gradation of roughness (b) Lateral force microscopic 3D image showing higher level of surface asymmetry (c) Graphical representation showing deviation for corrugated cell surface using scanning probe software
The reverse is also true where we find a smoother cell surface topography with less surface roughness for a healthy erythrocyte [Figure 9]. RMS surface roughness values are indicative of the corrugation level on the erythrocyte membrane surface. The higher the value, greater is the surface roughness, which is further confirmed by the AFM pictures in Figure 10.
Figure 9.
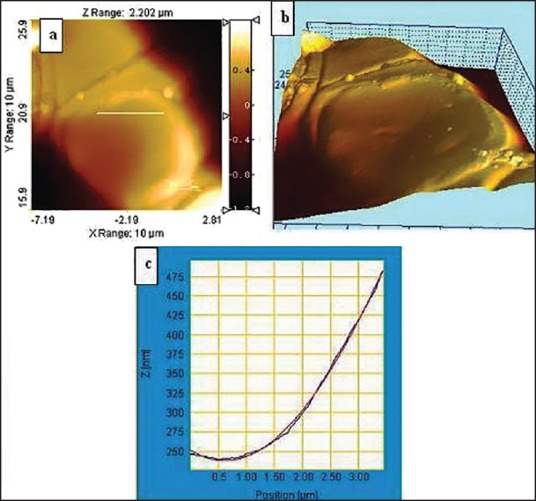
(a) Comparative surface image of healthier erythrocyte measuring lesser surface roughness (b) Lateral force microscopic 3D image showing lower level of surface asymmetry (c) Graphical representation showing lower deviation for smoother cell surface
Figure 10.
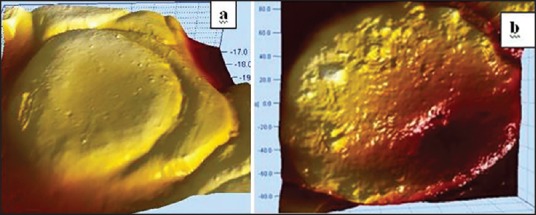
(a) 3D image for root mean square (RMS) surface roughness showing lower value (62.0553 nm) for smoother surface (b) Comparative RMS roughness showing higher value (237.843 nm), indicating greater surface corrugations
Since all the relevant significant changes took place only for the MMH workers in comparison to the control group, only those changes of the MMH workers were expressed in the figures and tables [Table 2 and Figures 1-10].
Discussion
The present study applies the technological development of nanoscopic vision of erythrocyte topography on the laborers of MMH. Due to the type of their work activity, these workers are also exposed to vibration, specifically hand-arm vibration. This type of segmental vibration is known to pose health risks such as probabilities of excess prevalence of bone cysts, Kienbock's disease, pseudarthrosis and Dupuytren's disease, with tingling, numbness, and blanching of fingers, and all types of vascular, neurologic, and musculoskeletal damages. However, it is not clear if the workers exposed to both MMH and vibration are susceptible to oxidative stress. We evaluated varied biochemical responses in both workers and control groups.
Since the data of the control group matched significantly with the normal healthy sedentary lifestyle (as the subject's counterpart), namely, 30 arbitrarily chosen shopkeepers of the comparative socioeconomic status, age group, and lifestyle and their values existed very much in the normal ranges, these were intentionally not mentioned in the text. The comparative aspect related to specific changes of RBC surface roughness was mentioned in the corresponding figures [Figures 9 and 10].
We measured G-6-PD activity and oxidative stress levels in terms of MDA, evaluated by determining the level of plasma thiobarbituric acid reactive species (TBARS), which are end products of lipid peroxidation. In RBCs, lipid peroxidation causes disorganization of the lipid moiety of cell membranes resulting in lethal damage to the cell. G6PD deficiency is the most common red blood cell enzyme disorder in humans, affecting more than 400 million people worldwide.[9,17,18] MMH, in our study, acts as a stressor in inducing different grades of oxidative damages.
In G6PD deficiency, normal NADPH concentrations cannot be maintained and GSH levels decrease, resulting in RBC oxidative damage due to endogenous and exogenous agents, leading to a hemolytic crisis.[9,19] Our study tried to determine the probable relationship of serum GSH level and surface roughness value to predict the degree of oxidative damage of RBC and make prediction science more accurate.
AFM has recently been applied to detect nanometer scale objects not only in the analysis of material science but also in the biomedical field.[20] AFM and interference microscopy are two methods often used to measure roughness but the probe size is very different and they respond to different physical properties (hardness and reflectivity).[21] This study exclusively employed AFM imaging.
Cellular surface roughness shows a gradual rise with respective decrease in G6PD enzyme level. This relationship between enzymopathy and erythrocyte surface roughness [Figure 1] may be used instrumentally to assess early damage. Reduced GSH in the body acts as a potent antioxidant protein protecting from oxidative damages and, as demonstrated in Figure 2, there was a gradual decrease in GSH making the body more prone to damage, which is justifiably supported by rise in erythrocyte surface roughness. The equation derived is claimed by us to be helpful in assessing earlier possible damage in the exposed group.
Our observations clearly showed 50-70% of the usual or normal peak flow readings, indicating caution for respiratory damages. It may mean that respiratory airways are narrowing and additional medicinal/preventive measure may be required. Our result [Figure 4] indicated significantly lower value compared to “expected PEFR depending on height and age of a male.”[22] This observation clearly indicates that almost all the subjects were suffering from relatively mild to moderate small airway obstruction. Based on Figure 4, a gradual fall in PEFR with respect to rise in corresponding erythrocyte roughness may also be helpful in the early detection and assessment of oxidative damage.
MDA is globally established as one of the most potent biochemical markers of oxidative stress in the body and increased MDA level in the blood unequivocally indicates higher oxidative damage there. Our earlier observations are hereby reconfirmed with this plot [Figure 7], indicating that erythrocyte surface roughness (RMS roughness) is a novel parameter of oxidative stress, which can be assessed easily as an early marker of damages. A rise in MDA status is related with a gradual fall in GSH level [Figure 3], indicating and supporting similar inferences of Figures 1 and 2.
Again, G6PD level shows two opposing relationships between MDA levels [Figure 5] and between GSH levels [Figure 6]. MDA being the representative biochemical of oxidative damage, its rising concentration gradually decreases the G6PD levels in the body. On the other hand, G6PD and GSH both represent protective biochemicals working against oxidative damages and therefore, rise of one of these is found to stimulate the rise of the other one.
The tertiary support from the detrimental lung function parameter, i.e., PEFR, further ensures these observations.[23]
This study finds out the quantitative probability of such an early marker of occupational stress crisis in terms of roughness of the concerned cells.[24] Roughness analysis and metabolic stress responses are hereby correlated in different capacities by the linear fit model and these regressive models were claimed to be instrumental in the early detection of occupational stress development.
MMH-induced vibration damages primarily draws its detrimental signature on RBC surfaces, increasing its roughness before inducing any measurable metabolic oxidative damages — this is the hypothesis and corollary to that is that vibration gradually makes the surfaces of erythrocytes rough and the said roughness is considered to possess a novel dimension for stress assessment.
The three-dimensional micrographs with resolution down to the nanometer scale with AFM have been utilized here in imaging and quantifying erythrocyte surfaces and its roughness, as an early strain index.
Conclusion
Stress-related occupational exposure has been metabolically well-documented earlier but this attempt is unique in predicting the damage accurately by cellular morphological deformities duly endorsed by correlated biochemical status in the occupationally exposed individuals as compared to the control group. Linear regression models developed on the biochemical responses may be utilized as a community-specific nanoscopic marker of occupational stress. It appears that these linear models might be instrumental in predicting early oxidative damages related to specific occupational hazards.
This unique feature is quite interesting and has not been reported earlier.
Financial support and sponsorship
Nil.
Conflicts of interest
There are no conflicts of interest.
References
- 1.Helander M. Manual materials handling. In: Helander M, editor. A Guide to Human Factors and Ergonomics. 2nd ed. USA: CRC Press; 2005. p. 187. [Google Scholar]
- 2.Chaffin DB. Biomechanical modeling of the low back during load lifting. Ergonomics. 1988;31:685–97. doi: 10.1080/00140138808966712. [DOI] [PubMed] [Google Scholar]
- 3.Lawrence JS. Rheumatism in coal miners: Part III: Occupational factors. Br J Ind Med. 1955;12:249–61. doi: 10.1136/oem.12.3.249. [DOI] [PMC free article] [PubMed] [Google Scholar]
- 4.Helander M. Accidents: Human errors and safety. In: Helander M, editor. A Guide to Human Factors and Ergonomics. 2nd ed. USA: CRC Press; 2005. p. 335. [Google Scholar]
- 5.Reason J. Human error: Models and management. BMJ. 2000;320:768–70. doi: 10.1136/bmj.320.7237.768. [DOI] [PMC free article] [PubMed] [Google Scholar]
- 6.Ghosh S, Acharyya M, Bagchi A. G-6-PD level and surface nanoscopy: A novel approach in ergonomic stress management of female labours in Bengal suburbs performing manual material handling. J Human Ergol (Tokyo) 2009;38:51–65. [PubMed] [Google Scholar]
- 7.Njålsson R, Norgren S. Physiological and pathological aspects of GSH metabolism. Acta Paediatr. 2005;94:132–7. doi: 10.1111/j.1651-2227.2005.tb01878.x. [DOI] [PubMed] [Google Scholar]
- 8.Bilmen S, Aksu TA, Gümüşlü S, Korgun DK, Canatan D. Antioxidant capacity of G-6-PD-deficient erythrocytes. Clin Chim Acta. 2001;303:83–6. doi: 10.1016/s0009-8981(00)00384-3. [DOI] [PubMed] [Google Scholar]
- 9.Mason PJ, Bautista JM, Gilsanz F. G6PD deficiency: The genotype-phenotype association. Blood Rev. 2007;21:267–83. doi: 10.1016/j.blre.2007.05.002. [DOI] [PubMed] [Google Scholar]
- 10.Rahman I. The role of oxidative stress in the pathogenesis of COPD: Implications for therapy. Treat Respir Med. 2005;4:175–200. doi: 10.2165/00151829-200504030-00003. [DOI] [PubMed] [Google Scholar]
- 11.Varley H, Gowenlock AH, Bell M. Cyanomethaemoglobin method. In: Varley H, Gowenlock AH, Bell M, editors. Practical Clinical Biochemistry. 5th ed. Vol. 1. London: William Heinemann Medical Books; 1980. pp. 979–90. [Google Scholar]
- 12.Yagi K. Assay for blood plasma or serum. Method Enzymol. 1984;105:328–31. doi: 10.1016/s0076-6879(84)05042-4. [DOI] [PubMed] [Google Scholar]
- 13.Kachmar JF, Moss DW. Enzymes. In: Teitz NW, editor. Fundamentals of Clinical Chemistry. Philadelphia: Saunders; 1976. pp. 666–72. [Google Scholar]
- 14.Gerald CF, Wheatley PO. Applied Numerical Analysis. 6th ed. Pearson Education; 2006. p. 264. [Google Scholar]
- 15.Scarborough JB. Numerical Mathematical Analysis. Oxford: Oxford University Press; 1930. p. 533. [Google Scholar]
- 16.Proctor RW, Van Zandt T. Human Factors in Simple and Complex Systems. 2nd ed. Boca Raton, FL: CRC Press; 2008. p. 486. [Google Scholar]
- 17.Beutler E. G6PD deficiency. Blood. 1994;84:3613–36. [PubMed] [Google Scholar]
- 18.Beutler E. Glucose-6-phosphate dehydrogenase deficiency: A historical perspective. Blood. 2008;111:16–24. doi: 10.1182/blood-2007-04-077412. [DOI] [PubMed] [Google Scholar]
- 19.Frank JE. Diagnosis and management of G6PD deficiency. Am Fam Physician. 2005;72:1277–82. [PubMed] [Google Scholar]
- 20.Hansma HG, Hoh JH. Biomolecular imaging with the atomic force microscope. Annu Rev Biophys Biomol Struct. 1994;23:115–39. doi: 10.1146/annurev.bb.23.060194.000555. [DOI] [PubMed] [Google Scholar]
- 21.Kuhle A, Rosen BG, Garnaes J. Comparison of roughness measurement with atomic force microscopy and interference microscopy. In: Duparre A, Singh B, editors. Advanced Characterization Techniques for Optics, Semiconductors, and Nanotechnologies. Vol. 5188. Proceedings of SPIE; 2003. pp. 154–61. [Google Scholar]
- 22.Chen E, Schreier HM, Strunk RC, Brauer M. Chronic traffic-related air pollution and stress interact to predict biologic and clinical outcomes in asthma. Environ Health Prespect. 2008;116:970–5. doi: 10.1289/ehp.11076. [DOI] [PMC free article] [PubMed] [Google Scholar]
- 23.Barreiro E, Peinado VI, Galdiz JB, Ferrer E, Marin-Corral J, Sánchez F, et al. Cigarette smoke-induced oxidative stress: A role in chronic obstructive pulmonary disease skeletal muscle dysfunction. Am J Respir Crit Care Med. 2010;182:477–88. doi: 10.1164/rccm.200908-1220OC. [DOI] [PubMed] [Google Scholar]
- 24.Yamashina S, Katsumata O. Structural analysis of red blood cell membrane with an atomic force microscope. J Electron Microsc (Tokyo) 2000;49:445–51. doi: 10.1093/oxfordjournals.jmicro.a023827. [DOI] [PubMed] [Google Scholar]


