Abstract
Bax is a key regulator of apoptosis that, under cell stress, accumulates at mitochondria, where it oligomerizes to mediate the permeabilization of the mitochondrial outer membrane leading to cytochrome c release and cell death. However, the underlying mechanism behind Bax function remains poorly understood. Here, we studied the spatial organization of Bax in apoptotic cells using dual‐color single‐molecule localization‐based super‐resolution microscopy. We show that active Bax clustered into a broad distribution of distinct architectures, including full rings, as well as linear and arc‐shaped oligomeric assemblies that localized in discrete foci along mitochondria. Remarkably, both rings and arcs assemblies of Bax perforated the membrane, as revealed by atomic force microscopy in lipid bilayers. Our data identify the supramolecular organization of Bax during apoptosis and support a molecular mechanism in which Bax fully or partially delineates pores of different sizes to permeabilize the mitochondrial outer membrane.
Keywords: AFM, apoptosis, Bcl‐2, pore‐forming protein, super‐resolution microscopy
Subject Categories: Autophagy & Cell Death, Membrane & Intracellular Transport, Structural Biology
Introduction
Mitochondrial outer membrane (MOM) permeabilization is an essential event in the intrinsic apoptosis pathway that enables the release of cytochrome c and other apoptotic proteins into the cytosol leading to caspase activation and cell death(García‐Sáez, 2012). However, the molecular mechanism of MOM permeabilization is unsettled. Bax and Bak, which are proapoptotic members of the Bcl‐2 family, are key regulators believed to directly participate in this process. Indeed, Bax−/− Bak−/− cells are resistant to several apoptotic insults (Wei et al, 2001) and mice defective in these proteins exhibit poor survival (Lindsten et al, 2000).
Bax is a soluble monomeric protein constitutively shuttling between the cytosol and the mitochondrial surface of healthy cells (Edlich et al, 2011). Following cell stress, Bax is activated and accumulates at the MOM, where it undergoes major conformational changes (Wolter et al, 1997; Lovell et al, 2008), inserts in the membrane, and oligomerizes to mediate MOM permeabilization(García‐Sáez et al, 2004; Annis et al, 2005). The most accepted model of MOM permeabilization proposes the formation of Bax pores that allow cytochrome c and the other apoptotic factors to go through. This is mostly based on structural resemblance of the Bcl‐2 homologs to bacterial pore‐forming toxins (Suzuki et al, 2000) and on pore activity detected for Bax and Bak in vitro using artificial model membranes (Antonsson et al, 2000; Basanez et al, 2002; Kuwana et al, 2002; Lovell et al, 2008). According to these studies, Bax forms pores lined by protein and lipid molecules, which are long‐lived and large enough to release high molecular weight molecules, including cytochrome c (Bleicken et al, 2013b). In agreement with this, lipid pores containing only one active Bax molecule have been visualized in lipid nanodisks (Xu et al, 2013). The size of these pores is tunable and can be regulated by protein density on the membrane, indicating the ability of Bax to form relatively flexible structures of different dimensions (Bleicken et al, 2013a). Recent structural studies have also shown that active, membrane‐embedded Bax arranges into symmetric dimers, which serve as building blocks for the larger aggregates that mediate membrane disruption (Bleicken et al, 2010, 2014; Czabotar et al, 2013; Subburaj et al, 2015). Yet, the supramolecular arrangement of Bax in mitochondria during apoptosis and its relationship with MOM permeabilization remain elusive.
Here, we took advantage of single‐molecule localization microscopy (SMLM) as a tool to uncover the structural organization of active, mitochondrial Bax at the nanoscale. We found that Bax adopted a distribution of distinctive non‐random structures related to MOM permeabilization in the mitochondria of mammalian cells. Bax assemblies were heterogeneous in size and shape and resembled full rings, as well as lines and incomplete rings or arcs. These supramolecular structures were characteristic of active, functional Bax and could also be observed as part of membrane pores in pure lipid bilayers with atomic force microscopy. Together, these findings provide substantial new understanding of the molecular mechanism of Bax involved in MOM permeabilization.
Results
Bax translocation to discrete foci at the MOM correlates with mitochondrial depolarization
The spatial distribution of Bax evolves with time during the different stages of apoptosis progression (Wei et al, 2001). In order to set the optimal conditions for visualizing Bax structures associated with MOM permeabilization by super‐resolution microscopy, we established a cellular system based on HeLa cells transfected with GFP‐Bax. We compared the expression levels of total Bax in HeLa cells transfected or not with GFP‐Bax and found that they were very similar (Fig EV1A). It seemed that transfected HeLa cells downregulated the levels of endogenous Bax so that the total amount of protein allowed survival. We then stained the GFP‐Bax transfected cells with the potential dependent dye TMRE. This allowed us to track GFP‐Bax translocation in parallel to mitochondrial depolarization, which is a marker for MOM permeabilization, and to identify the time point after apoptosis induction when most of GFP‐Bax signal was heterogeneously distributed in discrete foci at the MOM. We induced cell death by treatment with staurosporine (STS), a protein kinase inhibitor, and monitored GFP‐Bax and TMRE signal over time using live cell imaging. GFP‐Bax translocation from the cytosol to the mitochondria was detected by the change from diffuse, cytosolic fluorescence intensity to a discrete, heterogeneous signal in the green channel that was localized at mitochondria (Fig 1A). We related it with parallel mitochondria depolarization monitored by the loss of TMRE fluorescence.
Figure EV1. Bax is active and oligomerized in the cells after apoptosis induction.
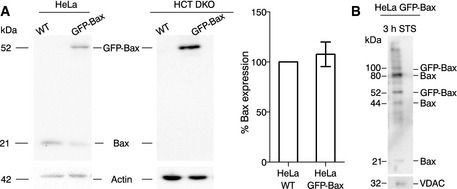
- Analysis of Bax protein levels in HeLa and HCT116 Bax/Bak−/− cells (wild‐type and overexpressing GFP‐Bax) by Western blot. The bar graph corresponds to the quantification of Bax expression in HeLa WT and HeLa GFP‐Bax cells. Protein expression was first corrected with respect to the loading control (actin). Then, the expression of endogenous Bax from WT cells was normalized to 100% and compared with the total amount Bax (arising from endogenous protein and GFP‐Bax) in transfected cells. Mean ± SEM of three independent experiments.
- Analysis of Bax translocation and oligomerization in mitochondria by Western blot. VDAC, loading control.
Figure 1. Bax translocation to mitochondria correlates with mitochondrial depolarization.
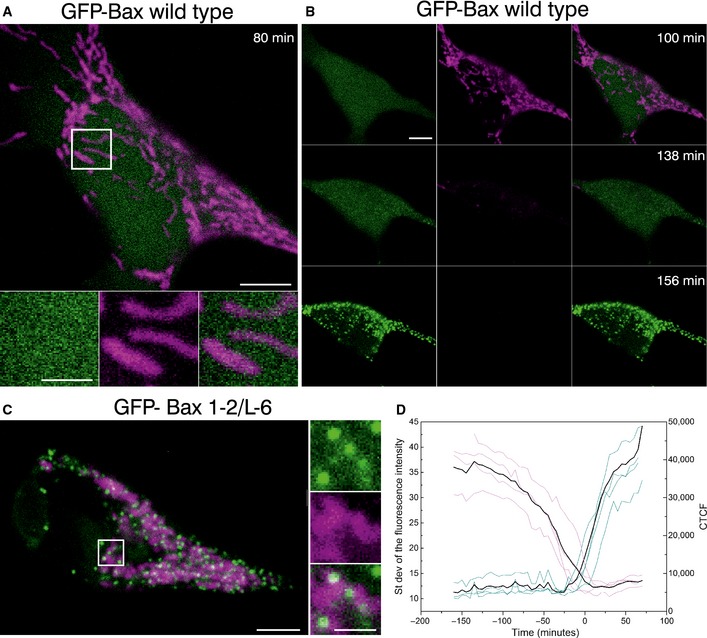
- Confocal live cell imaging of HeLa cells overexpressing GFP‐Bax (green) and mitochondria marked with TMRE 100 nM (magenta) show cytosolic GFP‐Bax distribution and healthy mitochondria. Lower panels are zoomed images corresponding to the white rectangle in the upper panel and represent the individual and merged channels. Time shows the minutes after apoptosis induction with staurosporine (STS) 1 μM. Scale bars, 5 μm (overview) and 2 μm (zooms)
- HeLa cells shown in (A) at longer times after STS treatment. Images show sequential GFP‐Bax translocation (green), which correlates with mitochondria depolarization (TMRE, magenta). Scale bars, 5 μm.
- HeLa cells overexpressing GFP‐Bax mutant (1‐2/L‐6) (green) and mitochondria marked with TMRE 100 nM (magenta). Images show constitutive GFP‐Bax localization to healthy mitochondria without apoptosis induction. Right panels are zoomed images corresponding to the white rectangle in the left panel and represent the individual and overlaid channels. Scale bars, 5 μm (overview) and 2 μm (zooms).
- Standard deviation of the fluorescence intensity of GFP‐Bax (blue) versus the corrected total cell fluorescence (CTCF) of TMRE (purple) in individual cells (N = 4). CTCF = Integrated Density – (Area of selected cell × Mean fluorescence of 3 background readings). Time 0 corresponds to the normalized time when both events cross in each cell. Black line represents the average of the individual cells.
In agreement with previous studies, the time of cell death induction was heterogeneous in the cell population (Xia et al, 2014). After 2‐h treatment, cells started to lose their potential and most GFP‐Bax appeared translocated to mitochondria, although even after 4 h, a fraction of the cell population still retained high mitochondrial potential. Six hours after adding STS, all cells exhibited a heterogeneous GFP‐Bax pattern and TMRE fluorescence was not perceptible anymore. We plotted the kinetics of these events for each individual cell as the increase in the standard deviation of the GFP fluorescence intensity, corresponding to Bax translocation to the MOM, and the total TMRE fluorescence per cell, which indicates mitochondrial potential, as a function of time (Fig 1C). Our results indicated that GFP‐Bax translocation and mitochondria depolarization strongly correlated with each other, as expected, and that the most suitable time frame to study Bax structural organization in apoptosis by super‐resolution was from 2 to 6 h after apoptosis induction. As an additional control for Bax activation, we have confirmed that the protein is oligomerized by Western blot (Fig EV1B).
As a control, we transfected HeLa cells with GFP‐Bax 1‐2/L‐6. This is an inactive Bax mutant described by Edlich et al (2011) that constitutively binds to mitochondria of healthy cells but does not permeabilize the membrane (Fig 1B). This mutant remains inactive at the MOM due to the presence of a disulfide bond between Bax helices 1 and 2 and the constriction of the loop between those two helices to the tip of helix 6. Under control conditions, we detected most of GFP‐Bax 1‐2/L‐6 signal at discrete foci on polarized mitochondria that retained the TMRE fluorescence, which indicates that the MOM remained impermeable despite the presence of GFP‐Bax 1‐2/L‐6. This mutant also served as an excellent control for the super‐resolution studies, because it provided suitable fluorescence signal for Bax constitutively bound to mitochondria, but in an inactive conformation.
Bax assembles into full and incomplete ring‐like structures at mitochondria of apoptotic cells
To investigate the nanoscale organization of Bax oligomers at the MOM during apoptosis, we used a single‐molecule approach based on image reconstruction by the accurate localization of isolated emitters, called single‐molecule localization microscopy (SMLM). We labeled HeLa cells overexpressing GFP‐Bax with anti‐GFP nanobodies coupled to Alexa Fluor 647 (AF647), a fluorescent probe optimized for super‐resolution imaging (Ries et al, 2012). These nanobodies are smaller (1.5 nm × 2.5 nm) than usual antibodies and bind GFP with high specificity (Rothbauer et al, 2006). In addition, the bright dyes coupled to them are photo‐switchable under specific buffer conditions and allow resolving structures in the 20‐nm range (Ries et al, 2012).
Previous work suggested that in single cells only minimal gathering of Bax is needed to promote mitochondria depolarization and fragmentation (Düssmann et al, 2010) before total translocation of Bax to the MOM is achieved (Zhou & Chang, 2008). We acquired images on fixed cells that had been treated with STS for 2–6 h and qualitatively showed no difference in the number or shape of structures within this range of incubation times with the drug. In particular, the individual cells selected for imaging in the different experiments exhibited a similar apoptotic state, characterized by GFP‐Bax in a dotted distribution, but overall cellular integrity, as judged by the cell shape and the absence of blebs (Figs 2A and EV2). This was important to minimize the background signal of cytosolic Bax because it would interfere with a proper image reconstruction. Therefore, we visualized a specific apoptotic stage corresponding to the organization of Bax signal once almost all molecules are irreversibly bound to mitochondria, but before most cellular components have been disassembled. As the pores induced by Bax are stable and permeabilize mitochondria for long periods of time (Munoz‐Pinedo et al, 2006; Bleicken et al, 2013a), the stage of Bax organization we investigated was associated with the pore‐forming state of Bax assemblies.
Figure 2. Super‐resolution of Bax by single‐molecule localization microscopy reveals non‐random structures in apoptotic mitochondria.
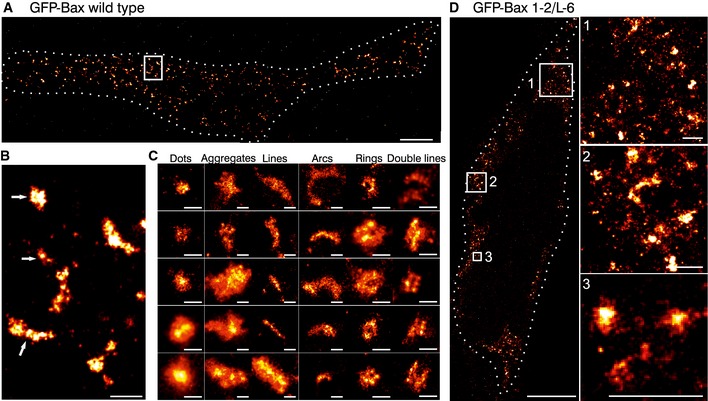
- Overview of a reconstructed super‐resolution image of GFP‐Bax‐overexpressing HeLa cells stained with AF647‐anti‐GFP nanobodies. Image was acquired on fixed cells 3 h after apoptosis induction with STS. Dotted line shows the cell shape (see Fig EV2). Scale bar, 5 μm.
- Magnified reconstructed super‐resolution image corresponding to the white rectangle in (A) showing the shapes of GFP‐Bax WT structures (white arrows). Scale bar, 500 nm.
- Gallery of typical GFP‐Bax WT structures during apoptosis found in all the analyzed cells. Scale bars, 100 nm.
- Overview (left) and 3 enlarged insets (right) of HeLa cells overexpressing GFP‐Bax 1‐2/L‐6 stained with AF647‐anti‐GFP nanobodies. Figure shows reconstructed super‐resolution images acquired without apoptosis induction. Scale bars, 5 μm (overview) and 500 nm (insets).
Figure EV2. Cell shape identification in SMLM images.
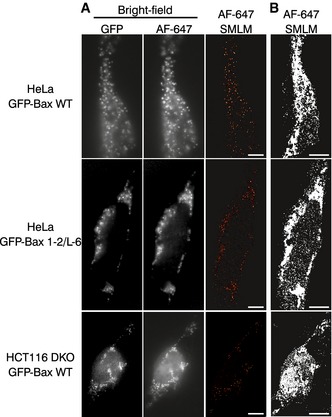
- Bright field images and SMLM overviews of HeLa and HCT116 DKO cells overexpressing GFP‐Bax or GFP‐Bax 1‐2/L‐6, respectively. Bright field images were taken in the GFP and AF647 channels before acquisition with single‐molecule localization. Scale bars, 500 nm.
- SMLM images shown in (A) reconstructed with all the localizations and no cutoff applied. Pictures were converted to binary images and a black‐white mask was applied to define the cell shape. Scale bars, 500 nm.
Reconstructed super‐resolution images showed a large fraction of the Bax signal as random dots or big aggregates in which no particular structural organization could be distinguished. But importantly, we also found a significant amount of well‐defined non‐random structures, which seemed to be specific of active Bax on the membrane (Fig 2B). Concretely, we identified both full and incomplete (arc‐shaped) rings of Bax molecules, as well as linear assemblies, which in a few cases appeared as double lines (Fig 2C).
In an effort to validate the connection between these defined structures and Bax role in MOM permeabilization, we examined the signal of inactive Bax at mitochondria under control conditions by SMLM. We acquired super‐resolution images of healthy HeLa cells transfected with the non‐functional mutant GFP‐Bax 1‐2/L‐6 (Fig 2D). Consistent with the lack of activity, we detected a higher proportion of undefined dots and aggregates in GFP‐Bax 1‐2/L‐6 with respect to its wild‐type counterpart (GFP‐Bax WT) (Fig EV3), which were in general smaller. To ensure a systematic, blind analysis, we also classified the non‐random structures detected as lines, arcs, and full rings (we did not detect any double lines). We next calculated different parameters for each structure in order to compare them quantitatively under both conditions. Concretely, we measured: (i) the area of dots and aggregates, (ii) the length of the lines, (iii) the length and the radius of curvature of the arc assemblies, and (iv) the radius of the full rings (Fig 3D).
Figure EV3. Frequency of Bax assemblies in the cells.
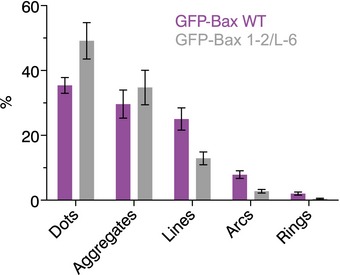
Quantification of the frequency of the different types of Bax assemblies in HeLa cells with respect to the total number of assemblies found in each condition (GFP‐Bax WT or GFP‐Bax mutant 1‐2/L‐6). Mean ± SEM of 14 independent cells for each condition.
Figure 3. Bax wild‐type adopts different structures compared to the inactive mutant Bax 1‐2/L‐6.
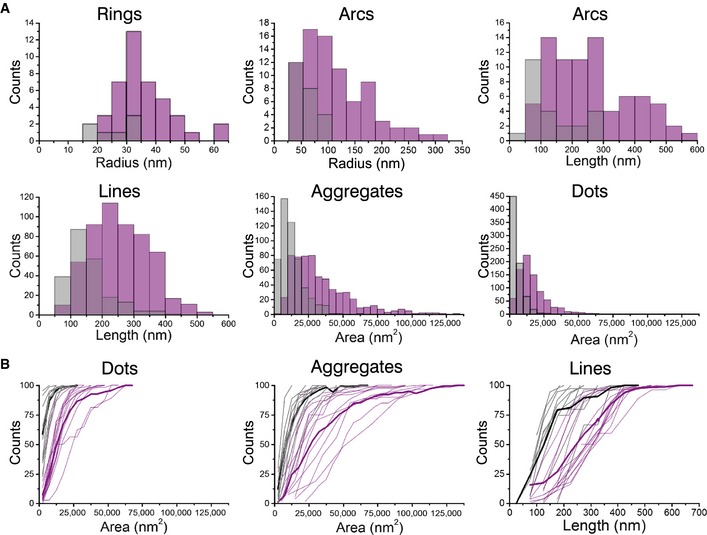
- Quantification of the structures found on Bax wild‐type (purple) and on Bax 1‐2/L‐6 (gray) overexpressing cells. Data show the total number of structures in all the measurements. n (Bax wild‐type) = 13, n (Bax 1‐2/L‐6) = 11.
- Cumulative distribution plots of GFP‐Bax wild‐type (purple) and GFP‐Bax 1‐2/L‐6 (gray) showing differences in amplitude and frequency. Each plot represents a single cell. Thick lines represent average cumulative distributions for all the single cells transfected with GFP‐Bax WT or mutant GFP‐Bax 1‐2/L‐6.
As GFP‐Bax 1‐2/L‐6 is reliant on efficient disulfide‐tethering in the reducing environment of the cytosol, we cannot discard that some of the structures and aggregates observed are due to incomplete linkage despite positive TRMRE staining. Nevertheless, and although the number of clear complete rings of GFP‐Bax WT molecules was lower than that of other structures, they were almost absent in the inactive mutant, which strongly supports their functional character (Figs 3A and EV3). Their radius followed a normal distribution centered on a diameter of 35 nm, in good agreement with Bax pores observed in liposomes (Bleicken et al, 2010). In the case of arc‐shaped assemblies, their length was broadly distributed and two peaks at approximately 100–300 and 400–500 nm could be distinguished for GFP‐Bax WT. Linear structures also followed a wide distribution in the case of GFP‐Bax WT with lengths centered at 200–250 nm. In contrast, the inactive mutant exhibited less and shorter arcs and lines. In agreement with Bax oligomerization during apoptosis, also undefined structures were larger for GFP‐Bax WT than for GFP‐Bax 1‐2/L‐6. In summary, these differences in the signal suggest that the defined structures detected in the case of GFP‐Bax WT are distinct from those of the inactive mutant and confirm that they are related to the functional role of Bax in MOM permeabilization during apoptosis.
Our quantification involved the total number of structures found in all measured cells together, but it is also important to consider cell‐to‐cell heterogeneities. To account for this, single cell cumulative distribution functions for structures including dots, aggregates, and lines were plotted. As shown in Fig 3B, mutant GFP‐Bax 1‐2/L‐6 cells displayed in all cases considerably smaller structures than the active protein. Besides, the cumulative distribution functions of individual cells corresponding to WT or mutant GFP‐Bax were similar and could be distinguished as two different populations. These results confirm that the structures analyzed in the images of wild‐type and mutant GFP‐Bax are significantly different from each other and comparable in the different cells analyzed for each of them.
In the case of GFP‐Bax structures organized as two lines or arcs parallel to each other (Fig 2C), we cannot discard their possible relevance in the molecular mechanism of Bax function at the MOM despite their low numbers. They have a defined shape and their size is comparable to the single lines. Indeed, these double structures, only detected in GFP‐Bax WT images, resembled the spiral assemblies proposed for the dynamin‐like protein Drp1 during mitochondrial fragmentation (Mears et al, 2011).
To rule out potential effects due to the presence of endogenous Bax and Bak in the HeLa cells transfected with GFP‐Bax, we also performed SMLM experiments in Bax/Bak double knockout HCT116 cells transfected with GFP‐Bax. In the absence of endogenous protein, we could also identify a significant fraction of non‐random GFP‐Bax structures including lines, double lines, arcs, and full rings of comparable sizes (Fig 4A and B). In addition, in order to corroborate that our results were not dependent on the sample preparation or imaging technique, we directly measured GFP‐Bax distribution (without staining with nanobodies) during apoptosis with an alternative super‐resolution method, stimulated emission depletion microscopy (STED). This technique has also showed improvements in resolution up to 60 nm for imaging of GFP‐labeled molecules (Willig et al, 2006; Rankin et al, 2011). As observed in Fig 4C, the images obtained with STED showed a substantial resolution increase compared to those acquired with diffraction‐limited imaging. This technique also revealed comparable non‐random assemblies of GFP‐Bax shaped as lines, arcs, rings, and even double lines (Fig 4D), supporting that the structures characterized with localization microscopy reflect the organization of Bax in apoptotic mitochondria.
Figure 4. Bax non‐random structures shown on HCT116 Bax/Bak−/− cells by SMLM and on HeLa cells by STED microscopy.
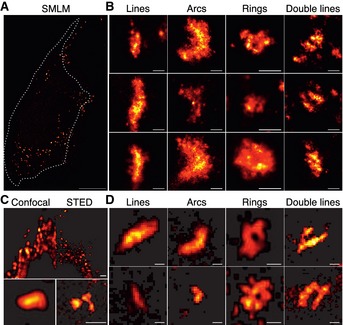
- Overview of a reconstructed super‐resolution image of GFP‐Bax‐overexpressing HCT116 Bax/Bak−/− cells stained with AF647‐anti‐GFP nanobodies. Image was acquired on fixed cells 7 h after apoptosis induction with STS. Dotted line shows the cell shape (see Fig EV2). Scale bar, 5 μm.
- Gallery of typical GFP‐Bax WT non‐random structures during apoptosis on HCT116 Bax/Bak−/− cells. Scale bars, 100 nm.
- Comparison of confocal (left) and STED (right) images of GFP‐Bax‐overexpressing HeLa cells 2 h after STS treatment. STED reveals a notable increase in resolution. Scale bars, 500 nm.
- Representative GFP‐Bax non‐random structures found with STED (lines, arcs, rings, double lines). Scale bars, 100 nm.
Finally, to check whether the appearance of non‐random Bax structures correlated with the opening of pores at the MOM, we analyzed the mitochondria of apoptotic HeLa cells transfected or not with GFP‐Bax using transmission electron microscopy (Fig 5). After 3 h of treatment with staurosporine, cells presented the typical apoptotic phenotype with swollen endoplasmic reticulum and reorganized mitochondrial cristae. In both cases, we detected events of MOM disruption, which exhibited sizes in the same order of magnitude as the Bax structures identified in the super‐resolution images. These pores or defects were absent in the MOM of control healthy HeLa cells. These results support the role of the non‐random structures of GFP‐Bax identified here in the formation of pores at the MOM of apoptotic cells.
Figure 5. Transmission electron microscopy reveals mitochondrial outer membrane pores on apoptotic cells.
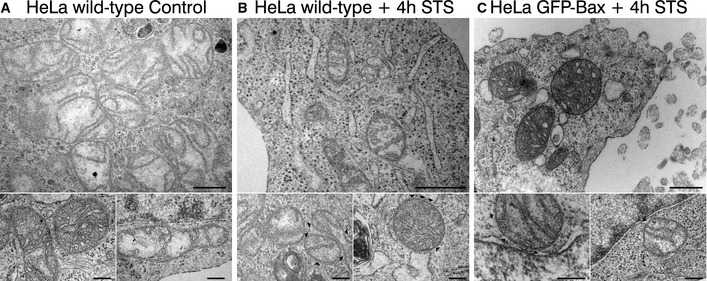
- Representative TEM pictures of HeLa wild‐type cells. Bottom panels show healthy mitochondria. Scale bars, 500 nm (overview) and 200 nm (zooms).
- Representative TEM pictures of apoptotic HeLa wild‐type cells 4 h after STS treatment (1 μM). Black arrowheads point to defects on the mitochondrial outer membrane. Scale bars, 500 nm (overview) and 200 nm (zooms).
- Representative TEM pictures of apoptotic HeLa GFP‐Bax‐transfected cells 4 h after STS treatment (1 μM). Black arrowheads point to defects on the mitochondrial outer membrane. Scale bars, 500 nm (overview) and 200 nm (zooms).
Bax shows a heterogeneous distribution at mitochondrial foci during apoptosis
To determine the position and orientation of GFP‐Bax structures on the MOM, we carried out dual‐color confocal and super‐resolution experiments. We first performed time series confocal imaging on HeLa cells co‐transfected with GFP‐Bax and mito‐dsRED (mitochondrial marker) following STS treatment. After approximately 1 h, Bax started to accumulate at discrete sites on mitochondria (Fig 6A). However, confocal microscopy cannot provide information about the structure or orientation of Bax assemblies on the membrane at the nanoscale. For this reason, we performed two‐color SMLM on HeLa cells transfected with GFP‐Bax, which were immunostained 3 h after apoptosis induction with AF647‐anti‐GFP nanobodies for Bax signal and CoxIV antibody (with CF680 as secondary antibody) as a mitochondrial marker. As an alternative to CoxIV imaging, we co‐transfected the cells with mMAPLE‐mito, a photo‐switchable fluorescent protein suitable for SMLM that acted as mitochondrial marker (Fig 6C).
Figure 6. Bax localizes heterogeneously to discrete mitochondrial foci during apoptosis.
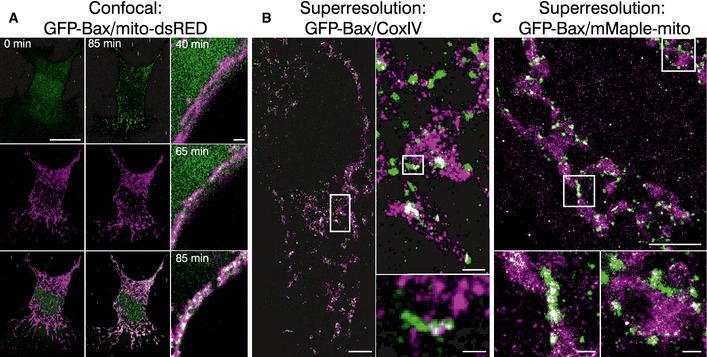
- Left panel shows the individual channels and overlaid images of confocal live cell imaging of HeLa cells overexpressing GFP‐Bax (green) and mito‐dsRed (magenta) at 0 and 85 min after apoptosis induction with STS 1 μM. Right panel shows zoomed overlaid images of HeLa cells following GFP‐Bax translocation (green) and mitochondrial fragmentation (magenta) during apoptosis induction with STS 1 μM. Scale bars, 10 μm (left) and 2 μm (right)
- Reconstructed dual‐color super‐resolution image of GFP‐Bax‐overexpressing HeLa cells. GFP‐Bax was imaged by immunostaining with AF647‐anti‐GFP nanobodies and mitochondria were immunostained with CoxIV (primary) and cf680 (secondary) antibodies. Image was acquired 3 h after STS treatment. Left panel shows the cell overview (scale bar, 5 μm), right panel up shows the overview inset (scale bar, 500 nm), and right panel down shows a non‐random linear GFP‐Bax assembly at mitochondria (scale bar, 100 nm).
- Reconstructed dual‐color super‐resolution image of HeLa cells co‐overexpressing mMaple‐mito and GFP‐Bax and stained with AF647‐anti‐GFP nanobodies. Image was acquired 3 h after STS treatment. Lower panel shows enlarged insets corresponding to the white rectangles in the upper panel. Scale bars, 1 μm (overview) and 100 nm (insets)
The images qualitatively showed that all GFP‐Bax signal appeared heterogeneously distributed in discrete foci on mitochondria in both cases, as expected. In particular, it localized along the mitochondrial tubules as well as on mitochondrial ends (Fig 6B and C). Non‐random arrangements corresponding to Bax assemblies could be distinguished in structures wrapping mitochondria, in addition to dots and aggregates (Fig 6B and C). When we examined whether the distribution of the non‐random assemblies of GFP‐Bax was detected preferentially at specific sites along the mitochondrial network, we did not observe any clear preference.
AFM demonstrates that both full rings and arc‐shaped assemblies of Bax perforate the membrane
To investigate whether the oligomeric arrangements of Bax detected in apoptotic cells by super‐resolution microscopy were related to pore formation, we performed experiments of atomic force microscopy (AFM). In addition to a high spatial resolution, this technique also provides information about the 3D topography of the membrane surface. For this purpose, we prepared supported lipid bilayers from proteoliposomes containing activated, membrane‐bound Bax and we analyzed them with AFM. In contrast to control samples, which exhibited largely flat membranes with few defects, the supported lipid bilayers containing activated Bax were rich in structures protruding 3.97 ± 1.02 nm from the membrane plane that corresponded to Bax clusters (Fig 7A and B). As in the super‐resolution microscopy experiments, Bax structures were also heterogeneous in size and shape. They also included lines, rings, and arc‐shaped arrangements of protein in addition to random dots and aggregates. For consistency, we performed the same structural analysis of the non‐random assemblies as with the super‐resolution images. As shown in Fig 7D, not only the size of the structures but also their distribution was in very good agreement with the SMLM results (Fig 3). This strongly suggests that the defined architectures detected in both cases were alike.
Figure 7. Full rings and arc‐shaped assemblies of Bax are associated with membrane pores, as visualized by AFM .
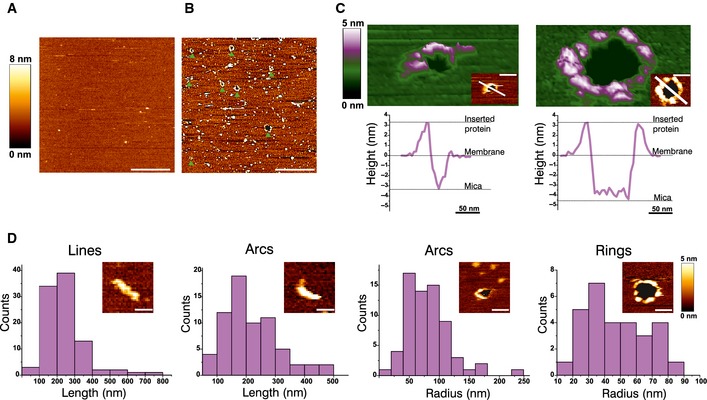
- AFM image of a control SLB prepared from LUVs with a mitochondrial‐like lipid composition. The bilayer looks flat, without aggregates or defects. Scale bar, 1 μm.
- AFM image of a SLB prepared from LUVs with a mitochondrial‐like lipid composition pre‐incubated with heat‐activated Bax. The green arrowheads indicate the presence of membrane pores, which are heterogeneous in size and shape. The edges of the pores present protrusions corresponding to Bax clusters. Scale bar, 1 μm.
- 3D AFM topography of a Bax arc (left) and ring (right). Both images reveal a circular dark hole that spans the lipid membrane (green). Bax molecules around the pore rim (magenta and white) protrude 3.97 ± 1.02 nm above the membrane plane, as confirmed by the height profiles shown below each image (corresponding to the white line in the 2D image insets). The topography of the arc structure reveals a pore only partially surrounded by Bax molecules, while lipids alone form the rest of the pore rim. Images are shown in a 42° tilted representation.
- Quantitative analysis of the distinct structures found for activated Bax on SLBs. Data show the total number of structures in all the measurements.
Importantly, we were able to visualize membrane pores associated with defined structures in the samples containing Bax (Fig 7B and C). These pores were also heterogeneous in size and shape, but generally round with diameters ranging from around 24 to 176 nm and appeared as steep depressions of 3.85 ± 0.47 nm with respect to the flat surface of the lipid bilayer, which fits well with the membrane thickness. They were characterized by the presence of higher structures corresponding to Bax molecules distributed along the pore rim. Concretely, 97% of complete rings that we could resolve contained a pore in the interior. In the case of arc‐shaped assemblies, 12% of them were also associated with membrane pores, where Bax molecules covered only a fraction of the pore rim and the rest corresponded to naked lipid bilayer. These results provide a functional link to the structures identified by super‐resolution microscopy and AFM.
Discussion
Here, we report the assembly of Bax oligomers into a distribution of rings and arc‐shaped arrangements in the mitochondria of apoptotic cells. Based on the ability of these structures to form pores in pure lipid bilayers, we propose a new molecular mechanism for Bax‐mediated MOM permeabilization during apoptosis.
We have studied the supra‐molecular structure of active Bax by two alternative super‐resolution techniques, SMLM and STED. In SMLM, only a portion of the fluorophores are stochastically activated at the same time and then precisely localized. After the accurate localization of all the molecules, the super‐resolution image can be reconstructed. The working principle of STED is different from SMLM: it is based on the overlay of a diffraction‐limited spot with a doughnut‐shaped laser which depletes the fluorescence everywhere in the focal region but in the very center of the spot (Hell & Wichmann, 1994). As a result, the fluorescence emission is confined to a very small region. The super‐resolution microscopy data showed a significant fraction of GFP‐Bax signal localized at discrete foci along mitochondria and organized into distinct architectures, classified as full rings, arcs, and lines. These were characterized by a wide distribution of sizes, with rings in the order of 50–100 nm in diameter. Consistent with their biological relevance, an inactive mutant version of Bax that is constitutively located at mitochondria adopted a significantly different organization. Moreover, we detected comparable structural arrangements of activated Bax using STED microscopy in apoptotic cells and in supported lipid bilayers using AFM imaging. The AFM images also showed that rings and a fraction of the arc assemblies appeared piercing the membrane. We cannot discard the presence of smaller Bax assemblies associated with pores that are below the resolution limit inherent to the techniques. This is around 20 nm for SMLM and between 20 and 45 nm for AFM under our specific experimental conditions (nominal tip radius of 20 nm). Our results demonstrate that lipids directly participate in the pore architectures formed by Bax and that the protein molecules may or not cover the full pore rim. To our knowledge, this is also the first direct evidence that Bax oligomers delineate membrane pores. Furthermore, these findings strongly suggest that the Bax structures identified at mitochondria are directly involved in MOM permeabilization via direct pore formation. Similar conclusions were drawn from independently performed STED experiments, which recently came to our attention (Große et al, 2016).
Our data reveal a non‐uniform organization of Bax oligomers at the MOM. Consistent with our results, Bax pores ranging from 3.5 to several hundreds of nanometers (Dewson et al, 2012, Czabotar et al, 2013), which allow 2‐MDa dextran particles to pass (Kuwana et al, 2002), as well as multiple types of Bax aggregates (Tan et al, 1999; Antonsson, 2001; Annis et al, 2005), have been previously described. Such heterogeneity is in contrast with results obtained for other pore‐forming proteins (Sonnen et al, 2014; Metkar et al, 2015) and precluded further modeling of the Bax pore structure by averaging approaches. Nevertheless, by overlapping scaled 3D structures of Bax dimers into the membrane pores in the AFM images (Fig EV4), we speculate a rough number of Bax molecules that could be lining a pore. Although these representations should be taken with care, the cartoons of two individual pores suggest that in the order of 8–10 Bax dimers might be sufficient to stabilize relatively large pores (around 100 nm), which would also be lined by lipids. The number of Bax dimers could be less in the case of smaller pores and pores lined by Bax arcs. Altogether, our findings argue in favor of a model by which Bax assembles into a flexible toroidal pore structure able to change in size depending on Bax density in the membrane (Bleicken et al, 2013a). This model would explain the different sizes of the pores and oligomers formed by Bax (Kuwana et al, 2002; Fuertes et al, 2010; Bleicken et al, 2013a), without discarding that additional proteins like Bak or other unknown factors, not detected here, could also be forming part of the pore structure.
Figure EV4. Cartoon of Bax proteins localization around full rings assemblies associated with membrane pores imaged by AFM.
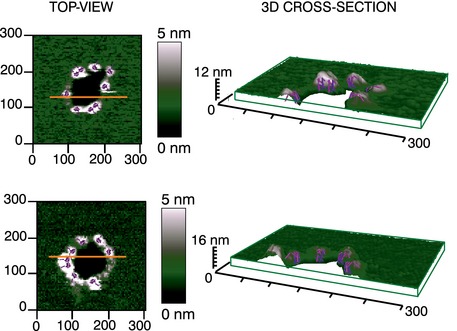
Top‐views and 3D cross sections of two representative pores detected by AFM in a SLB prepared from LUVs with a mitochondrial‐like lipid composition pre‐incubated with heat‐activated Bax, similar to the ones shown in Fig 6. The 3D cross section corresponds to the orange line in the top‐view image. Images in the 3D cross section are shown in a 69x, 4y, 30z tilted representation. The green box allows for a better visualization of the 3D representation and thickness of the bilayer. Both top‐view images reveal a circular dark hole that spans the lipid membrane (green). Dimers of Bax molecules (pink and purple sticks represent the two monomeric units, respectively), illustrated according to the clamp model (Bleicken et al, 2014), are displayed in scale around the rim of the pore in correspondence with the white‐gray protrusions from the AFM images. The placement of the dimeric units takes into account the best accommodation between the length of the dimer (reproduced in scale according to the 3D model in (Bleicken et al, 2014)) and the height profile of the protrusion (plus membrane thickness), and allows for a very rough estimate of the number of Bax dimers lining the pore, with 9 and 8 dimer units in the upper and lower images, respectively. This illustration does not account for the presence of side chains and water in the Bax dimer, which could contribute to the overall size of the complex, as well as for the AFM resolution limit of our pictures. Importantly, there is no scientific ground other than reasonable overlap behind the inclusion of the 3D structures of the Bax dimers in the AFM images, and therefore, this cartoon represen‐tation should be considered with care and as indicative only.
Most of the Bax signal detected with SMLM corresponded to random, undefined clusters, from which no specific molecular organization could be distinguished. This could be related to partial labeling with the nanobodies, insufficient spatial resolution due to out of focus effects, wrong orientation of the structure with respect to the observation plane, or simply no supra‐organization of a fraction of Bax oligomers at the nanometer scale.
Along these lines of reasoning, it is important to consider that the variety of defined Bax structures including lines, arcs, and rings could correspond to the same type of supramolecular organization observed from different angles or with different degrees of assembly. On the one hand, in the case of complete rings and arcs, only those which are observed perpendicular to the ring/arc plane would be detected as such in the two dimensional SMLM approach used here, while any other orientation would likely appear as a line, or less likely due to off‐focus blurring, as an ellipse or incomplete ellipse. Within the cell, the tubules of the mitochondrial network can adopt all possible orientations, where the longer tubes have a preference for those orientations best adapting to the cellular shape. As a result, it is unlikely that most of Bax rings and arcs would be detected and classified as such, which is in agreement with the lower frequency of these structures in comparison with lines. Besides, the length of lines and arcs is in the same range as the diameter of the full rings, taking into account the variations in the size of the different structures observed, which would also support this possibility. On the other hand, lines, arcs, and rings could represent different stages in the assembly of nascent evolving Bax pores. In this scenario, Bax molecules would first organize into linear and arc‐shaped structures and some of them would evolve into complete rings. It could also be that lines and arcs correspond to kinetically trapped intermediates in the process of full ring assembly. Interestingly, the AFM data in supported bilayers, where both rings and arc‐shaped assemblies of Bax coexist with the same orientation with respect to the membrane plane and are involved in pore formation, demonstrate the existence of lines, arcs, and rings as distinct structures of Bax oligomers. Nevertheless, both situations are not mutually exclusive, and it is conceivable that the structures detected in apoptotic mitochondria correspond to a mixture of different assembly stages observed from different orientations.
Our finding that not only full rings but also arc‐shaped Bax assemblies form membrane pores has unanticipated implications for the molecular mechanism how Bax permeabilizes the MOM in apoptosis (Fig 8). Stabilization of toroidal pores requires a decrease in the line tension associated with the extremely high membrane curvature generated at the pore edge (Karatekin et al, 2003). In agreement with this, a peptide derived from helix 5 of Bax, which reproduces the pore activity of the full‐length protein, is able to reduce line tension at interfaces with high curvature stress (García‐Sáez et al, 2005, 2007). In this scenario, both full and partial coverage of the pore boundary by protein molecules could provide enough line tension reduction to stabilize the open pore state. Recent studies with pore‐forming toxins of the membrane attack complex/perforin/cholesterol‐dependent cytolysin superfamily, which also form toroidal pores but based on β‐structural elements, report the involvement of both complete rings as well as arc‐shaped oligomeric assemblies in pore formation (Gilbert et al, 2014; Leung et al, 2014; Sonnen et al, 2014; Metkar et al, 2015; Stewart et al, 2015). Incomplete coverage of the pore rim has also been observed for Bax monomers in lipid nanodisks (Xu et al, 2013). Based on this, we propose that the physical–chemical principle by which Bax stabilizes membrane pores is not by building a poly‐peptide wall that buries the hydrophobic membrane core, but rather by releasing the curvature stress at the membrane edge (Ros & García‐Sáez, 2015).
Figure 8. Model for the supramolecular organization of Bax at the MOM during apoptosis.

- Illustration of the possible roles for the Bax non‐random assemblies revealed by SMLM and AFM during apoptosis. Linear and arc clusters not perforating the membrane could correspond to Bax at initial stages of gathering on healthy mitochondria. They would evolve toward opening of membrane pores, where the protein is covering completely (full rings) or partially (arcs) the pore rim. We cannot exclude that a fraction of the linear and arc‐shaped assemblies correspond to Bax pores observed from different perspectives. The number of red spheres (Bax dimers) is illustrative and does not need to correlate with the actual number present in the structures.
- The mechanism by which Bax permeabilizes the membrane is mainly by releasing the curvature stress at the membrane edge. Full as well as partial coverage of the pore rim by Bax molecules could reduce line tension enough to stabilize the open pore state. The illustration shows an incomplete ring assembly of active Bax dimers adopting a clamp‐like structure at the pore interface (Bleicken et al, 2014).
The set of architectures of Bax oligomers in apoptotic mitochondria and their relationship to pore formation demonstrated here support a new molecular mechanism of Bax during apoptosis (Fig 8). Upon activation, Bax would accumulate in mitochondria, where it would undergo a conformational change accompanied by extensive membrane insertion (García‐Sáez et al, 2004; Annis et al, 2005). Bax molecules would then stably associate via their dimerization domain (Dewson et al, 2008, 2012; Bleicken et al, 2010, 2014; Zhang et al, 2010; Czabotar et al, 2013; Aluvila et al, 2014; Subburaj et al, 2015) and continue to self‐assemble into larger oligomers, which might contain Bak or other MOM proteins (Zhou & Chang, 2008). These oligomers would initially organize as linear and arc‐shaped structures, some of which would induce the opening of MOM pores responsible for the release of the apoptotic factors (Fig 8A). In order to stabilize these pores, Bax oligomers would partially delineate the pore edge in a “clamp” conformation (Bleicken et al, 2014) (Fig 8B). Incorporation of additional Bax molecules into the pore structures would then lead to the formation of full Bax rings and to pore growth.
In summary, here we report the supramolecular organization of Bax oligomers at mitochondria of apoptotic cells with unprecedented detail. We identify complete rings as well as arc‐shaped and linear assemblies that are characteristic of functional Bax. We also show that both rings and arcs of Bax oligomers have the ability to perforate membranes, which links these structures with Bax function. Altogether, our results reveal an unanticipated molecular mechanism by which Bax mediates MOM permeabilization during apoptosis.
Materials and Methods
Cell culture and transfection
HeLa cells were maintained in Dulbecco's modified Eagle's medium (DMEM) (Invitrogen, Germany) and HCT116 Bax/Bak−/− cells in McCoy′s 5 A medium, both supplemented with 10% fetal bovine serum (FBS) (Invitrogen) and 1% penicillin/streptomycin (Invitrogen, Germany). Cells were transfected with Lipofectamine 2000 at 70–80% confluence. Cells were incubated with 100 ng DNA and 0.5 μl Lipofectamine 2000 per well in a glass bottom 8‐well μ‐slide (IBIDI) during 12 h for confocal imaging (6 h with GFP‐Bax 1‐2/L‐6). For cell fractionation, cells were cultured in 15‐cm dishes and transfected with 10 μg DNA and 5 μl Lipofectamine 2000 (HeLa) or 10 μg DNA and 12 μl Turbofect (HCT116). The construct GFP‐Bax was a generous gift from Dr. Nathan Brady (DKFZ, Heidelberg); GFP‐Bax 1‐2/L‐6 was kindly given by Dr. Frank Edlich (Institute for Biochemistry and Molecular Biology, University of Freiburg) (Edlich et al, 2011). For mitochondrial staining, cells were incubated with 100 nM MitoTracker Red or TMRE (Life Technologies, Germany) for 30 min. Apoptosis was induced with 1 μM of staurosporine (Sigma, Germany).
Confocal live cell imaging
After transfection in a glass bottom 8‐well μ‐slide (IBIDI, Germany) and staurosporine induction, cells were maintained in phenol red‐free DMEM at 37°C and 5% CO2 for imaging. Acquisition was made with a Zeiss LSM 710 ConfoCor3 microscope (Carl Zeiss, Jena, Germany) equipped with a temperature and CO2 using a C‐Apochromat ×40 N.A. 1.2 water immersion objective (Zeiss). Excitation light came from argon ion (488 nm) or HeNe (561 nm) lasers. Images were processed with FiJi.
Cell fractionation and protein cross‐linking
Cells were grown on dishes, transfected with GFP‐Bax as described above, trypsinized, and washed with PBS. For total protein extraction, cell pellet was resuspended in ice‐cold RIPA buffer (150 mM sodium chloride, 1.0% Triton X‐100, 0.5% sodium deoxycholate, 0.1% SDS, 50 mM Tris, pH 8.0), incubated for 30 min on ice, and centrifuged at 21,000 g for 30 min. Supernatant was collected and boiled for 5 min in 6× sample loading buffer. For mitochondrial protein extraction, cell pellet was resuspended in mitochondrial isolation buffer (MB) (210 mM mannitol, 70 mM sucrose, 1 mM EDTA, 10 mM Hepes pH 7.4) and homogenized in a teflon douncer for 100 strokes (cell integrity was checked by trypan blue dye). The samples were centrifuged at 800 × g for 10 min several times (until no pellet was visible). Supernatant was collected and centrifuged at 10,000 × g for 10 min to pellet the mitochondrial fraction. Mitochondria were resuspended in MB Buffer and post‐mitochondrial supernatant was centrifuged at 100,000 × g for 60 min to obtain the cytosolic fraction. Mitochondrial and cytosolic extracts were boiled for 5 min in 6× sample loading buffer and processed for electrophoresis and Western blotting. For the cross‐linking assay, purified mitochondria were incubated with BMH (10 mM final concentration, added from a 50× BMH stock solution in DMSO) at RT for 45 min under gentle agitation. BMH was then quenched in 0.5 M DTT in MB buffer for 15 min at RT.
Mitochondria were centrifuged at 9,000 × g, and mitochondrial pellet was resuspended and washed twice in MB Buffer. Mitochondria were then boiled in 6× sample loading buffer and processed for electrophoresis in 10% acrylamide gels and Western blotting.
Western Blot
Discontinuous SDS–PAGE was performed according to Laemmli in 10% acrylamide gels. Proteins were transferred onto a PVDF membrane (Millipore, no. ISEQ07850) using a semi‐dry Turbo‐blot apparatus (Bio‐Rad). The membrane was blocked with 5% milk in 1× TBST at RT for 1 h and incubated at 4°C overnight with the appropriate antibody in a ratio of 1:1,000 (Bax (Cell Signaling #2772S), Actin (Millipore #691001), VDAC (Abcam #14734)). After washing with 1× TBST, the secondary antibody was added in a ratio of 1:10,000 in 5% milk and incubated from 1 h at RT. Membrane was washed with 1× TBST, and the immunoreactive bands were visualized by ECL chemiluminescence (WESTERN LIGHTNING™ Plus‐ECL, PerkinElmer).
STED microscopy
Cells were grown on 15‐mm round glass coverslips for 24 h to 70–80% confluency, transfected, and fixed with 4% paraformaldehyde (PFA) in PBS for 15 min at room temperature. After washing 3× with PBS, coverslips were mounted on slides with Mowiol and dried overnight.
For measurements with the STED microscope, a pulsed diode laser operating at 485 nm (LDH‐P‐C‐485 PicoQuant GmbH, Germany) and a pulsed raman fiber laser operating at 560 nm (PRFL Series, MPB Communication Inc., Canada) were used for excitation and stimulated emission, respectively. The STED beam is spatially formed to a doughnut by a vortex phase plate (VPP‐2, RPC Photonics, USA). On a long‐pass filter (BLP01‐561, Semrock Inc., USA), both excitation and STED beam are overlaid and coupled to the microscope stand (Leica Microsystems, Germany) utilizing an 100× oil objective (1.4NA, HCX PL APO, Leica Microsystems, Germany). Four galvanometer mirrors (6210H, Cambridge Technologies, USA) scan the image field. The fluorescence is separated on a band‐pass filter (ET525/50M, Chroma Technology Corp., USA) and guided to a hybrid photodetector (R10467U‐40 Hamamatsu Cooperations, Japan). A FPGA‐based software controls the hardware and the data acquisition. Export of the raw data into tiff‐Files and the Gaussian filtering was done with ImSpector® Image Acquisition & Analysis Software v0.10 (http://www.imspector.de).
Single‐molecule localization microscopy
Cells were grown on 24‐mm round glass coverslips for 24 h to 70–80% confluency, transfected, and fixed in 4% PFA in PBS for 15 min at room temperature. Coverslips were then incubated for 15 min in PBS with 50 mM NH4Cl and permeabilized in PBS with 0.25% Triton X‐100 for 5 min. Cells were washed 3× for 5 min in PBS and blocked for 45 min in PBS with 1% BSA. Labeling was done with AF647‐anti‐GFP nanobodies (1/2,000) and anti‐CoxIV (1/50) primary antibodies (Cell Signaling, #11967) in 1% BSA for 90 min. After extensive washes with PBS, coverslips stained for CoxIV were incubated for 30 min at room temperature with CF680 anti‐mouse secondary antibodies (1:500 in 1% BSA). Samples were mounted and imaged in a custom‐made microscope (Schoen et al, 2011) and covered with 300 μl of imaging buffer (50 mM Tris‐HCl pH 8, 10 mM NaCl, 10% (v/w) glucose, 35 mM cysteamine (MEA), 0.5 mg/ml glucose oxidase (Sigma), and 40 μg/ml catalase (Sigma)). We used an exposure time of 15 ms for single color and 30 s for dual‐color measurements and an EM gain of 100. Imaging laser intensity at 640 nm was 2.5 kW/cm2, and the 405‐nm activation laser intensity was automatically adjusted to keep a constant number of localizations per frame. Typically 70,000–100,000 frames were recorded. Analysis was performed using a custom Matlab script. Localizations with uncertainties above 15 nm were discarded. Images were rendered using a Gaussian with a width according to the localization precision. Image analysis of the random and non‐random structures was done with ImageJ. Histogram bin number for GFP‐Bax structures was determined by the square root of the number of events. For clarity, the same bin width was used for GFP‐Bax‐1‐2/L‐6 structures despite the lower number of events.
Transmission electron microscopy
Cells were scrubbed from cell culture dishes, fixed for 1 h at 4°C in glutaraldehyde (2% solution in 0.1 M cacodylate buffer pH 7.4), and very carefully centrifuged (300 rpm for 30 s). Cell precipitate was imbedded in 3% agarose. Cell agarose block was cut in small pieces (1.5 mm × 3 mm) and washed with cacodylate buffer followed by postfixing with 1% osmium tetroxide in 0.1‐M cacodylate buffer. Dehydration was then started by a series of incubations in 30%, 50%, and 70% ethanol. The samples were stained with saturated uranyl acetate. Dehydration was continued by incubations in 70%, 80%, and 96% ethanol, absolute ethanol, and propylene oxide. Each cell agarose block was then embedded in Epon.
Ultrathin sections (70 nm) were made, stained with lead citrate, and observed under an electron microscope (model 900; Carl Zeiss, Oberkochen, Germany).
Atomic force microscopy
Full‐length human Bax was expressed in Escherichia coli and purified according to Bleicken et al (2010). Protein quality and activity was checked as in Bleicken et al (2010). L‐α‐phosphatidylcholine from egg (EPC), L‐α‐phosphatidylethanolamine (PE), L‐α‐phosphatidylinositol from bovine liver (PI), phosphatidylserine from brain (PS), and cardiolipin (CL) from bovine heart were purchased from Avanti Polar Lipids (Alabaster, AL). Lipids were mixed in the ratio 48.5:27.2:9.9:10.0:4.4 mol % (EPC:PE:PI:PS:CL, respectively) to approximate the composition of the mitochondrial outer membrane (MitoMix), as in Bleicken et al (2012).
Supported lipid bilayers (SLBs) were prepared as in Unsay et al (2013). Briefly, lipid mixtures were rehydrated to a final concentration of 0.6 mg/ml in SLB buffer (150 mM NaCl, 10 mM HEPES, pH 7.4). Large unilamellar vesicles (LUV) were obtained by extrusion through a polycarbonate membrane with 200‐nm pore size. In order to obtain proteoliposomes, LUVs were pre‐incubated for 1 h with heat‐activated Bax (50 or 100 nM at 43°C). The liposome or proteoliposome solution was put in contact with freshly cleaved mica previously glued to a coverslip. CaCl2 was added to a final concentration of 3 mM and incubated at 37°C for 2 min. The samples were rinsed several times with SLB buffer to remove CaCl2 and unfused vesicles, and then allowed to equilibrate at room temperature before analysis.
Supported lipid bilayers were imaged using a JPK NanoWizard II system (JPK Instruments, Berlin, Germany) mounted on an Axiovert 200 Inverted Microscope (Carl Zeiss). Intermittent contact (IC or tapping) mode images were taken using V‐shaped silicon nitride cantilevers with a typical spring constant of 0.08 N/m. The cantilever oscillation was tuned to a frequency between 3 and 10 kHz, and the amplitude was set between 0.2 and 1 V. The amplitude was varied during the experiment to minimize the force of the tip on the bilayer. The scan rate was set to 0.5–1 Hz. Images were processed by the JPK processing software, applying a smoothing function. Bilayer thickness was measured based on the height profiles from the mica (membrane defects or pores) to the membrane bulk. The height of the structures around the pores was measured based on the height profile from the membrane bulk.
Author contributions
RS‐G performed experiments and analyzed data. MM and JS performed experiments of super‐resolution microscopy and analyzed data. KC performed the AFM experiments and analyzed data, with the help of JU. US performed the EM experiments. JE supervised STED experiments. JR helped with SMLM experiments and data analysis. AJG‐S conceived the project and supervised research. AJG‐S and RS‐G wrote the manuscript with the help of all other authors.
Conflict of interest
The authors declare that they have no conflict of interest.
Supporting information
Expanded View Figures PDF
Review Process File
Acknowledgements
We thank B. Liebler for technical assistance and N. Brady and F. Edlich for providing the plasmids for GFP‐Bax WT and GFP‐Bax‐1‐2/L‐6, respectively. We thank Dr. Frank Essmann and Prof. Klaus Schulze‐Osthoff for providing the Bax/Bak DKO HCT116 cells. This work was funded by the European Research Council (ERC‐2012‐StG 309966), the Max Planck Society, the German Cancer Research Center, the Deutsche Forschungsgemeinschaft (FOR 2036), the European Molecular Biology Laboratory (M. M., J. R.), and the EMBL International PhD Programme (M. M.).
The EMBO Journal (2016) 35: 389–401
See also: G Dewson (February 2016) and
L Große et al (February 2016)
References
- Aluvila S, Mandal T, Hustedt E, Fajer P, Choe JY, Oh KJ (2014) Organization of the mitochondrial apoptotic BAK pore: oligomerization of the BAK homodimers. J Biol Chem 289: 2537–2551 [DOI] [PMC free article] [PubMed] [Google Scholar]
- Annis MG, Soucie EL, Dlugosz PJ, Cruz‐Aguado JA, Penn LZ, Leber B, Andrews DW (2005) Bax forms multispanning monomers that oligomerize to permeabilize membranes during apoptosis. EMBO J 24: 2096–2103 [DOI] [PMC free article] [PubMed] [Google Scholar]
- Antonsson B (2001) Bax and other pro‐apoptotic Bcl‐2 family “killer‐proteins” and their victim the mitochondrion. Cell Tissue Res 306: 347–361 [DOI] [PubMed] [Google Scholar]
- Antonsson B, Montessuit S, Lauper S, Eskes R, Martinou JC (2000) Bax oligomerization is required for channel‐forming activity in liposomes and to trigger cytochrome c release from mitochondria. Biochem J 345(Pt 2): 271–278 [PMC free article] [PubMed] [Google Scholar]
- Basanez G, Sharpe JC, Galanis J, Brandt TB, Hardwick JM, Zimmerberg J (2002) Bax‐type apoptotic proteins porate pure lipid bilayers through a mechanism sensitive to intrinsic monolayer curvature. J Biol Chem 277: 49360–49365 [DOI] [PubMed] [Google Scholar]
- Bleicken S, Classen M, Padmavathi PVL, Ishikawa T, Zeth K, Steinhoff H‐J, Bordignon E (2010) Molecular details of Bax activation, oligomerization, and membrane insertion. J Biol Chem 285: 6636–6647 [DOI] [PMC free article] [PubMed] [Google Scholar]
- Bleicken S, García‐Sáez AJ, Conte E, Bordignon E (2012) Dynamic interaction of cBid with detergents, liposomes and mitochondria. PLoS One 7: e35910 [DOI] [PMC free article] [PubMed] [Google Scholar]
- Bleicken S, Jeschke G, Stegmueller C, Salvador‐Gallego R, García‐Sáez Ana J, Bordignon E (2014) Structural model of active bax at the membrane. Mol Cell 56: 496–505 [DOI] [PMC free article] [PubMed] [Google Scholar]
- Bleicken S, Landeta O, Landajuela A, Basañez G, García‐Sáez AJ (2013a) Proapoptotic Bax and Bak proteins form stable protein‐permeable pores of tunable size. J Biol Chem 288: 33241–33252 [DOI] [PMC free article] [PubMed] [Google Scholar]
- Bleicken S, Wagner C, García‐Sáez AJ (2013b) Mechanistic differences in the membrane activity of Bax and Bcl‐xL correlate with their opposing roles in apoptosis. Biophys J 104: 421–431 [DOI] [PMC free article] [PubMed] [Google Scholar]
- Czabotar PE, Westphal D, Dewson G, Ma S, Hockings C, Fairlie WD, Lee EF, Yao S, Robin AY, Smith BJ, Huang DCS, Kluck RM, Adams JM, Colman PM (2013) Bax crystal structures reveal how BH3 domains activate Bax and nucleate its oligomerization to induce apoptosis. Cell 152: 519–531 [DOI] [PubMed] [Google Scholar]
- Dewson G, Kratina T, Sim HW, Puthalakath H, Adams JM, Colman PM, Kluck RM (2008) To trigger apoptosis, Bak exposes its BH3 domain and homodimerizes via BH3: groove interactions. Mol Cell 30: 369–380 [DOI] [PubMed] [Google Scholar]
- Dewson G, Ma S, Frederick P, Hockings C, Tan I, Kratina T, Kluck RM (2012) Bax dimerizes via a symmetric BH3:groove interface during apoptosis. Cell Death Differ 19: 661–670 [DOI] [PMC free article] [PubMed] [Google Scholar]
- Düssmann H, Rehm M, Concannon CG, Anguissola S, Würstle M, Kacmar S, Völler P, Huber HJ, Prehn JHM (2010) Single‐cell quantification of Bax activation and mathematical modelling suggest pore formation on minimal mitochondrial Bax accumulation. Cell Death Differ 17: 278–290 [DOI] [PubMed] [Google Scholar]
- Edlich F, Banerjee S, Suzuki M, Cleland MM, Arnoult D, Wang C, Neutzner A, Tjandra N, Youle RJ (2011) Bcl‐x(L) retrotranslocates Bax from the mitochondria into the cytosol. Cell 145: 104–116 [DOI] [PMC free article] [PubMed] [Google Scholar]
- Fuertes G, Garcia‐Saez AJ, Esteban‐Martin S, Gimenez D, Sanchez‐Munoz OL, Schwille P, Salgado J (2010) Pores formed by Baxalpha5 relax to a smaller size and keep at equilibrium. Biophys J 99: 2917–2925 [DOI] [PMC free article] [PubMed] [Google Scholar]
- García‐Sáez AJ (2012) The secrets of the Bcl‐2 family. Cell Death Differ 19: 1733–1740 [DOI] [PMC free article] [PubMed] [Google Scholar]
- García‐Sáez AJ, Chiantia S, Salgado J, Schwille P (2007) Pore formation by a Bax‐derived peptide: effect on the line tension of the membrane probed by AFM. Biophys J 93: 103–112 [DOI] [PMC free article] [PubMed] [Google Scholar]
- García‐Sáez AJ, Coraiola M, Dalla Serra M, Mingarro I, Menestrina G, Salgado J (2005) Peptides derived from apoptotic Bax and Bid reproduce the poration activity of the parent full‐length proteins. Biophys J 88: 3976–3990 [DOI] [PMC free article] [PubMed] [Google Scholar]
- García‐Sáez AJ, Mingarro I, Pérez‐Payá E, Salgado J (2004) Membrane‐insertion fragments of Bcl‐xL, Bax, and Bid. Biochemistry 43: 10930–10943 [DOI] [PubMed] [Google Scholar]
- Gilbert RJC, Serra MD, Froelich CJ, Wallace MI, Anderluh G (2014) Membrane pore formation at protein–lipid interfaces. Trends Biochem Sci 39: 510–516 [DOI] [PubMed] [Google Scholar]
- Große L, Wurm CA, Brüser C, Neumann D, Jans DC, Jakobs S (2016) Bax assembles into large ring‐like structures remodeling the mitochondrial outer membrane in apoptosis. EMBO J 35: 402–413 [DOI] [PMC free article] [PubMed] [Google Scholar]
- Hell SW, Wichmann J (1994) Breaking the diffraction resolution limit by stimulated emission: stimulated‐emission‐depletion fluorescence microscopy. Opt Lett 19: 780–782 [DOI] [PubMed] [Google Scholar]
- Karatekin E, Sandre O, Guitouni H, Borghi N, Puech P‐H, Fß Brochard‐Wyart (2003) Cascades of transient pores in giant vesicles: line tension and transport. Biophys J 84: 1734–1749 [DOI] [PMC free article] [PubMed] [Google Scholar]
- Kuwana T, Mackey MR, Perkins G, Ellisman MH, Latterich M, Schneiter R, Green DR, Newmeyer DD (2002) Bid, Bax, and lipids cooperate to form supramolecular openings in the outer mitochondrial membrane. Cell 111: 331–342 [DOI] [PubMed] [Google Scholar]
- Leung C, Dudkina NV, Lukoyanova N, Hodel AW, Farabella I, Pandurangan AP, Jahan N, Pires Damaso M, Osmanović D, Reboul CF, Dunstone MA, Andrew PW, Lonnen R, Topf M, Saibil HR, Hoogenboom BW (2014) Stepwise visualization of membrane pore formation by suilysin, a bacterial cholesterol‐dependent cytolysin. eLife 3: e04247 [DOI] [PMC free article] [PubMed] [Google Scholar]
- Lindsten T, Ross AJ, King A, Zong WX, Rathmell JC, Shiels HA, Ulrich E, Waymire KG, Mahar P, Frauwirth K, Chen Y, Wei M, Eng VM, Adelman DM, Simon MC, Ma A, Golden JA, Evan G, Korsmeyer SJ, MacGregor GR et al (2000) The combined functions of proapoptotic Bcl‐2 family members bak and bax are essential for normal development of multiple tissues. Mol Cell 6: 1389–1399 [DOI] [PMC free article] [PubMed] [Google Scholar]
- Lovell JF, Billen LP, Bindner S, Shamas‐Din A, Fradin C, Leber B, Andrews DW (2008) Membrane binding by tBid initiates an ordered series of events culminating in membrane permeabilization by Bax. Cell 135: 1074–1084 [DOI] [PubMed] [Google Scholar]
- Mears JA, Lackner LL, Fang S, Ingerman E, Nunnari J, Hinshaw JE (2011) Conformational changes in Dnm1 support a contractile mechanism for mitochondrial fission. Nat Struct Mol Biol 18: 20–26 [DOI] [PMC free article] [PubMed] [Google Scholar]
- Metkar SS, Marchioretto M, Antonini V, Lunelli L, Wang B, Gilbert RJ, Anderluh G, Roth R, Pooga M, Pardo J, Heuser JE, Serra MD, Froelich CJ (2015) Perforin oligomers form arcs in cellular membranes: a locus for intracellular delivery of granzymes. Cell Death Differ 22: 74–85 [DOI] [PMC free article] [PubMed] [Google Scholar]
- Munoz‐Pinedo C, Guio‐Carrion A, Goldstein JC, Fitzgerald P, Newmeyer DD, Green DR (2006) Different mitochondrial intermembrane space proteins are released during apoptosis in a manner that is coordinately initiated but can vary in duration. Proc Natl Acad Sci USA 103: 11573–11578 [DOI] [PMC free article] [PubMed] [Google Scholar]
- Rankin BR, Moneron G, Wurm CA, Nelson JC, Walter A, Schwarzer D, Schroeder J, Colon‐Ramos DA, Hell SW (2011) Nanoscopy in a living multicellular organism expressing GFP. Biophys J 100: L63–L65 [DOI] [PMC free article] [PubMed] [Google Scholar]
- Ries J, Kaplan C, Platonova E, Eghlidi H, Ewers H (2012) A simple, versatile method for GFP‐based super‐resolution microscopy via nanobodies. Nat Methods 9: 582–584 [DOI] [PubMed] [Google Scholar]
- Ros U, García‐Sáez AJ (2015) More than a pore: the interplay of pore‐forming proteins and lipid membranes. J Membr Biol 248: 545–561 [DOI] [PubMed] [Google Scholar]
- Rothbauer U, Zolghadr K, Tillib S, Nowak D, Schermelleh L, Gahl A, Backmann N, Conrath K, Muyldermans S, Cardoso MC, Leonhardt H (2006) Targeting and tracing antigens in live cells with fluorescent nanobodies. Nat Methods 3: 887–889 [DOI] [PubMed] [Google Scholar]
- Schoen I, Ries J, Klotzsch E, Ewers H, Vogel V (2011) Binding‐activated localization microscopy of DNA structures. Nano Lett 11: 4008–4011 [DOI] [PubMed] [Google Scholar]
- Sonnen AF, Plitzko JM, Gilbert RJ (2014) Incomplete pneumolysin oligomers form membrane pores. Open Biol 4: 140044 [DOI] [PMC free article] [PubMed] [Google Scholar]
- Stewart SE, D'Angelo ME, Piantavigna S, Tabor RF, Martin LL, Bird PI (2015) Assembly of streptolysin O pores assessed by quartz crystal microbalance and atomic force microscopy provides evidence for the formation of anchored but incomplete oligomers. Biochim Biophys Acta 1848: 115–126 [DOI] [PubMed] [Google Scholar]
- Subburaj Y, Cosentino K, Axmann M, Pedrueza‐Villalmanzo E, Hermann E, Bleicken S, Spatz J, Garcia‐Saez AJ (2015) Bax monomers form dimer units in the membrane that further self‐assemble into multiple oligomeric species. Nat Commun 6: 8042 [DOI] [PMC free article] [PubMed] [Google Scholar]
- Suzuki M, Youle RJ, Tjandra N (2000) Structure of Bax: coregulation of dimer formation and intracellular localization. Cell 103: 645–654 [DOI] [PubMed] [Google Scholar]
- Tan YJ, Beerheide W, Ting AE (1999) Biophysical characterization of the oligomeric state of Bax and its complex formation with Bcl‐XL. Biochem Biophys Res Commun 255: 334–339 [DOI] [PubMed] [Google Scholar]
- Unsay JD, Cosentino K, Subburaj Y, García‐Sáez AJ (2013) Cardiolipin effects on membrane structure and dynamics. Langmuir 29: 15878–15887 [DOI] [PubMed] [Google Scholar]
- Wei MC, Zong WX, Cheng EHY, Lindsten T, Panoutsakopoulou V, Ross AJ, Roth KA, MacCregor GR, Thompson CB, Korsmeyer SJ (2001) Proapoptotic BAX and BAK: a requisite gateway to mitochondrial dysfunction and death. Science 292: 727–730 [DOI] [PMC free article] [PubMed] [Google Scholar]
- Willig KI, Kellner RR, Medda R, Hein B, Jakobs S, Hell SW (2006) Nanoscale resolution in GFP‐based microscopy. Nat Methods 3: 721–723 [DOI] [PubMed] [Google Scholar]
- Wolter KG, Hsu YT, Smith CL, Nechushtan A, Xi XG, Youle RJ (1997) Movement of Bax from the cytosol to mitochondria during apoptosis. J Cell Biol 139: 1281–1292 [DOI] [PMC free article] [PubMed] [Google Scholar]
- Xia X, Owen MS, Lee RE, Gaudet S (2014) Cell‐to‐cell variability in cell death: can systems biology help us make sense of it all? Cell Death Dis 5: e1261 [DOI] [PMC free article] [PubMed] [Google Scholar]
- Xu XP, Zhai D, Kim E, Swift M, Reed JC, Volkmann N, Hanein D (2013) Three‐dimensional structure of Bax‐mediated pores in membrane bilayers. Cell Death Dis 4: e683 [DOI] [PMC free article] [PubMed] [Google Scholar]
- Zhang Z, Zhu W, Lapolla SM, Miao Y, Shao Y, Falcone M, Boreham D, McFarlane N, Ding J, Johnson AE, Zhang XC, Andrews DW, Lin J (2010) Bax forms an oligomer via separate, yet interdependent, surfaces. J Biol Chem 285: 17614–17627 [DOI] [PMC free article] [PubMed] [Google Scholar]
- Zhou L, Chang DC (2008) Dynamics and structure of the Bax‐Bak complex responsible for releasing mitochondrial proteins during apoptosis. J Cell Sci 121: 2186–2196 [DOI] [PubMed] [Google Scholar]
Associated Data
This section collects any data citations, data availability statements, or supplementary materials included in this article.
Supplementary Materials
Expanded View Figures PDF
Review Process File


