

ABSTRACT
BACKGROUND
Whole brain atrophy is a putative outcome measure in monitoring relapsing‐remitting multiple sclerosis (RRMS). With the ongoing MRI transformation from 1.5T to 3T, there is an unmet need to calibrate this change. We evaluated brain parenchymal volumes (BPVs) from 1.5T versus 3T in MS and normal controls (NC).
METHODS
We studied MS [n = 26, age (mean, range) 43 (21‐55), 22 (85%) RRMS, Expanded Disability Status Scale (EDSS) 1.98 (0‐6.5), timed 25 foot walk (T25FW) 5.95 (3.2‐33.0 seconds)] and NC [n = 9, age 45 (31‐53)]. Subjects underwent 1.5T (Phillips) and 3T (GE) 3‐dimensional T1‐weighted scans to derive normalized BPV from an automated SIENAX pipeline. Neuropsychological testing was according to consensus panel recommendations.
RESULTS
BPV‐1.5T was higher than BPV‐3T [mean (95% CI) + 45.7 mL (+35.3, +56.1), P < .00001], most likely due to improved tissue‐CSF contrast at 3T. BPV‐3T showed a larger volume decrease and larger effect size in detecting brain atrophy in MS versus NC [−74.5 mL (−126.5, −22.5), P = .006, d = .92] when compared to BPV‐1.5T [−51.3.1 mL (−99.8, −2.8), P = .04, d = .67]. Correlations between BPV‐1.5T and EDSS (r = −.43, P = .027) and BPV‐3T and EDSS (r = −.49, P = .011) and between BPV‐1.5T and T25FW (r = −.46, P = .018) and BPV‐3T and T25FW (r = −.56, P = .003) slightly favored 3T. BPV‐cognition correlations were significant (P < .05) for 6 of 11 subscales to a similar degree at 1.5T (r range = .44‐.58) and 3T (r range = .43‐.53).
CONCLUSIONS
Field strength may impact whole brain volume measurements in patients with MS though the differences are not too divergent between 1.5T and 3T.
Keywords: Multiple sclerosis, brain volume, atrophy, cognitive impairment, disability, 3T, MRI
Background
Whole brain atrophy has emerged as a standard secondary outcome measure in therapeutic trials in relapsing forms of multiple sclerosis (MS) and as a proposed primary outcome measure in progressive forms of MS.1 Among all of the available MRI pulse sequences, 3‐dimensional acquisitions are thought to be preferred over 2‐dimensional acquisitions due to their high reproducibility in the obtained volumes.2 Most MS‐related clinical trials involving the measurement of brain atrophy have relied on 1.5T platforms. However, since approval by the FDA a few years ago, there is a growing interest in the use and increasing availability of 3T MRI scanners.
This ongoing transition from 1.5T to 3T field strengths in routine imaging and research studies of patients with MS introduces a potential need for calibration given the expected technical differences in signal‐to‐noise and contrast‐to‐noise. For example, a number of studies indicate that higher field strength increases the sensitivity to MS brain lesions when compared to 1.5T.3, 4, 5, 6, 7 Such field strength differences in tissue definition also appear to influence volume measurements that would define intrasubject changes over time and the comparison of intersubject differences in multicenter trials.8, 9, 10 The effect of field strength complicates the already known variability introduced by differences in acquisition voxel size and type of pulse sequence, and processing pipeline software platform, that confound the measurement of brain volumes even when the field strength is consistent between acquisitions.2, 11
We performed this study with the aim: (1) To evaluate the differences in normalized brain parenchymal volumes (BPVs) obtained from 1.5T versus 3T in patients with MS and normal controls (NC) and (2) Test their relative strength in correlations with MS clinical status including physical disability and cognitive function.
Methods
Subjects and Neurologic Examination
We prospectively studied 35 consecutively identified patients with MS and NC. Demographic and clinical characteristics of the subjects are summarized in Table 1; controls and patients had a similar distribution of age (P = .63, 2‐sample t‐test) and gender (P = 1.00, Fisher's exact test). Different aspects of these subjects have been reported as part of previously reported studies in which the recruitment details are provided.3, 12, 13 MS patients met the International Panel criteria for either MS or a clinically isolated syndrome.14 Our Institutional Review Board approved this study and informed consent was obtained from all subjects.
Table 1.
Demographic and Clinical Characteristics
| MS | NC | |
|---|---|---|
| Number of subjects | 26 | 9 |
| Sex ratio (women/men)* | .69 (18/8) | .77 (7/2) |
| Age, mean (range), years* | 43 (21‐55) | 45 (31‐53) |
| MS disease course | ||
| ‐Primary or secondary progressive multiple sclerosis | (n = 4) 15% | – |
| ‐Clinically isolated syndrome or relapsing remitting multiple sclerosis | (n = 22) 85% | – |
| Disease duration, years, mean ± SD (range) | 9.56 ± 8.60 (.2 – 23.8) | – |
| EDSS score, mean ± SD (range) | 1.98 ± 2.02 (0 – 6.5) | – |
| Timed 25 foot walk, mean ± SD (range) | 5.95 ± 5.65 (3.2 – 33.0 seconds) | – |
| Education (years), mean ± SD (range) | 15.92 ± 2.58 (8 – 20) | – |
NC = normal controls; MS = multiple sclerosis; EDSS = expanded disability status scale; SD = standard deviation.
*The controls and patients were not significantly different in terms of age (P = .63, 2‐sample t‐test) or gender (P = 1.00, Fisher's exact test).
Neurological and Neuropsychological Evaluation
Within 1 month of MRI, all patients with MS underwent an examination by an MS specialist neurologist including evaluation of the Expanded Disability Status Scale (EDSS)15 Score and timed 25 foot walk (T25FW).16 In addition, all MS subjects underwent a formal cognitive evaluation by a PhD in Clinical Psychology (B.I.G.) and a research fellow under her supervision. The details of the cognitive evaluation have been reported previously.3 Cognitive function was assessed using the Minimal Assessment of Cognitive Function in MS (MACFIMS), which focused on the domains most commonly affected in MS.17, 18 To adjust for the effect of depressive symptoms on cognition, patients were also administered the Center for Epidemiologic Studies Depression (CES‐D) scale.19
Imaging
The MRI scan protocols are shown in Table 2. Each subject underwent 1.5T brain MRI (Intera; Philips Medical Systems, Best, The Netherlands) and 3T (Signa; GE Healthcare, Milwaukee, Wisconsin, USA) using high‐resolution 3‐dimensional T1‐weighted scans; the paired scans were performed within a few days to 1 month in each subject. On the 1.5T scanner, a 3‐dimensional spoiled gradient‐echo (SPGR) pulse sequence was performed. On the 3T scanner, a coronal 3‐dimensional modified driven equilibrium Fourier transform (MDEFT)20 pulse sequence was performed. The scan protocols were chosen as the best available at the time (balancing scan quality and feasible acquisition time) on each scanner to show tissue differentiation relevant to the assessment of brain atrophy in patients with MS.
Table 2.
1.5T and 3T Brain MRI Acquisition Protocols
| 1.5T | 3T | |
|---|---|---|
| Scanner manufacturer | Philips | General Electric |
| Head coil | Quadrature | Receive‐only phased array |
| Number of channels | 4 | 8 |
| Type of sequence | 3D SPGR | 3D MDEFT |
| Orientation | Coronal | Coronal |
| Field of view (cm) | 23 × 23 | 24 × 24 |
| Matrix size | 256 × 256 | 256 × 256 |
| Number of slices | 116 | 124 |
| Slice thickness (mm) | 1.6 | 1.6 |
| Repetition time (msec) | 20 | 7.9 |
| Echo time TE (msec) | 4.61 | 3.14 |
| Flip angle | 25 | 15 |
| Voxel size (mm) | .898 × .898 × 1.6 | .938 × .938 × 1.6 |
| Scan time (minutes) | 5 | 7.5 |
| Number of signal averages | 1 | 1 |
SPGR = spoiled gradient‐echo; MDEFT = modified driven equilibrium Fourier transform.
Image Analysis
All original DICOM images from both scanners were transferred to the Laboratory for Neuroimaging Research and converted to the Neuroimaging Informatics Technology Initiative format using the Jim software package (Version 5.0, Xinapse Systems Ltd., Northants, UK, http://www.xinapse.com). Coronal images were then transferred to axial plane in Jim while keeping the same voxel size. In the axial images, all slices inferior to the cervico‐medullary junction were manually removed. Normalized BPV was obtained by applying these images to the fully automated segmentation‐based algorithm Structural Image Evaluation, using Normalization, of Atrophy (SIENAX),21, 22 part of FSL.23 SIENAX started by extracting the brain and CSF volume from the single whole‐head input data.24 The brain image was then affine‐registered to MNI152 space25, 26 (using the skull image to determine the registration scaling); this was primarily performed to obtain the volumetric scaling factor, used as a normalization for head size. Next, tissue‐type segmentation with partial volume estimation was conducted27 to calculate the total volume of brain tissue versus CSF. Optimization experiments led to our use of a brain extraction threshold of .3 for 1.5T images and .2 for 3T images to maintain adequate segmentation in each image set. Conventional lesion measures between field strengths were already reported in these subjects as part of a larger separate study;3 thus, lesion measures are not reported in this study.
Regarding the potential influence of T1 hypointense lesions present on the native 3‐dimensional acquisitions which were used to calculate brain volume, our previous work28 showed that misclassification of such lesions had no discernable influence on normalized whole brain volume outputs, the detection of any differences between NC and patients with MS, or the MRI‐clinical associations in patients with MS between whole brain volume and physical disability or cognitive impairment. Thus, in this study, we did not perform any such corrections related to T1 hypointense lesions.
Statistical Analysis
Demographic characteristics (age, gender) were compared between groups using a 2‐sample t‐test for continuous variables and a χ2 test for dichotomous variables. Across all subjects, the BPV‐1.5T were compared with the BPV‐3T using a paired t‐test. BPV differences at both field strengths between MS and controls were compared using linear regression with robust standard error to account for potential departures from equal variance in the 2 groups. Age at the time of the scan was included in the linear regression model as well. The Spearman Rank Correlation test evaluated the relationship between BPV and disease status measures (disease duration, EDSS score, and T25FW). The associations between the MACFIMS cognitive subscales and BPV were determined by partial Pearson's correlation coefficients controlling for age and depression (CES‐D scores). Effect size (d) was also calculated for group comparisons.29 A P value less than .05 was considered statistically significant. Because this was an exploratory study, no corrections for multiple comparisons were performed. The analysis was generated using Stata (v. 13.0 StataCorp LP, College Station, Texas, USA).
Results
BPVs Obtained from 1.5T versus 3T in Patients and Controls
Figure 1 shows the differences in BPVs between the 2 platforms. Across all subjects, BPV‐1.5T was higher than BPV‐3T (mean +45.7 mL, 95% CI: +35.3, +56.1, P < .00001 for a paired t‐test comparing the 2 platforms); all subjects except 1 had higher BPV at 1.5T (Figure 1). Expert examination of the segmentation outputs showed the brain‐CSF borders, particularly at the cortical ribbon, were demarcated more accurately at 3T, with overestimation of the brain compartment at 1.5T (Figure 2). This was most likely the result of the improved tissue contrast with less partial volume averaging at 3T. Table 3 compares BPV‐1.5T and BPV‐3T between groups. BPV‐3T showed a larger volume decrease and a larger effect size in detecting brain atrophy in MS versus NC [−74.5 mL (−126.5, −22.5), P = .006, d = .92] when compared to BPV‐1.5T [−51.3.1 mL (−99.8, −2.8), P = .04, d = .67] (Table 3).
Figure 1.
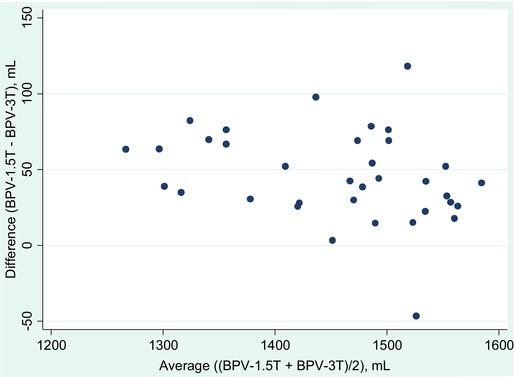
Difference between brain parenchymal volumes (BPVs) obtained at 1.5T versus 3T in all subjects (patients and controls; n = 35). A Bland‐Altman plot regarding the BPV‐1.5T minus BPV‐3T is shown. Note that the difference is always positive except for a single subject, showing that the BPV from the 1.5T magnet is nearly always higher than the BPV obtained at 3T. The average difference comparing the 2 platforms is 45.7 mL (95% CI: 35.3, 56.1, P < .00001, paired t‐test).
Figure 2.
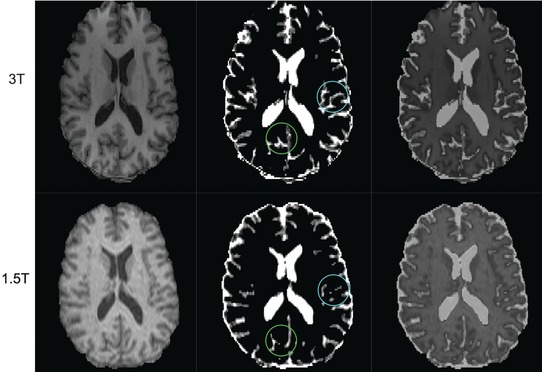
Comparison of brain‐CSF segmentation between 3T and 1.5T from 3‐dimensional T1‐weighted images. The top row is from 3T and the bottom is from 1.5T of a 53‐year‐old healthy man. The left column shows skull‐stripped images. The middle column shows CSF maps estimated by SIENAX, and the right column is the overlay of both images. Note that the CSF in the sulcus of the cerebral cortex is underestimated in 1.5T versus 3T which results in the overestimation of brain parenchymal volume at 1.5T (see circles on images in middle column). This is most likely the result of the improved tissue contract with less partial volume averaging at 3T.
Table 3.
Brain Parenchymal Volume at 1.5T versus 3T Comparing Controls and Patients
| Normal Controls | Multiple sclerosis | Adjusted group | |||
|---|---|---|---|---|---|
| (n = 9) | (n = 26) | difference mean | Effect size | ||
| Mean (SD); range | Mean (SD); range | P | (95% CI) | (d) 29 | |
| BPV‐1.5T | 1513.8 (35.9); 1453.2‐1569.8 mL | 1465.7 (94.9); 1298.4‐1605.2 mL | 0.04* | −51.3 mL (−99.8, −2.8) | 0.67 |
| BPV‐3T | 1485.1 (39.4); 1439.5‐1549.6 mL | 1414.1 (101.6); 1235.0‐1564.1 mL | 0.006* | −74.5 mL (−126.5, −22.5) | 0.92 |
BPV = brain parenchymal volume; CI = confidence interval; mL = milliliters.
*P < .05.
MRI‐Disability Associations
Table 4 shows the relationships between BPV and disability measures in the MS group. BPV‐1.5T and BPV‐3T correlated moderately and significantly with both EDSS score and T25FW. However, the r values were slightly higher and P values were slightly lower with BPV‐3T versus BPV‐1.5T. Thus, these MRI‐clinical associations regarding disability slightly favored 3T. BPV correlated weakly and similarly with disease duration (time since first symptoms) at both 1.5T (r = −.32, P = .12) and 3T (r = −.28, P = .17).
Table 4.
Correlations between Brain Parenchymal Volume and Disability at 1.5T versus 3T in the Multiple Sclerosis group (n = 26)
| BPV‐1.5T | BPV‐3T | |||
|---|---|---|---|---|
| r s | P | r s | P | |
| Expanded disability status scale | −.43 | .027* | −.49 | .011* |
| Timed 25 foot walk | −.46 | .018* | −.56 | .003* |
BPV = brain parenchymal volume; r s = Spearman correlation coefficient.
*P < .05.
MRI‐Cognitive Associations
Table 5 shows the relationships between BPV and cognitive measures in the MS group. BPV‐1.5T and BPV‐3T correlated moderately and significantly with the same 6 of 11 MACFIMS subscales. For the 6 significant associations, the r values were similar at 1.5T (r range = .44−.58) and 3T (r range = .43−.53).
Table 5.
Correlations between Cognition and Brain Parenchymal Volume at 1.5T versus 3T in the Multiple Sclerosis Group (n = 26)
| BPV‐1.5T | BPV‐3T | |||
|---|---|---|---|---|
| MACFIMS Subscale | r | P | r | P |
| PASAT 2 | .54 | .007* | .53* | .007* |
| PASAT 3 | .55 | .006* | .53 | .007* |
| COWAT | .50 | .013* | .46 | .024* |
| BVMT DR | .36 | .080 | .29 | .165 |
| BVMT TL | .24 | .256 | .16 | .456 |
| JLO | .52 | .010* | .48 | .017* |
| SDMT | .59 | .003* | .52 | .009* |
| CVLT TL | .44 | .033* | .43 | .034* |
| CVLT DR | .37 | .077 | .33 | .115 |
| DKEFS CS | .23 | .277 | .25 | .243 |
| DKEFS DS | .18 | .394 | .20 | .351 |
MACFIMS = minimal assessment of cognitive function in multiple sclerosis; BPV = brain parenchymal volume; PASAT = paced auditory serial addition test (2‐ and 3‐second versions); COWAT = controlled oral word association test; BVMT = brief visuospatial memory test (DR = delayed free recall; TL = total learning); JLO = judgment of line orientation; SDMT = symbol digit modalities test; CVLT = California verbal learning test (TL = total learning; DR = long delay free recall); DKEFS = Delis‐Kaplan executive function system sorting test (CS = total confirmed correct sorts; DS = total description score); r = Pearson's partial correlation coefficient (adjusted for age and depression scores).
*P < .05.
Discussion
We explored the role of scan protocol differences, largely due to field strength, on whole brain volume measurement in patients with MS and NC, and their clinical relevance. The first major finding in our study was that field strength clearly had the potential to impact on whole brain volume measurements in that we showed a clear bias in the results. The BPV‐1.5T values were generally higher than BPV‐3T in both groups, owing most likely to overestimation of BPV at the margins between the parenchyma and CSF compartments.
The second major finding in this study is that BPV obtained from 3T showed a slightly higher validity when evaluating patients with MS. This was seen from several perspectives. First, when comparing MS patients to NC, both the BPV‐3T and the BPV‐1.5T showed whole brain atrophy in the MS group and a significant difference between MS patients, but the effect size was larger for BPV‐3T. Second, when evaluating the MS group for the correlation between BPV and clinical measures of disability, the BPV‐3T showed slightly higher correlations with both overall neurologic disability and ambulatory function. However, the BPV‐1.5T also showed significant associations with these clinical measures. Furthermore, in the study of correlation between BPV and cognitive measures in the MS group, both BPV‐1.5T and BPV‐3T correlated moderately and significantly with a number of cognitive tests. The strength of correlations was similar between the 2 field strengths. Thus, overall, brain volume obtained from 3T showed a slightly higher validity in this study.
One clear finding worthy of discussion is that the 1.5T platform produced higher BPVs, reflecting an overestimation of brain parenchymal tissue versus the 3T platform. In a previous study, Jovicich and colleagues8 computed brain structure volumes from various scan protocols at both 1.5T and 3T and showed that field strength may bias the measurement of gray matter areas. In addition, Chow and colleagues30 showed a superior signal‐to‐noise ratio and a greater effect size in detecting hippocampal atrophy in patients with Alzheimer's disease or mild cognitive impairment as compared to NC at 3T versus 1.5T. Examination of our segmentation maps indicated that the 1.5T images produced lower tissue contrast. This led to an overestimation of brain volume at the CSF interfaces at 1.5T due to partial volume averaging.
These results extend previous studies indicating the increased utility of 3T versus lower field platforms in the evaluation of brain lesions in patients with MS. Several studies have shown that 3T and higher field strengths increase the sensitivity to MS brain lesions when compared to 1.5T.3, 4, 5, 6, 7 For example, in a previous study, we showed that 3T showed a higher lesion load and higher correlations with cognitive function than 1.5T in patients with MS.3 This study extends these findings by showing a potential gain in accuracy and validity in the measurement of MS‐related brain atrophy with 3T.
Taken together, our data combined with previous findings have implications for multicenter studies in that pooling brain images from patients scanned at 1.5T and patients scanned at 3T may introduce bias into the obtained results. Such differences may require statistically corrective modeling.31 Furthermore, such differences should be kept in mind when considering longitudinal data from a patient in whom different time point scans were performed at different field strengths. The latter would be a particularly key issue to address with calibration studies when centers upgrade their ongoing routine imaging or research studies from 1.5T to 3T magnets.
There were several technical aspects of our study worthy of comment. Although the pulse sequences at 1.5T versus 3T were similar on voxel size and both 3‐dimensional and T1‐weighted, they were not the same pulse sequence. At 3T, we used an MDEFT sequence which was chosen to be optimal on our scanner to perform volumetric studies. This sequence has been proposed as superior to standard 3‐dimensional T1‐weighted images for voxel‐based morphometry9 and is comparable for spinal cord volumetry.32 Our protocols also differed with regard to scan vendor and head coil specifications.
Further studies should extend these results with a larger sample size, closer to uniform scan protocols between platforms, and longitudinal studies to assess the differences in sensitivity with disease evolution that is truly determined by field strength. In addition, it would be of interest to assess the effect of field strength on the compartmental segmentation of the brain into gray versus white matter and regional cerebral volumes in patients with MS.
Acknowledgements and disclosure: This study was supported in part by a research grant to Rohit Bakshi from the National Multiple Sclerosis Society (RG3798A2). The authors have no competing interest related to the study.
References
- 1. Chataway J, Schuerer B, Alsanousi A, et al. Effect of high‐dose simvastatin on brain atrophy and disability in secondary progressive multiple sclerosis (MS‐STAT): a randomised, placebo‐controlled, phase 2 trial. Lancet 2014;383:2213‐21. [DOI] [PubMed] [Google Scholar]
- 2. Bakshi R, VSR Dandamudi, Neema M, et al. Measurement of brain and spinal cord atrophy by magnetic resonance imaging as a tool to monitor multiple sclerosis. J Neuroimaging 2005;15:30s‐45s. [DOI] [PubMed] [Google Scholar]
- 3. Stankiewicz JM, Glanz BI, Healy BC, et al. Brain MRI lesion load at 1.5T and 3T versus clinical status in multiple sclerosis. J Neuroimaging 2011;21:e50‐6. [DOI] [PMC free article] [PubMed] [Google Scholar]
- 4. Keiper MD, Grossman RI, Hirsch JA, et al. MR identification of white matter abnormalities in multiple sclerosis: a comparison between 1.5 T and 4 T. AJNR Am J Neuroradiol 1998;19:1489‐93. [PMC free article] [PubMed] [Google Scholar]
- 5. Sicotte NL, Voskuhl RR, Bouvier S, et al. Comparison of multiple sclerosis lesions at 1.5 and 3.0 Tesla. Invest Radiol 2003;38:423‐27. [DOI] [PubMed] [Google Scholar]
- 6. Wattjes MP, Harzheim M, Kuhl CK, et al. Does high‐field MR imaging have an influence on the classification of patients with clinically isolated syndromes according to current diagnostic MR imaging criteria for multiple sclerosis? AJNR Am J Neuroradiol 2006;27:1794‐8. [PMC free article] [PubMed] [Google Scholar]
- 7. Wattjes MP, Lutterbey GG, Harzheim M. Higher sensitivity in the detection of inflammatory brain lesions in patients with clinically isolated syndromes suggestive of multiple sclerosis using high field MRI: an intraindividual comparison of 1.5 T with 3.0 T. Eur Radiol 2006;16:2067‐73. [DOI] [PubMed] [Google Scholar]
- 8. Jovicich J, Czanner S, Han X, et al. MRI‐derived measurements of human subcortical, ventricular and intracranial brain volumes: reliability effects of scan sessions, acquisition sequences, data analyses, scanner upgrade, scanner vendors and field strengths. Neuroimage 2009;46:177‐92. [DOI] [PMC free article] [PubMed] [Google Scholar]
- 9. Tardif CL, Collins DL, Pike GB. Sensitivity of voxel‐based morphometry analysis to choice of imaging protocol at 3T. NeuroImage 2009;44:827‐38. [DOI] [PubMed] [Google Scholar]
- 10. Tardif CL, Collins DL, Pike GB. Regional impact of field strength on voxel‐based morphometry results. Hum Brain Mapp 2010;31:943‐57. [DOI] [PMC free article] [PubMed] [Google Scholar]
- 11. Leigh R, Ostuni J, Pham D, et al. Estimating cerebral atrophy in multiple sclerosis patients from various MR pulse sequences. Mult Scler 2002;8:420‐9. [DOI] [PubMed] [Google Scholar]
- 12. Stankiewicz JM, Neema M, Alsop DC, et al. Spinal cord lesions and clinical status in multiple sclerosis: a 1.5 T and 3 T MRI study. J Neurol Sci 2009;279:99‐105. [DOI] [PMC free article] [PubMed] [Google Scholar]
- 13. Neema M, Guss ZD, Stankiewicz J, et al. Normal findings on brain FLAIR MRI scans at 3T. AJNR Am J Neuroradiol 2009;30:911‐6. [DOI] [PMC free article] [PubMed] [Google Scholar]
- 14. Polman CH, Reingold SC, Edan G, et al. Diagnostic criteria for multiple sclerosis: 2005 revisions to the “McDonald Criteria.” Ann Neurol 2005;58:840‐6. [DOI] [PubMed] [Google Scholar]
- 15. Kurtzke JF. Rating neurologic impairment in multiple sclerosis: an expanded disability status scale (EDSS). Neurology 1983;33:1444‐52. [DOI] [PubMed] [Google Scholar]
- 16. Fischer JS, Rudick RA, Cutter GR. The multiple sclerosis functional composite measure (MSFC): an integrated approach to MS clinical outcome assessment. National MS Society Clinical Outcomes Assessment Task Force. Mult Scler 1999;5:244‐50. [DOI] [PubMed] [Google Scholar]
- 17. Benedict RH, Fischer JS, Archibald CJ, et al. Minimal neuropsychological assessment of MS patients: a consensus approach. Clin Neuropsychol 2002;16:381‐97. [DOI] [PubMed] [Google Scholar]
- 18. Benedict RH, Cookfair D, Gavett R, et al. Validity of the minimal assessment of cognitive function in multiple sclerosis (MACFIMS). J Int Neuropsychol Soc 2006;12:549‐58. [DOI] [PubMed] [Google Scholar]
- 19. Radloff LS. The CES‐D scale: a self report depression scale for research in the general population. Appl Psychol Meas 1977;1:385‐401. [Google Scholar]
- 20. Deichmann R, Schwarzbauer C, Turner R. Optimisation of the 3D MDEFT sequence for anatomical brain imaging: technical implications at 1.5 and 3 T. Neuroimage 2004;21:757‐67. [DOI] [PubMed] [Google Scholar]
- 21. Smith SM, De Stefano N, Jenkinson M, et al. Normalized accurate measurement of longitudinal brain change. J Comput Assist Tomogr 2001;25:466‐75. [DOI] [PubMed] [Google Scholar]
- 22. Smith SM, Zhang Y, Jenkinson M, et al. Accurate, robust, and automated longitudinal and cross‐sectional brain change analysis. Neuroimage 2002;17:479‐89. [DOI] [PubMed] [Google Scholar]
- 23. Smith SM, Jenkinson M, Woolrich MW, et al. Advances in functional and structural MR image analysis and implementation as FSL. Neuroimage 2004;23:S208‐19. [DOI] [PubMed] [Google Scholar]
- 24. Smith SM. Fast robust automated brain extraction. Hum Brain Mapp 2002;17:143‐55. [DOI] [PMC free article] [PubMed] [Google Scholar]
- 25. Jenkinson M, Smith S. A global optimisation method for robust affine registration of brain images. Med Image Anal 2001;5:143‐56. [DOI] [PubMed] [Google Scholar]
- 26. Jenkinson M, Bannister P, Brady M, et al. Improved optimization for the robust and accurate linear registration and motion correction of brain images. Neuroimage 2002;17:825‐41. [DOI] [PubMed] [Google Scholar]
- 27. Zhang Y, Brady M, Smith S. Segmentation of brain MR images through a hidden Markov random field model and the expectation‐maximization algorithm. IEEE Trans Med Imaging 2001;20:45‐57. [DOI] [PubMed] [Google Scholar]
- 28. Dell'Oglio E, Ceccarelli A, Glanz BI, et al. Quantification of global cerebral atrophy in multiple sclerosis from 3T MRI using SPM: the role of misclassification errors. J Neuroimaging 2015;25:191‐9. [DOI] [PMC free article] [PubMed] [Google Scholar]
- 29. Cohen J. Statistical Power Analysis for the Behavioral Sciences. 2nd ed Hillsdale, NJ: Lawrence Earlbaum, 1988. [Google Scholar]
- 30. Chow N, Hwang KS, Hurtz S, et al. Comparing 3T and 1.5T MRI for mapping hippocampal atrophy in the Alzheimer's Disease Neuroimaging Initiative. AJNR Am J Neuroradiol 2015;36:653‐60. [DOI] [PMC free article] [PubMed] [Google Scholar]
- 31. Jones BC, Nair G, Shea CD, et al. Quantification of multiple‐sclerosis‐related brain atrophy in two heterogeneous MRI datasets using mixed‐effects modeling. Neuroimage Clin 2013;3:171‐9. [DOI] [PMC free article] [PubMed] [Google Scholar]
- 32. Freund PA, Dalton C, Wheeler‐Kingshott CA. Method for simultaneous voxel‐based morphometry of the brain and cervical spinal cord area measurements using 3D‐MDEFT. J Magn Reson Imaging 2010;32:1242‐7. [DOI] [PMC free article] [PubMed] [Google Scholar]