

Abstract
We advance mass spectrometry from a cell population‐averaging tool to one capable of quantifying the expression of diverse proteins in single embryonic cells. Our instrument combines capillary electrophoresis (CE), electrospray ionization, and a tribrid ultrahigh‐resolution mass spectrometer (HRMS) to enable untargeted (discovery) proteomics with ca. 25 amol lower limit of detection. CE‐μESI‐HRMS enabled the identification of 500–800 nonredundant protein groups by measuring 20 ng, or <0.2% of the total protein content in single blastomeres that were isolated from the 16‐cell frog (Xenopus laevis) embryo, amounting to a total of 1709 protein groups identified between n=3 biological replicates. By quantifying ≈150 nonredundant protein groups between all blastomeres and replicate measurements, we found significant translational cell heterogeneity along multiple axes of the embryo at this very early stage of development when the transcriptional program of the embryo has yet to begin.
Keywords: embryo, mass spectrometry, proteins, single-cell studies, Xenopus laevis
Empowering high‐resolution mass spectrometry (HRMS) to the characterization of the proteome in single cells is a long‐standing challenge that promises to deepen our understanding of how functional differences between cells fundamentally contribute to health and disease.1 HRMS is label‐free, quantitative, and allows for the unbiased measurement of the deep encoded proteome by averaging multiple, usually, millions of cells.2 However, to transform HRMS from a cell population‐averaging tool into a “single‐cell proteomic analyzer”, new approaches are needed with exceptional sensitivity and reproducibility. The prospect of proteomic single‐cell analysis was pioneered in the 1990s when capillary electrophoresis (CE) and Fourier transform MS was combined to detect α‐ and β‐globulins in 5–10 human erythrocytes3 and carbonic anhydrase4 in their lysates diluted to single cells. HRMS‐based detection of globulins was accelerated to 12 erythrocytes/min using microfluidic devices5 and, most recently, 34 targeted proteins contributing to hematopoiesis were detected at ≈1000 cell/s throughput using mass cytometry.6 Continuous developments in HRMS sensitivity enabled untargeted (discovery) proteomics on progressively smaller populations of cells1c, 7 with representative successes including the identification of 2000 proteins from 2000–4000 cells from single Langerhans islands,8 167 proteins from 500 breast cancer cells,1a 109 proteins from 100 HeLa cells,9 and most recently, ≈12 000 proteins in ≈50 fertilized10 and a single unfertilized egg of the South African clawed frog (Xenopus laevis).11 Using advanced microsampling and discovery HRMS,1c, 12 neuropeptides were characterized in single molluscan13 and arthropod neurons12 as well as cells in the mammalian pituitary gland and Langerhans islets.13a However, discovery measurements addressing the deep proteome have yet to be developed for single cells. To address this challenge, we here develop a bottom‐up HRMS platform and protocol that enables identification–quantitation of a large number of proteins in single embryonic cells.
The new single‐cell proteomic analyzer integrates a custom‐designed single‐cell CE platform and a CE‐micro‐flow electrospray ion source (μESI) to a high‐resolution tandem mass spectrometer in a bottom‐up proteomic workflow (Figure 1), in which proteins are identified/quantified based on unique peptide sequences. This design was inspired based on a CE platform that we recently developed for small molecules (metabolites) in single neurons14 and Xenopus embryonic cells (blastomeres).15 The single‐cell CE platform was able to electrophoretically separate 1–50 ng peptides into a CE‐μESI interface, where peptides were efficiently ionized and sequenced on the order of milliseconds using HRMS (see Supporting Information). A 25‐amol lower limit of detection and a 3–5 log‐order quantitative range for standard peptides (Figure 2 A) raised trace‐level bottom‐up proteomic capabilities.
Figure 1.
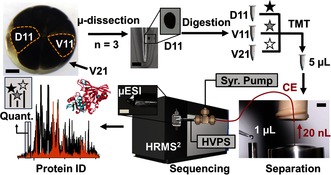
Microanalytical pipeline enabling multiplexing proteomic quantification of single embryonic cells in the 16‐cell Xenopus embryo using microdissection, micro‐scale bottom‐up proteomics, and a custom‐built single‐cell CE‐μESI platform for a high‐resolution tandem mass spectrometer (HRMS2). Key: HVPS, high voltage power supply; Syr. Pump, syringe pump. Scale bars: 150 μm (embryo and μESI, left‐middle panels), 250 μm (microcentrifuge vial), 1.5 mm (separation, right panel).
Figure 2.

Advancing bottom‐up discovery proteomics to single cells using CE‐μESI‐HRMS. A) Quantification curves for model peptides with 25‐amol lower limit of detection and at least a 3‐log‐order linear dynamic range. B) Evaluation of technical and biological repeatability across a week of measurements. C) Proteomic coverage was enhanced using 20 ng digest by refining sample preparation‐separation (Steps 1–4), peptide sequencing (Steps 5–9), and data analysis (Steps 10–12). Experimental conditions are in Table S2. D) Comparing peptide identifications by CE‐μESI‐HRMS with nanoLC‐nanoESI‐HRMS, the closest neighbor of bottom‐up proteomic technology.
We tested CE‐μESI‐HRMS on single embryonic cells of different developmental fates in the 16‐cell embryo; the midline dorsal‐animal cell (termed D11) reproducibly gives rise to the central nervous system; the midline ventral‐animal cell (termed V11) gives rise to the neural crest and epidermis; and the midline ventral‐vegetal cell (termed V21) gives rise principally to the hindgut16 (Figure 1). Although these blastomeres contain a considerable amount, ≈10 μg proteins (Figure S1 in the Supporting Information), ≈90 % (w/w) of the proteome is dominated by vitellogenin (yolk protein), essentially providing ≈1 μg yolk‐free proteome/cell at this developmental stage.17 The volume of the blastomeres (≈90 nL/cell) and their protein content are 1000‐ to 10 000‐times and 100‐ to 1000‐times smaller than typically accessed in bottom‐up HRMS, respectively. After downscaling a traditional bottom‐up proteomic workflow by ca. 20‐fold, we were able to extract and digest proteins from single D11, V11, and V21 blastomeres and repeatedly analyze 20 ng, or 0.2 % of the total protein content of these single cells with a quantitative technical reproducibility of 11.5 % standard error of the mean (S.E.M.) (same extract measured multiple times across a week) and a biological reproducibility of 13.5 % S.E.M. (different single blastomeres of the same type measured from different embryos) (Figure 2 B). Technical details are provided in the Supporting Information. These results provide leverage to using this instrument for also smaller cells such as mammalian cells.
To access the single‐cell encoded proteome deeper, we reconfigured the CE‐μESI‐HRMS instrument for higher‐sensitivity detection (Figure 2 C). Using digests of 16‐cell embryos, we performed a 12‐step refinement of system performance (see details in Table S1). As a result, we were able to identify 482 nonredundant protein groups (PGs) from 1630 proteins in 20 ng digest by acquiring 23 000 peptide spectral matches. In comparison with nano‐liquid chromatography nano‐ESI‐HRMS, CE‐μESI‐HRMS identified a comparable number of proteins by sequencing a larger number of peptides while measuring 200‐times less protein digest in half the time (Figure 2 D). We attribute these performance improvements by CE to a synergy of factors: peptide loading directly into the separation capillary minimizes peptide losses; field‐amplified sample stacking pre‐concentrates peptides on‐line; a higher electrophoretic separation efficiency distinguishes complex peptides in higher peak capacity; peptides separating as narrower bands (25‐s vs. 75‐s‐wide peaks in nanoLC) better utilize the duty cycle of tandem HRMS, particularly benefiting parallelizable analyzer operation by the orbitrap‐quadrupole‐linear ion trap tribrid instrument design.
Next, we demonstrated CE‐μESI‐HRMS for querying protein expression in single blastomeres. Using new‐generation nanoLC‐nanoESI‐HRMS18 capable of obtaining deep‐to‐near complete coverage of the encoded proteome,2a recent studies on whole Xenopus embryos and eggs quantified the expression of 11 000 proteins with high precision,11 finding global translational changes among 4000 PGs during early embryogenesis19 and revealing even nucleocytoplasmic protein partitioning in the oocyte.20 Using CE‐μESI‐HRMS, we identified 1070 PGs in V11, 884 PGs in V21, and 853 PGs in D11 blastomeres, amounting to a total of 1709 different PGs (from 4846 proteins) identified among these cell types measured in n=3 biological replicates with technical duplicates (see also Table S2). A comprehensive list of identified proteins is provided in Table S3. About a quarter of these proteins were common to all the cell types, including Fzd2, Gapdh, and Vtg. Other proteins were identified in only one or two cell types (see Figure 3 A), such as Gem and Ism in D11, Sox9 in V11, and Vent1 in V21. Results from independent studies corroborate these findings: Vtg is ubiquitous in the embryo and proteins such as Gapdh are involved in basic cell energy production; Gem and Ism participate in neuronal development,21 agreeing with the main fate of D11 blastomeres;16 Sox9 is involved in neural crest development, one of the fates of V11 blastomeres;16 and Vent1 is linked to the formation of the proctodeum,22 consistent with the reproducible hindgut fate of V21.16 Gene ontology annotation suggests that the identified proteins principally orchestrate metabolic processes, transport, and cell organization in various subcellular locations, including the cytoplasm, nucleus, and membrane (Figure 3 B). In agreement, metabolism is particularly active in these blastomeres and different cell types harbor different metabolomes.15, 23
Figure 3.
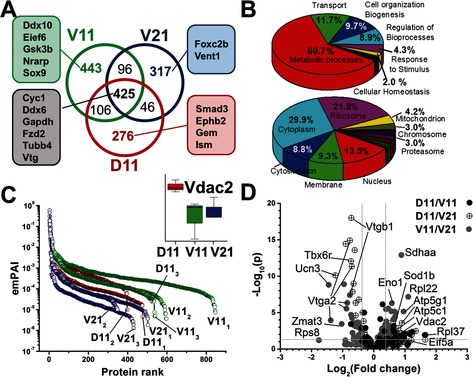
Single‐cell measurements uncovering translational asymmetry in the 16‐cell Xenopus embryo. A) Identification of 1709 different protein groups between D11, V11, and V21 cell types, suggesting proteomic cell differences (see peptide grouping in Figure S3 and proteins in Table S3). B) Gene ontology evaluation of biological processes (top) and sub‐cellular location of identified proteins (bottom). C) Protein abundances covered a 5–6 log‐order dynamic range. Differential expression shown for Vdac2 (Inset). D) Multiplexing quantification for 152 nonredundant protein groups between the D11/V11, D11/V21, and V11/V21 cell types. The volcano plot marks statistical and biological significance (p<0.05, ≥1.3‐fold change) and labels select proteins. Significant protein differences are shown in Figure S4 and listed in Table S5.
Exponentially modified protein abundance indexes (emPAI)24 calculated on the CE‐μESI‐HRMS data suggested that the proteins spanned a 5–6 log‐order concentration range (Figure 3 C), agreeing with abundances reported for whole embryos using nanoLC‐MS.11 Analysis of variance (ANOVA) on median‐normalized emPAI scores suggested differential expression for several proteins between the cell types (see representative proteins in Table S4). For example, Vtg A2 and B1 were more abundant in the V21 and D11 blastomeres, and the D11 cells accumulated Vdac2 compared to the counterparts (see inset, Figure 3 C). In agreement, Vtg is known to accumulate in blastomeres occupying the vegetal hemisphere, and Vdac2 is expressed in the brain and eyes of the embryo (see Xenbase Image ID 30480), which are derived from the D11 blastomere.16, 25 With internal standards, it is possible to use these emPAI values to quantify single‐cell protein expression with precision and accuracy in future studies. The proteins detected in this study correspond to ca. 30 % of the encoded proteome of Xenopus embryos at this early stage of development,26 providing a deep coverage of the single‐blastomere encoded proteome after cell cleavage begins.
Last, we validated translational cell‐heterogeneity by adapting orthogonal multiplexing quantification to the single cells (Figure 1). Digested D11, V11, and V21 blastomeres (n=3) were labeled using distinct tandem mass tags, and the resulting peptides were pooled and measured together in technical quadruplets (see Supporting Information). Of the 1200+ PGs that were identified across all measurements, 138 PGs were quantified between D11/V11, 134 PGs between V11/V21, and 145 PGs between V11/V21 cell types, amounting to a total of 152 different PGs quantified between all cell types. Based on high‐accuracy quantification of whole embryos by nanoLC‐MS,11 these proteins are estimated to range from a few tens of nanomolar to tens of micromolar, demonstrating sufficient sensitivity by CE‐μESI‐MS also for single‐cell analysis; low‐abundance proteins included Zmat (≈13 nm), Tbx6r (≈20 nm), and Eno1 (≈90 nm) in our measurements. Figure 3 D compares protein expression between the cell types, and differentially expressed proteins are compiled in Figure S4. Abundances were comparable between the blastomeres for the majority of the proteins (ratios centered at 1.0), whereas levels were significantly different for 16 PGs between D11‐V11, 47 between D11‐V21, and 45 between V11‐V21 blastomeres (see proteins in Table S5). For example, expression was higher for Vdac2 and Eif5a in D11 as well as for Tbx6r and Vtga2 in V21. In agreement, we earlier found Vdac2 to be more highly abundant in D11 cells, Eif5a plays a role in brain development and function,27 a stereotypical fate of the D11 cell type,16 and vegetal cells are known to contain more yolk platelets. Intriguingly, differential protein expression signifies that asymmetry along the animal‐vegetal (V11 vs. V21) and dorsal‐ventral (D11 vs. V11) axes of the 16‐cell embryo are already established when transcriptional asymmetry is evidenced only along the animal‐vegetal axis based on deep sequencing of the single‐blastomere transcriptomes.28
The qualitative and quantitative proteomic expression dataset that is provided here complements already available transcriptomic information on molecular processes during embryonic development and raises an opportunity to design targeted experiments to test the developmental roles of select proteins. Proteins that were identified or quantified during this work compare favorably to transcripts that were recently identified in the early developing embryo using next‐generation sequencing technologies.28, 29 Table S6 tabulates 998 transcripts for which we have manually confirmed the corresponding transcript in the published mRNA datasets. Additionally, this list expands to at least 1601 protein‐transcript matches based on protein names that were derived from experimental mRNA datasets marking known expression of the gene.11, 30 In addition to a large number of housekeeping gene products, this list includes at least 20 known signal transduction and transcription factors. Besides partial validation of performance for single‐cell CE‐μESI‐HRMS, this agreement also suggests that several mRNAs inherited from the egg are translated prior to the onset of embryonic transcription, which occurs several hours later. We anticipate that the single‐cell proteomic mass spectrometer that was developed here will expand the technological toolbox for cell and developmental biology to help derive a holistic understanding of basic cellular biochemical processes orchestrating normal development.
Supporting information
As a service to our authors and readers, this journal provides supporting information supplied by the authors. Such materials are peer reviewed and may be re‐organized for online delivery, but are not copy‐edited or typeset. Technical support issues arising from supporting information (other than missing files) should be addressed to the authors.
Supplementary
Acknowledgements
Research reported in this publication was supported by National Science Foundation Grants DBI‐1455474 (to P.N. and S.A.M.), the George Washington University Department of Chemistry Start‐Up Funds (to P.N.) and Columbian College Facilitating Funds (to P.N.). The content is solely the responsibility of the authors and does not necessarily represent the official views of the funding agencies. We thank William F. Rutkowski (Department of Mechanical and Aerospace Engineering) for machining the sample‐loading components of the CE platform.
C. Lombard-Banek, S. A. Moody, P. Nemes, Angew. Chem. Int. Ed. 2016, 55, 2454.
References
- 1.
- 1a. Wang N., Xu M. G., Wang P., Li L., Anal. Chem. 2010, 82, 2262–2271; [DOI] [PubMed] [Google Scholar]
- 1b. Altschuler S. J., Wu L. F., Cell 2010, 141, 559–563; [DOI] [PMC free article] [PubMed] [Google Scholar]
- 1c. Rubakhin S. S., Romanova E. V., Nemes P., Sweedler J. V., Nat. Methods 2011, 8, S20–S29. [DOI] [PMC free article] [PubMed] [Google Scholar]
- 2.
- 2a. Kim M. S., Pinto S. M., Getnet D., Nirujogi R. S., Manda S. S., Chaerkady R., Madugundu A. K., Kelkar D. S., Isserlin R., Jain S., Thomas J. K., Muthusamy B., Leal-Rojas P., Kumar P., Sahasrabuddhe N. A., Balakrishnan L., Advani J., George B., Renuse S., Selvan L. D. N., Patil A. H., Nanjappa V., Radhakrishnan A., Prasad S., Subbannayya T., Raju R., Kumar M., Sreenivasamurthy S. K., Marimuthu A., Sathe G. J., Chavan S., Datta K. K., Subbannayya Y., Sahu A., Yelamanchi S. D., Jayaram S., Rajagopalan P., Sharma J., Murthy K. R., Syed N., Goel R., Khan A. A., Ahmad S., Dey G., Mudgal K., Chatterjee A., Huang T. C., Zhong J., Wu X. Y., Shaw P. G., Freed D., Zahari M. S., Mukherjee K. K., Shankar S., Mahadevan A., Lam H., Mitchell C. J., Shankar S. K., Satishchandra P., Schroeder J. T., Sirdeshmukh R., Maitra A., Leach S. D., Drake C. G., Halushka M. K., Prasad T. S. K., Hruban R. H., Kerr C. L., Bader G. D., Iacobuzio-Donahue C. A., Gowda H., Pandey A., Nature 2014, 509, 575–581; [DOI] [PMC free article] [PubMed] [Google Scholar]
- 2b. Picotti P., Clement-Ziza M., Lam H., Campbell D. S., Schmidt A., Deutsch E. W., Rost H., Sun Z., Rinner O., Reiter L., Shen Q., Michaelson J. J., Frei A., Alberti S., Kusebauch U., Wollscheid B., Moritz R. L., Beyer A., Aebersold R., Nature 2013, 494, 266–270; [DOI] [PMC free article] [PubMed] [Google Scholar]
- 2c. Hebert A. S., Richards A. L., Bailey D. J., Ulbrich A., Coughlin E. E., Westphall M. S., Coon J. J., Mol. Cell. Proteomics 2014, 13, 339–347. [DOI] [PMC free article] [PubMed] [Google Scholar]
- 3. Hofstadler S. A., Swanek F. D., Gale D. C., Ewing A. G., Smith R. D., Anal. Chem. 1995, 67, 1477–1480. [DOI] [PubMed] [Google Scholar]
- 4. Valaskovic G. A., Kelleher N. L., McLafferty F. W., Science 1996, 273, 1199–1202. [DOI] [PubMed] [Google Scholar]
- 5. Mellors J. S., Jorabchi K., Smith L. M., Ramsey J. M., Anal. Chem. 2010, 82, 967–973. [DOI] [PMC free article] [PubMed] [Google Scholar]
- 6. Bendall S. C., Simonds E. F., Qiu P., Amir E. A. D., Krutzik P. O., Finck R., Bruggner R. V., Melamed R., Trejo A., Ornatsky O. I., Balderas R. S., Plevritis S. K., Sachs K., Pe'er D., Tanner S. D., Nolan G. P., Science 2011, 332, 687–696. [DOI] [PMC free article] [PubMed] [Google Scholar]
- 7. Passarelli M. K., Ewing A. G., Curr. Opin. Chem. Biol. 2013, 17, 854–859. [DOI] [PMC free article] [PubMed] [Google Scholar]
- 8. Waanders L. F., Chwalek K., Monetti M., Kumar C., Lammert E., Mann M., Proc. Natl. Acad. Sci. USA 2009, 106, 18902–18907. [DOI] [PMC free article] [PubMed] [Google Scholar]
- 9. Chen Q., Yan G. Q., Gao M. X., Zhang X. M., Anal. Bioanal. Chem. 2015, 407, 1027–1032. [DOI] [PubMed] [Google Scholar]
- 10. Sun L. L., Zhu G. J., Zhang Z. B., Mou S., Dovichi N. J., J. Proteome Res. 2015, 14, 2312–2321. [DOI] [PMC free article] [PubMed] [Google Scholar]
- 11. Wühr M., R. M. Freeman, Jr. , Presler M., Horb M. E., Peshkin L., Gygi S. P., Kirschner M. W., Curr. Biol. 2014, 24, 1467–1475. [DOI] [PMC free article] [PubMed] [Google Scholar]
- 12. Buchberger A., Yu Q., Li L. J., Annu. Rev. Anal. Chem. 2015, 8, 485–509. [DOI] [PMC free article] [PubMed] [Google Scholar]
- 13.
- 13a. Ong T. H., Tillmaand E. G., Makurath M., Rubakhin S. S., Sweedler J. V., Biochim. Biophys. Acta Proteins Proteomics 2015, 1854, 732–740; [DOI] [PMC free article] [PubMed] [Google Scholar]
- 13b. Lanni E. J., Rubakhin S. S., Sweedler J. V., J. Proteomics 2012, 75, 5036–5051. [DOI] [PMC free article] [PubMed] [Google Scholar]
- 14. Nemes P., Rubakhin S. S., Aerts J. T., Sweedler J. V., Nat. Protoc. 2013, 8, 783–799. [DOI] [PMC free article] [PubMed] [Google Scholar]
- 15. Onjiko R. M., Moody S. A., Nemes P., Proc. Natl. Acad. Sci. USA 2015, 112, 6545–6550. [DOI] [PMC free article] [PubMed] [Google Scholar]
- 16. Moody S. A., Dev. Biol. 1987, 119, 560–578. [DOI] [PubMed] [Google Scholar]
- 17. Jorgensen P., Steen J. A., Steen H., Kirschner M. W., Development 2009, 136, 1539–1548. [DOI] [PMC free article] [PubMed] [Google Scholar]
- 18. Zhang Y. Y., Fonslow B. R., Shan B., Baek M. C., Yates J. R., Chem. Rev. 2013, 113, 2343–2394. [DOI] [PMC free article] [PubMed] [Google Scholar]
- 19. Sun L. L., Bertke M. M., Champion M. M., Zhu G. J., Huber P. W., Dovichi N. J., Sci. Rep. 2014, 4, 4365. [DOI] [PMC free article] [PubMed] [Google Scholar]
- 20. Wühr M., Güttler T., Peshkin L., McAlister G. C., Sonnett M., Ishihara K., Groen A. C., Presler M., Erickson B. K., Mitchison T. J., Kirschner M. W., Gygi S. P., Curr. Biol. 2015, 25, 2663–2671. [DOI] [PMC free article] [PubMed] [Google Scholar]
- 21.
- 21a. Pera E. M., Kim J. I., Martinez S. L., Brechner M., Li S. Y., Wessely O., De Robertis E. M., Mech. Dev. 2002, 116, 169–172; [DOI] [PubMed] [Google Scholar]
- 21b. Seo S., Herr A., Lim J. W., Richardson G. A., Richardson H., Kroll K. L., Genes Dev. 2005, 19, 1723–1734. [DOI] [PMC free article] [PubMed] [Google Scholar]
- 22. Gawantka V., Delius H., Hirschfeld K., Blumenstock C., Niehrs C., EMBO J. 1995, 14, 6268–6279. [DOI] [PMC free article] [PubMed] [Google Scholar]
- 23. Vastag L., Jorgensen P., Peshkin L., Wei R., Rabinowitz J. D., Kirschner M. W., PLoS One 2011, 6, e16881. [DOI] [PMC free article] [PubMed] [Google Scholar]
- 24. Ishihama Y., Oda Y., Tabata T., Sato T., Nagasu T., Rappsilber J., Mann M., Mol. Cell. Proteomics 2005, 4, 1265–1272. [DOI] [PubMed] [Google Scholar]
- 25. Moody S. A., Dev. Biol. 1987, 122, 300–319. [DOI] [PubMed] [Google Scholar]
- 26. Yanai I., Peshkin L., Jorgensen P., Kirschner M. W., Dev. Cell 2011, 20, 483–496. [DOI] [PMC free article] [PubMed] [Google Scholar]
- 27. Huang Y. F., Higginson D. S., Hester L., Park M. H., Snyder S. H., Proc. Natl. Acad. Sci. USA 2007, 104, 4194–4199. [DOI] [PMC free article] [PubMed] [Google Scholar]
- 28.
- 28a. Flachsova M., Sindelka R., Kubista M., Sci. Rep. 2013, 3, 2278; [DOI] [PMC free article] [PubMed] [Google Scholar]
- 28b. DeDomenico E., Owens N. D. L., Grant I. M., RosaGomes-Faria, Gilchrist M. J., Dev. Biol. 2015, 408, 252–268. [DOI] [PMC free article] [PubMed] [Google Scholar]
- 29. Collart C., Owens N. D. L., Bhaw-Rosun L., Cooper B., De Domenico E., Patrushev I., Sesay A. K., Smith J. N., Smith J. C., Gilchrist M. J., Development 2014, 141, 1927–1939. [DOI] [PMC free article] [PubMed] [Google Scholar]
- 30. Smits A. H., Lindeboom R. G., Perino M., van Heeringen S. J., Veenstra G. J., Vermeulen M., Nucleic Acids Res. 2014, 42, 9880–9891. [DOI] [PMC free article] [PubMed] [Google Scholar]
Associated Data
This section collects any data citations, data availability statements, or supplementary materials included in this article.
Supplementary Materials
As a service to our authors and readers, this journal provides supporting information supplied by the authors. Such materials are peer reviewed and may be re‐organized for online delivery, but are not copy‐edited or typeset. Technical support issues arising from supporting information (other than missing files) should be addressed to the authors.
Supplementary