Abstract
The proteasome is a multi-component protease complex responsible for regulating key processes such as the cell cycle and antigen presentation1. Compounds that target the proteasome are potentially valuable tools for the treatment of pathogens that depend on proteasome function for survival and replication. In particular, proteasome inhibitors have been shown to be toxic for the malaria parasite Plasmodium falciparum at all stages of its life cycle2-5. Most compounds that have been tested against the parasite also inhibit the mammalian proteasome resulting in toxicity that precludes their use as therapeutic agents2,6. Therefore, better definition of the substrate specificity and structural properties of the Plasmodium proteasome could enable the development of compounds with sufficient selectivity to allow their use as anti-malarial agents. To accomplish this goal, we used a substrate profiling method to uncover differences in the specificities of the human and P. falciparum proteasome. We designed inhibitors based on amino acid preferences specific to the parasite proteasome, and found that they preferentially inhibit the β 2 subunit. We determined the structure of the P. falciparum 20S proteasome bound to the inhibitor using cryo-electron microscopy (cryo-EM) and single particle analysis, to a resolution of 3.6 Å. These data reveal the unusually open P. falciparum β2 active site and provide valuable information regarding active site architecture that can be used to further refine inhibitor design. Furthermore, consistent with the recent finding that the proteasome is important for stress pathways associated with resistance of artemisinin (ART) family anti-malarials7,8, we observed growth inhibition synergism with low doses of this β 2 selective inhibitor in ART sensitive and resistant parasites. Finally, we demonstrated that a parasite selective inhibitor could be used to attenuate parasite growth in vivo without significant toxicity to the host. Thus, the Plasmodium proteasome is a chemically tractable target that could be exploited by next generation anti-malarial agents.
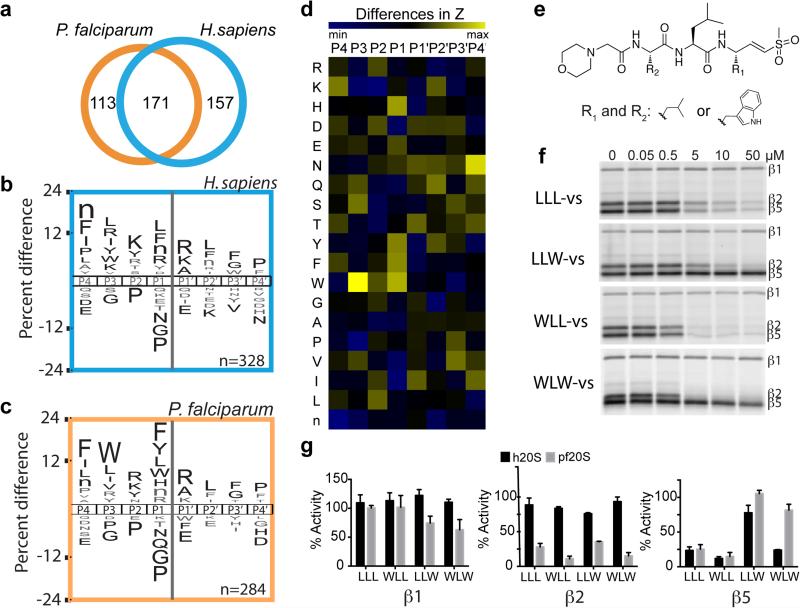
The Plasmodium proteasome represents a viable target for anti-malarial drugs due to its essential nature in protein turnover and the parasite's need to rapidly divide inside host cells9. We have previously shown that differences exist in the reliance of human cells and P. falciparum on specific proteasome activities for survival10. Therefore, we reasoned that a structural and biochemical understanding of this enzyme complex could yield compounds with desirable safety profiles due to their selectivity for the parasite proteasome. We purified the P. falciparum 20S proteasome11, activated it with human PA28α12,13 (Extended Data Fig. 1a) and determined the substrate preferences of this activated proteasome by monitoring the degradation pattern of 228 diverse synthetic tetradecapeptides using liquid chromatography-tandem mass spectrometry14,15. A frequency profile was generated using iceLogo software16, indicating which amino acids are most and least favored in the subsites surrounding each cleaved bond. In parallel, we generated a substrate specificity profile for the human 20S/PA28α proteasome under identical conditions. We detected 284 and 328 cleavage sites for the activated P. falciparum and human 20S proteasomes, respectively, with 171 sites being cleaved by both (Fig. 1a). However, 113 and 157 sites were uniquely cleaved by P. falciparum and human proteasomes, respectively (Fig. 1a-c and Extended Data Fig. 1b, c), with the major differences occurring on the amino-terminal side of the cleavage site, namely at the P1 and P3 sites. For the P1 position which is directly adjacent to the cleavage site, the human proteasome showed chymotrypsin-like (Leu/Phe/Tyr), trypsin-like (Arg) and caspase-like (Asp) activity (Fig. 1b), consistent with previous studies17, while the P. falciparum proteasome showed strong preference for aromatic residues (Fig. 1c). Direct comparison of the specificity profiles of both proteasomes revealed a clear preference for Trp at P1 and P3 in the parasite proteasome (Fig 1d, Extended Data Fig. 1b and c).
Figure 1.
Substrate profile of the activated human and P. falciparum 20S proteasome guides inhibitor design. a, Total number of cleavage sites detected after 4 hr incubation of the activated human and P. falciparum proteasome with the peptide library. The iceLogos generated from the cleavages are shown in (b) for human and (c) for P. falciparum proteasome. Amino acids that are most and least favored at each position are shown above and below the axis, respectively. Lowercase ‘n’ corresponds to norleucine and amino acids in black text are statistically significant (p < 0.05, unpaired two-tailed Student's t-test). d, The Z-score for amino acid at each position (P4-P4′) was calculated for both human and parasite proteasome based on the cleavages in a, and the difference between the Z-scores is shown as a heatmap. e, Inhibitors are designed by substituting Trp at either P1 and/or P3 position in the morpholino-capped tri-leucine vinyl sulfone. f, Inhibition of purified P. falciparum 20S as assessed by activity based probe labeling. The same experiment was repeated for the human 20S proteasome (Extended Data Figure 2b). g, Activity of each subunit in human or P. falciparum proteasome after 10 μM inhibitor treatment was determined by image quantification of the intensity of probe labeling and normalized to mock treated control. Error bars represent standard deviation (s.d.) and n=3 purified proteasome from 3 independent experiments (for gel source data, see Supplementary Fig. 1a and b).
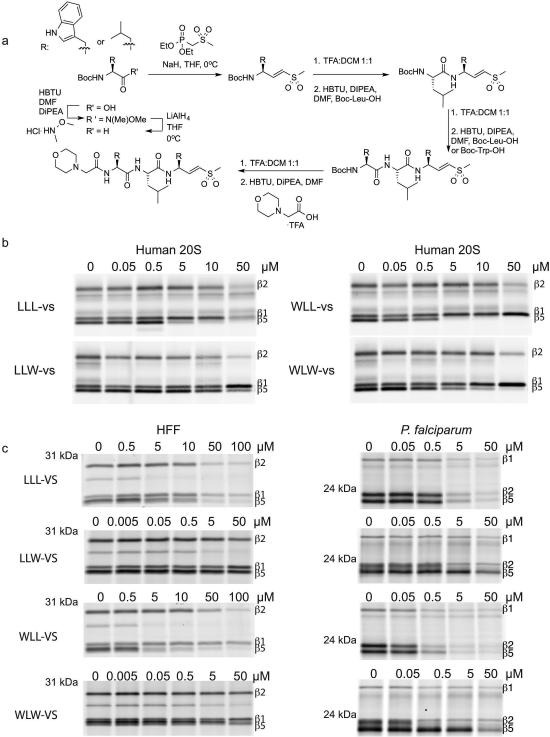
Using the canonical tri-leucine scaffold found in common proteasome inhibitors such as MG132 and Z-L3-VS18,19, we systematically replaced the Leu residues at the P1 and P3 positions with Trp, resulting in the compounds LLW-vs, WLL-vs and WLW-vs (Fig. 1e and Extended Data Fig. 2a). We treated purified P. falciparum 20S proteasomes with each compound and measured residual activity of the catalytic sites using an activity based probe10 (Fig. 1f). Changing the P1 position to Trp (LLW-vs) dramatically reduced inhibition of the β5 active site, without altering the activity towards the β2 subunit, while Trp in the P3 position (WLL-vs) resulted in potent inhibition of both β2 and β5 activities. Finally, Trp substitution in both P1 and P3 positions (WLW-vs) results in a potent inhibitor that was highly selective for the parasite β2 proteasome subunit. With the exception of LLW-vs, these compounds inhibited the human β5 subunit while all compounds only weakly inhibited the human β1 and β2 activities (Fig. 1g, Extended Data Fig. 1d & 2b). Therefore, these inhibitors primarily differ in their selectivity towards the β2 subunits and this selectivity was retained in human and P. falciparum inhibitor treatments in live culture (Extended Data Fig. 2c).
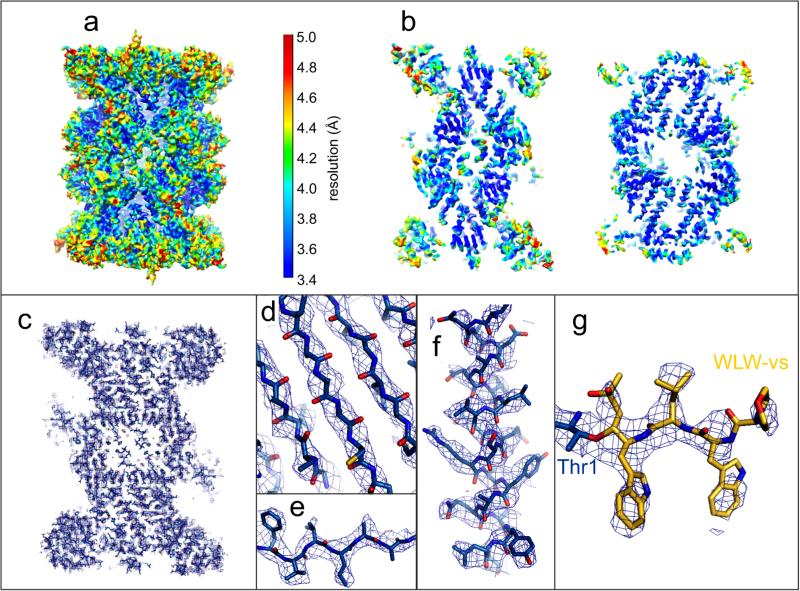
We investigated the structural basis for the β2 selectivity of the P. falciparum 20S proteasome towards WLW-vs by high resolution cryo-EM and single particle analysis, using a strategy similar to that which we previously used to determine the structure of an inhibitor bound human 20S proteasome20. The resolution of the final map was estimated at 3.6 Å (Fig. 2 and Extended Data Fig. 3a-e), with local resolution decreasing for solvent exposed surfaces (Fig 2a, b). In our map, sheet-forming β strands are well resolved (Fig. 2d) and side chains are well defined for both β strands and α helices (Fig 2e,f), particularly when stabilized by intra-protein contacts or steric restraints. We were able to unambiguously assign a clear density extending from the β2 subunit N-terminal threonine to the WLW-vs inhibitor, with the vinyl sulfone group and the WLW side chains clearly resolved in a β strand secondary structural conformation (Fig. 2g).
Figure 2.
Structure of the P. falciparum 20S proteasome core bound to the inhibitor WLW-vs, determined by cryo-EM and single particle analysis. a, The cryo-EM map is surface rendered and color coded according to local resolution as determined by ResMap. b, Sections of the map as shown in a, revealing the higher resolution at the internal regions of the complex, compared with solvent exposed surfaces. c, Section of the cryo-EM map, shown as mesh representation, showing the overall fitting of the protein model. d-g, Detailed views of the map showing clear separation of sheet forming β strands (d), good recovery of side chains, both in β strands (e) and α helices (f), and the densities for the WLW-vs inhibitor at the proteasome β2 active site (g).
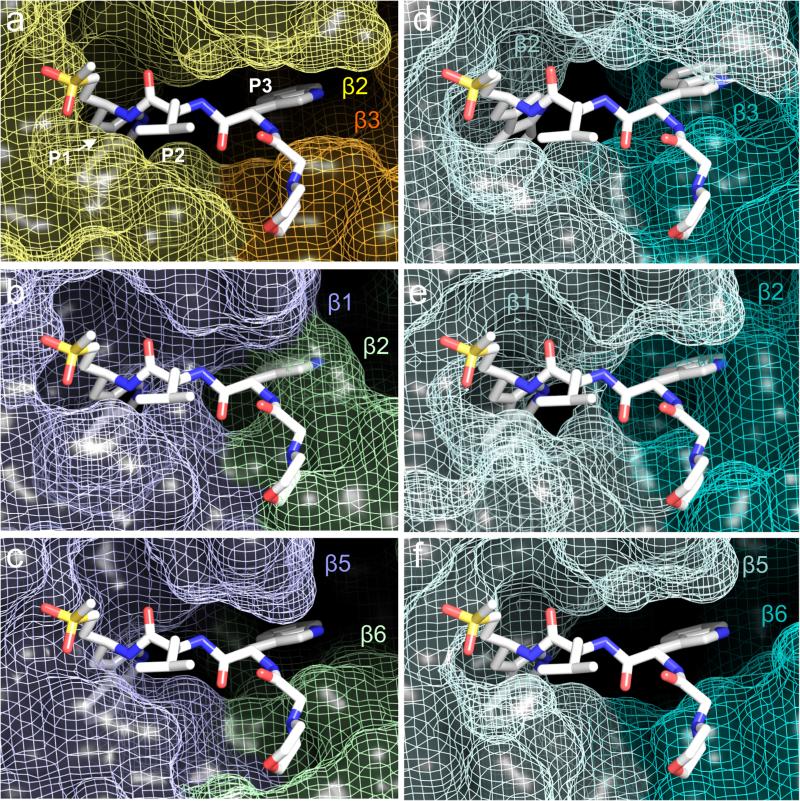
When the protein coordinates for the P. falciparum β1 and β5 subunits are aligned to those of the ligand bound β2 subunit, the resulting superimposition of the WLW-vs ligand into the β1 and the β5 active sites clearly reveals space constrains for its binding. While the more open conformation of the β2 binding pocket easily accommodates the WLW-vs side chains (Fig. 3a), the ligand overlay into the β1 and the β5 active sites results in the burying of its Trp side chains into the protein van der Waals surface (Fig. 3b,c), with the exception of the P3 position in the β5 active site (Fig. 3c). We extended this comparison to the protein coordinates of the human 20S proteasome active sites, using the coordinates of the human apo complex21 (pdb 4R3O). Superimposing the WLW-vs inhibitor onto the human apo proteasome core (Fig. 3d-f) shows its active sites have no accessibility for the P1 and P3 Trp side chains of the inhibitor, with the exception of the P3 position at the β5 active site (Fig. 3f). Similar observations can be made when using the protein model of the human proteasome core bound to the inhibitor AdaAhx3-LLL-vs (pdb 5A0Q) (Extended Data Fig. 3f-h). This structural comparison of the accessibility of P. falciparum and human proteasome active sites is consistent and explains the observed specificity of the WLW-vs inhibitor towards the P. falciparum β2 subunit, which would be difficult to predict without direct high resolution structural information. The results presented here show an important and novel application of high resolution cryo-EM to interpret the basis for the specific binding of a ligand to an active site, where the information obtained can be harnessed to guide further ligand development for therapeutic usage.
Figure 3.
Structural comparison of the P. falciparum and human proteasome 20S core active sites. a, Coordinates of the P. falciparum proteasome β2 active site bound to WLW-vs. The inhibitor P1, P2 and P3 positions are indicated. b-c, Coordinates of the P. falciparum proteasome β1 (b) and β5 (c) active sites with superimposed coordinates of the WLW-vs inhibitor, as shown in (a). d-f, Coordinates of the apo human proteasome 20S core (PDB accession code 4R3O) β2 (d), β1 (e) and β5 (f) active sites, with superimposed coordinates of the WLW-vs inhibitor, as shown in (a). In all panels the protein is represented as van der Waals surfaces and the inhibitor as sticks.
P. falciparum parasites can become resistant to killing by the frontline ART drug family22-24, however these ART treated parasites are particularly sensitive to disruption of normal proteasome function25. We previously showed that inhibition of the β5 proteasome subunit is required for attenuation of P. falciparum growth10. However, we reasoned that a sub-lethal dose of the Plasmodium β2 selective inhibitor WLW-vs may still be sufficient to enhance killing by ART in both sensitive and resistant parasites. When laboratory-adapted clinical isolates were treated at the early ring stage of the intraerythrocytic cycle, ART resistant parasites (PL7) showed close to 2-fold higher sensitivity to WLW-vs than ART sensitive parasites (PL2) (Fig. 4a). In addition, we observed synergism between dihydroarteminisin (DHA) and WLW-vs at concentrations where WLW-vs selectively inhibits the β2 subunit of the Plasmodium proteasome (Fig. 4b; Extended Data Fig. 4a). As parasites are normally insensitive to a pulse inhibition of the proteasome β2 active site alone10, this underlines the heightened sensitivity of P. falciparum to proteasome inhibition in the presence of DHA.
Figure 4.
Exploiting differences in the β2 subunits of the two proteasome species for selective parasite killing. a-b, β2 subunit selective inhibitor WLW-vs can synergize with DHA treatment in ART-resistant P. falciparum. a, Viability 72 hr after a 1 hr treatment of ART sensitive (PL2) and resistant (PL7) parasites at early ring stage (2 hr post-invasion, n=2 parasite cultures) with WLW-vs (abbreviated as WLW). b, Left panel shows the dose-response to DHA in the absence and presence of sublethal doses of WLW-vs. Right panel shows the isobologram of the two inhibitors at the 50% lethal dose (LD50). PL7 parasites were treated for 3 hr at early ring stage (4 hr post-invasion). a-b, data shown are for individual data points that is representative of two technical replicates. c-e, WLL-vs co-inhibits β2 along with the other two catalytic subunits, resulting in potent parasite killing. c, Human foreskin fibroblasts (HFF) or P. falciparum schizonts were treated with WLL-vs for 1 hr, and activity based probe labeling was performed post-lysis (for gel source data, see Supplementary Fig. 1c and d). Fluorescent gel scan (top) and silver stain (bottom) are shown. d, Non-confluent, replicating HFFs (n=9 cell culture, from 3 independent experiments of triplicates) or P. falciparum at ring stage (n=6 parasite cultures, from 2 independent experiments of triplicates) was pulse-treated for 1 hr with WLL-vs and viability was determined after 71 hr. Activities of the P. falciparum proteasome subunits after inhibitor treatment were determined as described in methods. (n= 3 parasite lysates from 3 independent experiments). Error bars represent s.d. e, Balb/c female mice were infected with P. chabaudi and treated with a single I.V. dose of vehicle (n=6 mice) or 35 mg/kg WLL-vs (n=6 mice) on day 3 post-infection (arrow). Parasitemia and weight of the mice were monitored daily until the infection was resolved naturally by the host (day 7 onwards). Error bars represent s.d.
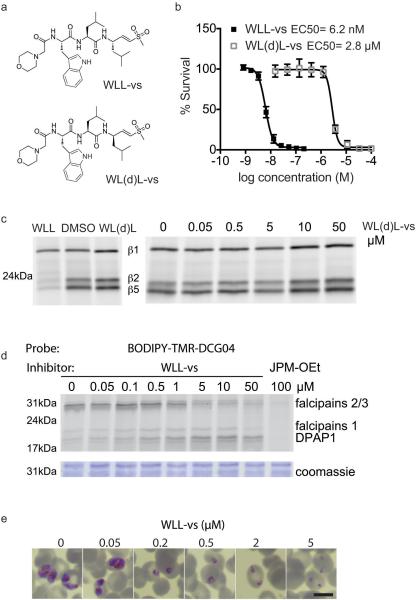
We have previously shown that co-inhibition of the Plasmodium proteasome β2 and β5 subunits results in complete parasite growth attenuation at all stages of its blood cycle, even after short inhibitor treatment times10. WLL-vs is a potent inhibitor of the parasite β2 and β5 active sites, while only effective against the human β5 activity (Fig. 1g, Fig. 3 and Extended Data Fig. 1d-e). WLL-vs is therefore likely to have potent anti-malarial activity with minimal toxicity to the host, since a short inhibition of host β5 activity is well tolerated in most mammalian cells26. We treated live P. falciparum cultures and primary human fibroblasts for 1 hr with WLL-vs, and were surprised to find that WLL-vs inhibited all 3 proteasome catalytic sites in P. falciparum, while having little effect on any of the human subunits until high micromolar concentrations (Fig. 4c). This increased potency is likely due to inhibitor accumulation in the intact parasites and enhanced inhibition of the parasite 26S proteasome (20S with regulatory subunit 19S proteasome complex)27. This translated into a large therapeutic window for the WLL-vs inhibitor in 1 hr and 72 hr viability assays (Fig. 4d and Extended Data Fig. 1e). Although the P. falciparum proteasome inhibition corresponds well to the decrease in parasite survival (Fig. 4d), we sought to determine if off-target toxicity was occurring. First, a diastereomer of WLL-vs containing a P1 (D)-Leu (WL(d)L-vs) showed a dramatic reduction in compound potency (Extended Data Fig. 5a-c) indicating that these compounds were not indiscriminately cytotoxic. Second, vinyl-sulfones can react with cysteine proteases28 and, therefore, we assessed reactivity of WLL-vs towards P. falciparum cysteine proteases using the activity based probe BODIPY-TMR-DCG0429. We observed inhibition of cysteine proteases with WLL-vs only at concentrations that are >10-fold over the 1 hr EC50 (Extended Data Fig. 5d). Third, we assessed parasite morphology 24 hours after a 1 hr WLL-vs pulse treatment and observed arrested parasite development and eventual parasite death at high inhibitor concentrations (Extended Data Figure 5e). The absence of a food vacuole defect indicated that the falcipains in this digestive organelle were not significantly inhibited. Taken together, these data confirm that WLL-vs exerts its anti-malarial effects through direct proteasome inhibition.
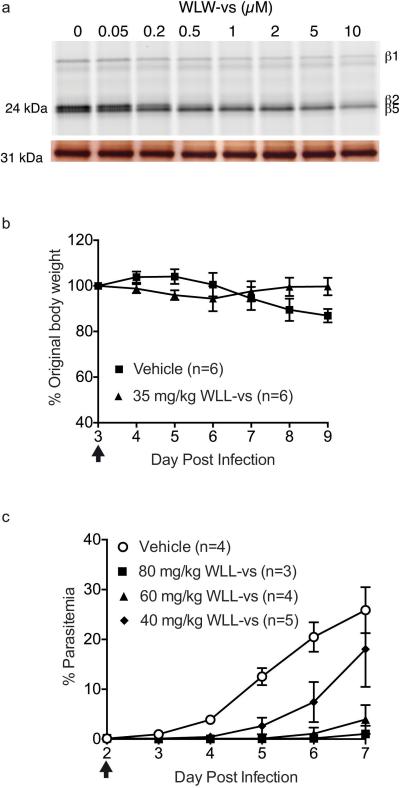
Given the large therapeutic window of WLL-vs, we assessed its efficacy in a rodent Plasmodium chabaudi infection model. We infected Balb/c female mice with 1 million parasites and treated 3 days later using a single bolus dose of 35 mg/kg WLL-vs or vehicle, via tail vein injection. We observed almost complete reduction of parasite burden following WLL-vs treatment (Fig. 4e) and good tolerance to the drug as assessed by appearance, activity and weight retention (Extended Data Fig. 4b). The efficacy of this treatment was further confirmed in an intra-peritoneal single bolus dosing study of P. chabaudi infected mice (Extended Data Fig. 4c).
In summary, we have shown through biochemical and structural studies that the Plasmodium proteasome is sufficiently unique from the human proteasome for selective targeting. Furthermore we show that even sub-lethal doses of proteasome inhibitor can lead to parasite sensitization to ART. Our lead molecule, WLL-vs, is a mechanism-based peptidic inhibitor that is chemically similar to the FDA approved drug Kyprolis. We recognize that the unique disease epidemiology of malaria calls for stringent criteria in drug safety, stability and delivery and we are currently optimizing WLL-vs to generate a class of compounds with improved potency and oral bioavailability. Previous success in optimizing peptide-based agents30 for efficient oral delivery offers promise in this class of inhibitors as next generation anti-malarials.
Methods
Materials for substrate profiling
Proteasome substrates Suc-LLVY-amc and human 20S proteasome were purchased from Boston Biochem. The Plasmodium falciparum 20S proteasome was purified as previously reported11. The human PA28α is a generous gift from Boston Biochem. Peptide library for substrate cleavage profiling is used as described in (15).
Fluorogenic substrate assay
Substrate assays were performed in black 96-well COSTAR plates. For these assays purified human or P. falciparum 20S proteasomes were activated using human PA28α13. Each enzyme was added to a final concentration of 1 nM and the reaction proceeded in the presence of 12.5 μM Suc-LLVY-amc for 1 hr at room temperature. The slope over the linear range of the reaction was determined for each of the enzymes. All experiments were performed at least in triplicates.
Multiplex substrate profiling of human and Plasmodium proteasomes
The peptide library consisting of 228 tetradecapeptides was designed according to an algorithm previously reported15. Peptides were split into 2 pools of 114 for optimal LC separation. P. falciparum and human 20S proteasomes were assayed at 2 nM, in the presence of 24 nM of PA28α and 500 nM of each peptide. All assays were performed at room temperature in 20 mM HEPES, pH 7.5 and 0.5 mM EDTA. Aliquots were removed and acid quenched to pH 3.0 or less with formic acid (4% final) after 15, 60 and 240 minutes incubation. A control sample lacking enzyme was also prepared under identical conditions to account for non-enzymatic degradation of the substrates. Each sample was desalted with C18 tips (Rainin) and ~130 ng of total peptide was injected for mass spectrometry analysis. Peptide separation was performed using an EZ-Spray C18 column (Thermo, ES800, PepMap, 3 μm bead size, 75 μm × 15 cm). Reverse phase chromatography was performed at a flow rate of 600 nL/min for loading and 300 nL/min for using a nanoACUITY (Waters) ultra-performance liquid chromatography (UPLC) instrument. A 60 minute linear gradient from 2% to 30% acetonitrile in 0.1% formic acid was used and mass spectrometry was performed on a LTQ Orbitrap XL. Survey scans were recorded over a 350-1500 m/z range, and peptide fragmentation was induced with collision-induced dissociation (CID) for MS/MS. CID fragmentation was performed on the six most intense precursor ions, with a minimum of 1,000 counts, using an isolation width of 2.0 amu, with 35% normalized collision energy. Data were analyzed as previously reported using the in-house PAVA software to generate centroid peak lists, Protein Prospector software v. 5.10.15 for data searches and iceLogo software for visualization of amino acid frequency surrounding the cleavage sites15. The Z-score is calculated using the standard formula and indicates deviation from the mean frequency of s specific amino acid on a specific position in a reference set of sequences.
P. falciparum replication assays
P. falciparum D10 cultures were maintained, synchronized and lysed as previously described11. P. falciparum D10 was obtained originally from Malaria Research and Reference Reagent Resource Center (MR4). Parasite cultures were grown in human erythrocytes (no blood type discrimination) purchased from the Stanford Blood Center (approved by Stanford University). Ring stage P. falciparum culture at 2% parasitemia and 0.5 % hematocrit was added to 96-well plates spotted with compounds. The P. falciparum culture was incubated with each compound for 1 hr and 72 hr. After 1 hr compound treatment, the inhibitor was removed and the culture was washed 3 times in media, before fresh media was added for a further 71 hr of growth. After incubation the culture was fixed in a final concentration of 1% para-formaldehyde (in PBS) for 30 min at room temperature. The nuclei stain YOYO-1 was then added to a final concentration of 50 nM and incubated overnight at 4°C. Parasite replication was monitored by observation of a YOYO-1 positive population (infected) and YOYO-1 negative population (uninfected) using a BD Accuri™ C6 automated flow cytometer. Values in Extended Data Fig. 1e are the average ± standard deviation. n=6 parasite cultures from 2 independent experiment of triplicates.
Cell viability assay in mammalian cells
Human foreskin fibroblasts (HFF) used in all experiments are non-transformed primary cells (obtained from John Boothroyd, Stanford University) derived from human foreskin tissues and tested for mycoplasma contamination. HFF were plated at 2500 cells (non-confluent) per well <24 hr before addition of the compound. Compounds were diluted for dose response concentrations in media, and added to the cells for 72 hr. Cell viability was measured using the CellTiter-Blue® Assay (Promega) as per the manufacturer's instructions. Values in Extended Data Fig. 1e are the average ± standard deviation. n=9 cell cultures from 3 independent experiments of triplicates for HFF treatment, except for 1hr WLW-vs, 1hr LLW-vs and 72 hr LLL-vs, where n=6 cell cultures from 2 independent experiment of triplicates.
Activity-based probe labeling of mammalian and P. falciparum proteasome
BMV037 was used at a final concentration of 10 μM to label P. falciparum proteasome activity and MV151 was used at a final concentration of 2 μM to label mammalian proteasome activity. Purified proteasomes (human or P. falciparum, 10 nM) were incubated with each inhibitor for 1 hr at 37°C before addition of BMV037 or MV151 for a further 2 hr at 37°C. Samples were denatured by addition of SDS sample buffer, boiled briefly and ran on a 12% SDS PAGE. Gels were scanned on the Cy5 channel (for BMV037) or the Cy3 channel (for MV151) on a Typhoon Scanner (GE Healthcare). Quantification of the intensity of the labeled proteins was done using Image J. A small amount of activation in the β1 subunit was observed in the human proteasome after inhibitor treatment.
Assessment of P. falciparum proteasome activity in intact inhibitor treated parasites
P. falciparum was cultured to around 10% parasitemia to ensure sufficient parasite is available for proteasome labeling. P. falciparum culture was first treated for the indicated amount of time, and spun down at 3200 rpm to remove inhibitor. Each culture was then washed once in fresh media and P. falciparum lysate obtained as previously described11. Proteasome labeling of the parasite lysate was performed as described above. To assess proteasome inhibition, the intensity of the proteasome labeling was quantified by Image J and the amount of proteasome inhibition was taken as a percentage of the DMSO treated control.
Assessment of WLL-vs activity and DHA synergism against ART sensitive and resistant P. falciparum
Sensitivity of PL2 and PL7 P. falciparum strains (at 2 hr post-invasion) to a 1-hr pulsed treatment with WLW-vs was determined as described previously25. Interactions between DHA and WLW-vs against the K13 mutant strain, PL7, exposed to a 3-hr pulsed treatment was determined at 4 hr post-invasion as described previously25.
In vivo assessment of WLL-vs
All mouse experiments were approved by the Stanford Administration Panel on Laboratory Animal Care and strictly followed their specific guidelines. Sample size was determined based on the minimum number of animals required for good data distribution and statistics. We ensured all animals in vehicle and compound treated group had similar body weight before treatment. No inclusion or exclusion criteria were used as animals were randomly chosen for each group. No blinding was performed between the groups. For each drug assay, Balb/c female mice (~20 g, 6-8 weeks old) were infected by intraperitoneal (I.P) injection with 1×10⁶ P. chabaudi parasites isolated from an infected mouse on Day 0. For the experiment presented in Fig. 4, the infected mice were dosed 3 days post infection with a single bolus tail vein injection of either vehicle (n=6) comprising of 10% DMSO, 10% (2-Hydroxypropyl)-β-cyclodextrin in sterile PBS or WLL-vs (n=6) formulated in the vehicle. For experiment presented in Extended Data Fig. 4c, the infected mice were dosed 2 days post infection with a single bolus intra-peritoneal injection of either vehicle (45% polyethylene glycol (M.W. 400), 35% propylene glycol, 10% ethanol, 10% DMSO and 10% w/v 2-hydroxyproyl-β-cyclodextrin) or WLL-vs at 40 mg/kg, 60 mg/kg and 80 mg/kg formulated in the vehicle. Both of the treatments were administered at night (9 pm). Parasitemia was monitored daily by thin blood smears obtained from the tail vein and quantified by light microscope counting, where a minimum of 5 fields, each containing at least 400 red blood cells, were counted. The health of the mice was also monitored daily by measuring their body weight and by assessment of their appearance and activity.
Assessment of P. falciparum cysteine protease activities
A mixed stage culture of red blood cells infected with P. falciparum D10 was treated with a range of concentrations of WLL-vs for 1 hr at 37°C. 2 μM of BODIPY-TMRDCG04 was then added to the culture for a further 1 hr for live cell labeling of the activities of the parasitic cysteine proteases. 100 μM of JPM-OEt27 was added as a positive control. After probe labeling, the parasite pellet was isolated by saponin lysis and kept at −80°C. For further analysis, the samples were thawed at 4°C and lysed directly in sample buffer and loaded onto a 15% SDS-PAGE. Fluorescence of the probe was detected using the Typhoon as described above.
Giemsa stain of WLL-vs treated P. falciparum culture
P. falciparum culture at mid-ring (9-12 hr post-invasion) was treated with DMSO or WLL-vs for 1 hr at 37°C and the inhibitor was removed. The culture was washed in media and left to grow in fresh media for a further 23 hrs. Culture was then spun down and the red blood cell pellet used to make a thin blood smear on glass slides, fixed with methanol and stained with Giemsa stain for light microscopy.
Chemical synthesis
The detailed procedures for chemical synthesis are presented in Supplementary Information.
Cryo-EM data acquisition
A sample of P. falciparum 20S proteasome core was diluted in 50 mM Tris-HCl, pH 7.5, 5 mM MgCl2 and 1 mM dithiotreitol, to a concentration of 0.14 μM (0.1 mg ml−1), and incubated in the presence of 10 μM WLW-vs for 1 hour at 37°C. The sample was applied onto Quantifoil 1.2/1.3 electron microscope grids that were coated with a thin layer of carbon, freshly floated from mica, and glow-discharged in air. The grids were flash frozen by plunging into liquid ethane using a Vitrobot (FEI), operated at 22°C and 95% humidity, with a 2.5 s blot time. The grids were transferred into a FEI Titan Krios microscope, operated at an acceleration voltage of 300 keV and a nominal magnification of ×75,000 (yielding a calibrated sampling of 1.04 Å pixel−1 at the image level). Images were recorded (from a single cryo-EM grid and during a single cryo-EM session) on a Falcon II direct electron detector, using EPU software, at a range of 1.70-3.16 μm underfocus and 1s exposure time (Extended Data Fig. 3a). For each exposure 17 individual frames were captured at a rate of 0.056 s frame−1, each corresponding to an electron dose of 2.8 e− Å−2. For each exposure the image corresponding to the sum of all frames was used for screening for optimal ice thickness and image stability, as assessed by the isotropic recovery of Thon rings in their power spectra. From the 2603 images recorded, 1816 were selected for further processing.
Image processing
We used the same strategy for image analysis as for the recent determination of the structure of an inhibitor bound human 20S proteasome core20. For each exposure selected for image analysis, the sum of all frames captured was used to determine the defocus and astigmatism parameters, using the Tigris program findctf, and for particle selection, performed automatically in Relion31. This automated particle selection was carefully supervised with the manual removal of false positives and addition of false negatives. Further processing was performed using the sum of frames 3-10 of each exposure, effectively acquired within 0.45 seconds and corresponding to a total accumulated electron dose of 28 e− Å−2. This frame selection aimed at an adequate signal-to-noise, for accurate determination of particle orientation, and the preservation of high resolution information, as previously discussed20. The phases of the resulting images were corrected for the contrast transfer function by phase flipping with the Tigris program flipctf, using the image defocus and astigmatism parameters determined as described above. Selected particle images were then extracted into 256×256 pixel boxes, resulting in a data-set of 97,720 particles. The single particle analysis refinement routine was performed using C2 symmetry and used the cryo-EM structure of the human 20S proteasome core (Electron Microscopy Data Bank accession code EMD-2981) as starting reference. This routine consisted of rounds of alignment and Euler angle assignment by projection matching, using the program AP SH of the Spider software package32, 3D reconstruction, using icr3d (which includes correction for the amplitude component of the contrast transfer function), and forward projection, using icr3dpro. The icr3d and icr3dpro programs are implemented in Tigris, a software package publicly available at sourceforge.net. A resolution limited approach was used in order to avoid noise over-fitting during refinement, where the 3D map obtained in each refinement cycle was carefully inspected, masked and Fourier low-pass filtered to a conservative threshold in preparation of the reference for the next cycle. The surface representations of the final map as determined by the icr3d software (Fig. 2a,b), without further sharpening, Fourier filtering or masking, were created using UCSF Chimera33 and color coded according to local resolution as determined by ResMap34.
Molecular modeling
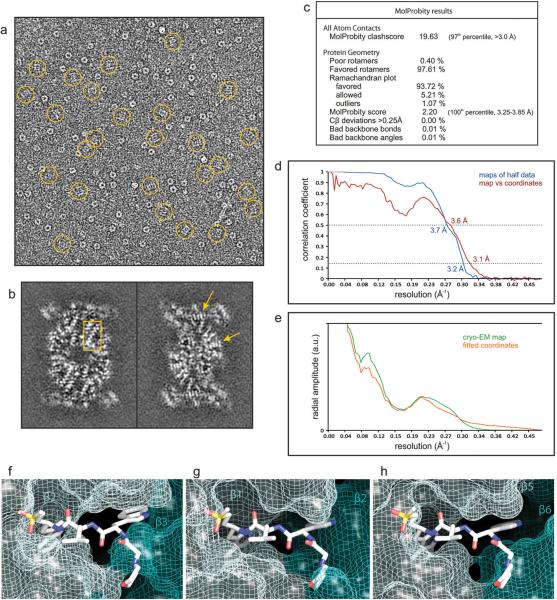
Molecular models for each of the P. falciparum proteasome 20S core subunits were originally obtained using the Phyre2 Protein Homology Recognition Engine35, using the sequences deposited in the PlasmoDB (Plasmodium Genomics Resource). A preliminary fitting of these models was performed using Molecular Dynamics Flexible Fitting (MDFF)36, which was followed by real space refinement in Coot37 and Phenix38. Protein regions that were not well recovered in our map were not modelled. The final model was checked for geometry, close contacts and bond parameters using MolProbity39. The statistics obtained (Extended Data Fig. 3c) compare favorably with those for models determined by X-ray crystallography at similar resolutions, indicating that there was no over-fitting during model building. The resolution of the cryo-EM map can therefore be assessed by Fourier shell correlation against a density map generated from these coordinates, yielding a value of about 3.6 Å (Extended Data Fig. 3d). The mesh representations of the final map showing the fitted coordinates of the P. falciparum 20S proteasome core (Fig. 2c-g) were created using the PyMOL Molecular Graphics System. For these representations the map was sharpened with a B-factor of -50 and Fourier low-pass filtered to 3.6 Å.
Extended Data
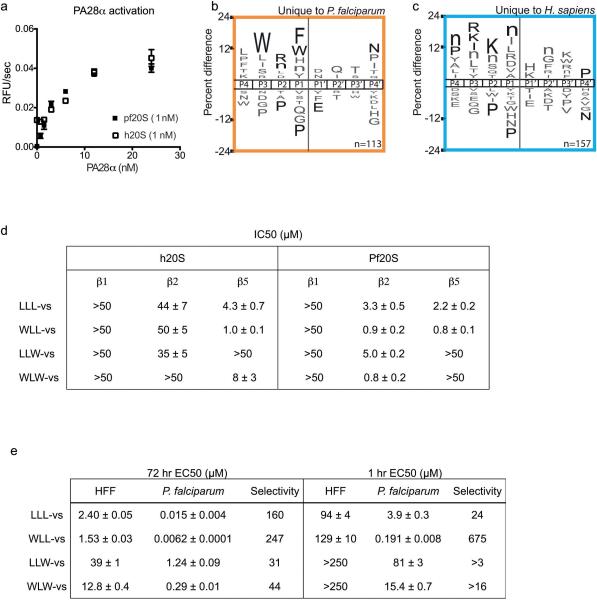
Extended Data Figure 1.
(a-c) Substrate cleavage profile of activated human and P. falciparum 20S proteasome. a, Activation of the human and P. falciparum 20S proteasome by human PA28α. Activity was determined by cleavage of the fluorogenic substrate Suc-LLVY-amc. Error bars represent s.d. and n=3 purified proteasome in technical replicates. b and c, iceLogos of cleavage sequences that are uniquely processed by either the P. falciparum (b) or human proteasome (c). Amino acids that are most and least favored at each position are shown above and below the axis, respectively. Lowercase ‘n’ corresponds to norleucine and amino acids in black text are statistically significant (p < 0.05, unpaired two-tailed Student's t-test). (d-e) Inhibition potencies of the vinyl sulfone inhibitors. d, Table of IC50 values for each inhibitor in 1 hr P. falciparum and human 20S proteasome. IC50 values are determined from 3 independent experiments of inhibitor pretreatment followed by activity labeling of the 20S proteasome (n=3 purified proteasome). Gels in Fig. 1f and Extended Data Figure 2b were quantified to calculate the IC50 values (for gel source data and replicates, see Supplementary Fig. 1 a-b). Data is mean ± s.d. e, Table of EC50 values for each of the inhibitors in 1 hr and 72 hr treatment of P.falciparum at ring stage or non-confluent human foreskin fibroblasts (HFF). Data is mean ± s.d. n=6 parasite cultures from 2 independent experiment of triplicates for P. falciparum treatments. n=9 cell cultures from 3 independent experiments of triplicates for HFF treatment, except for 1hr WLW-vs, 1hr LLW-vs and 72 hr LLL-vs, where n=6 cell cultures from 2 independent experiment of triplicates.
Extended Data Figure 2.
Proteasome inhibitors preferentially inhibit β2 of the P. falciparum proteasome. a, Vinyl sulfone inhibitors are synthesized from the Boc-protected amino acid by first generating the Weinreb amide, followed by the Horner-Wadsworth-Emmons reaction and standard peptide coupling. b, Purified human 20S proteasome was pre-treated for 1 hr at 37°C with each inhibitor followed by addition of activity based probe MV1511 to assess for human proteasome activities (for gel source data, see Supplementary Fig. 1b). c, Human foreskin fibroblasts (HFF) or P. falciparum culture was treated for 1 hr at 37°C with each inhibitor, followed by compound washout and post-lysis activity based probe labeling. Gel shown for WLL-vs in P.falciparum is derived from Fig 4c at the indicated concentrations to allow for direct comparison with other compounds (for gel source data, see Supplementary Fig. 1e).
Extended Data Figure 3.
(a-e) Evaluation of the single particle analysis of the P. falciparum 20S proteasome core bound to the inhibitor WLW-vs. a, cryo-EM image of the sample analyzed, with molecular images of side views of the complex (normal to its long axis) indicated by rings. The image greyscale was inverted in order to show the protein densities in white. b, Individual sections of the 3D map, as determined by the 3D reconstruction algorithm (without further sharpening, masking or Fourier filtering), are represented as grey scale. These sections are 1 Å thick and reveal the quality of the reconstruction, as the protein densities are clearly resolved against a very smooth background, with regions showing the pattern of α-helices (box) and the clear separation of sheet forming β strands (arrows) indicated. c, Evaluation of the model of the P. falciparum 20S proteasome core using MolProbity2. d, Resolution estimate of the cryo-EM map by Fourier shell correlation. The curves correspond to the correlation obtained against the protein model (red) and the correlation between maps determined from two halves of the data (blue). The resolution was estimated from the curve against the model where the 0.5 correlation coefficient criterion3 yields an estimate of 3.6 Å. The correlation coefficient can be seen to fall to a local minimum at ~6 Å and then recover at higher resolutions for both FSC curves. This behavior is consistent with the rotationally averaged amplitude spectra of both the cryo-EM map and the coordinates (e). This region of the amplitude spectra contains reduced structural information, typical of protein scattering, indicating that these effects in the FSC curves arise from a genuine local reduction in the signal:noise ratio. (f-h) Accessibility of the human 20S proteasome active sites to the inhibitor WLW-vs, using the protein model of the human proteasome core complex bound to a LLL-vs inhibitor4. Protein coordinates of the human proteasome 20S core (PDB accession code 5a0q) β2 (f), β1 (g) and β5 (h) active sites were aligned to the coordinates of the P. falciparum proteasome β2 subunit bound to the WLW-vs inhibitor. The model of the human 20S proteasome active sites is represented as van der Waals surfaces with the superimposed WLW-vs inhibitor shown as sticks.
Extended Data Figure 4.
Intact cell treatment and in vivo treatment of vinyl sulfone inhibitors. a, WLW-vs was incubated in early trophozoite P. falciparum culture for 3 hrs, washed out and the parasite lysate was incubated with probe BMV037. Top gel shows the fluorescent scan and bottom gel shows the silver stain. For gel source data, see Supplementary Fig. 1f. b, Body weight of WLL-vs and vehicle treated Balb/c mice after compound treatment via tail vein injection (Figure 4 e) and is expressed as a percentage of the original body weight on Day 3 before compound treatment. Body weight of vehicle treated mice decreased after day 6 of infection as part of the response to the natural resolution of the P. chabaudi infection. Treatment day is indicated by arrow. n= 6 mice for each group and error bars represent s.d. e, Balb/c female mice infected with 1 million P. chabaudi parasites from passage host on Day 0 were treated with a single bolus dose of vehicle (45% polyethylene glycol (M.W. 400), 35% propylene glycol, 10% ethanol, 10% DMSO and 10% w/v 2-hydroxyproyl-β-cyclodextrin; n=4 mice) or WLL-vs at 40 mg/kg (n= 5 mice), 60 mg/kg( n=4 mice) and 80 mg/kg (n=3 mice) formulated in the vehicle. Treatment was performed on Day 2 post infection as indicated by the arrow and administered by intra-peritoneal injection. Parasitemia was monitored daily by Giemsa stain of thin blood smears. Error bars represent s.d.
Extended Data Figure 5.
Assessing off-target activities of WLL-vs a. Structures of WLL-vs and its diastereomer WL(d)L-vs. b, Dose response curves of WLL-vs and WL(d)L-vs after 72 hr treatment in P. falciparum. Error bars represent s.d. (n=6 parasite cultures for WLL-vs from triplicates of 2 independent experiments and n=8 parasite cultures for WL(d)L-vs over 3 independent experiments) . c, Purified P. falciparum 20S proteasome was treated for 1 hr at 37°C with 10 μM of WLL-vs and WL(d)L-vs (left) or a range of concentrations of WL(d)L-vs. Residual activity was assessed by probe BMV037 (for gel source data, see Supplementary Fig. 1g). d, A mixed-stage culture of P. falciparum was treated for 1 hr with WLL-vs at 37°C, followed by BODIPY-TMRDCG04 for a further 1 hr. Samples were directly loaded onto the SDS-PAGE for analysis. 100 μM JPM-OEt was included as positive control. The fluorescent scan is shown on top and the coomassie stain is shown at the bottom. For gel source data, see Supplementary Fig. 1h). e, Geimsa stain of 1 hr treated P.falciparum ring 24 hr after inhibitor was added. Scale bar: 600 μm.
Supplementary Material
Acknowledgements
This work was support by National Institutes of Health grants R01AI078947, R01EB05011 to M.B. and by the Medical Research Council grant MC-UP-1201/5 to P.C.A.dF. H.L. was supported by an NSS-PhD scholarship from the Agency for Science, Technology and Research (A*STAR) Singapore. W.A.v.d.L. was supported by a Rubicon fellowship from the Netherlands Organization for Scientific Research (NWO). A.J.O and C.S.C were supported by the Program for Breakthrough Biomedical Research (PBBR) and the Sandler Foundation. I.T.F was supported by American Heart Association grant14POST20280004. The authors acknowledge support from the Australian Research Council and the Australian National Health and Medical Research Council. We thank Dr Kesinee Chotivanich, Faculty of Tropical Medicine, Mahidol University, Thailand, for providing PL2 and PL7 parasites. We thank Ellen Yeh's group at Stanford University for help with P. falciparum D10 culture and for use of their equipment. We thank Edward Morris and Richard Henderson for discussions on image processing, FEI fellows and C. Savva for assisting in the use of the Titan Krios microscope, S. Chen for EM support, J. Grimmet and T. Darling for computing support.
Footnotes
Author Contributions:
H.L., A.J.O., L.T., C.S.C., P.C.A.dF. and M.B. designed the experiments and wrote the manuscript. H.L., W.L. and E.Y. performed chemical synthesis and analysis. H.L, S.C.X. and I.T.F. performed the inhibitor studies. P.C.A.dF did the electron microscopy and image analysis. All authors discussed the results and commented on the manuscript.
Supplementary Information is available in the online version of this paper.
Source Data is provided for the substrate cleavage data.
Accession codes:
The cryo-EM map and the atomic coordinates of the inhibitor bound Plasmodium 20S proteasome have been deposited in the Electron Microscopy Data Bank and Protein Data Bank with the accession codes EMD-3231 and 5fmg, respectively.
References
- 1.Voges D, Zwickl P, Baumeister W. The 26S proteasome: a molecular machine designed for controlled proteolysis. Annu. Rev. Biochem. 1999;68:1015–1068. doi: 10.1146/annurev.biochem.68.1.1015. [DOI] [PubMed] [Google Scholar]
- 2.Gantt SM, et al. Proteasome inhibitors block development of Plasmodium spp. Antimicrob. Agents Chemother. 1998;42:2731–2738. doi: 10.1128/aac.42.10.2731. [DOI] [PMC free article] [PubMed] [Google Scholar]
- 3.Czesny B, Goshu S, Cook JL, Williamson KC. The Proteasome Inhibitor Epoxomicin Has Potent Plasmodium falciparum Gametocytocidal Activity. Antimicrob. Agents Chemother. 2009;53:4080–4085. doi: 10.1128/AAC.00088-09. [DOI] [PMC free article] [PubMed] [Google Scholar]
- 4.Kreidenweiss A, Kremsner PG, Mordmüller B. Comprehensive study of proteasome inhibitors against Plasmodium falciparum laboratory strains and field isolates from Gabon. Malar. J. 2008;7:187. doi: 10.1186/1475-2875-7-187. [DOI] [PMC free article] [PubMed] [Google Scholar]
- 5.Prudhomme J, et al. Marine Actinomycetes: A New Source of Compounds against the Human Malaria Parasite. PLoS ONE. 2008;3:e2335. doi: 10.1371/journal.pone.0002335. [DOI] [PMC free article] [PubMed] [Google Scholar]
- 6.Prasad R, et al. Blocking Plasmodium falciparum Development via Dual Inhibition of Hemoglobin Degradation and the Ubiquitin Proteasome System by MG132. PLoS ONE. 2013;8:e73530. doi: 10.1371/journal.pone.0073530. [DOI] [PMC free article] [PubMed] [Google Scholar]
- 7.Mok S, et al. Population transcriptomics of human malaria parasites reveals the mechanism of artemisinin resistance. Science. 2015;347:431–435. doi: 10.1126/science.1260403. [DOI] [PMC free article] [PubMed] [Google Scholar]
- 8.Mbengue A, et al. A molecular mechanism of artemisinin resistance in Plasmodium falciparum malaria. Nature. 2015;520:683–687. doi: 10.1038/nature14412. [DOI] [PMC free article] [PubMed] [Google Scholar]
- 9.Aminake MN, Arndt HD, Pradel G. The proteasome of malaria parasites: A multi-stage drug target for chemotherapeutic intervention? Int. J. Parasitol. Drugs and Drug Resist. 2012;2:1–10. doi: 10.1016/j.ijpddr.2011.12.001. [DOI] [PMC free article] [PubMed] [Google Scholar]
- 10.Li H, et al. Assessing subunit dependency of the Plasmodium proteasome using small molecule inhibitors and active site probes. ACS Chem. Biol. 2014;9:1869–1876. doi: 10.1021/cb5001263. [DOI] [PMC free article] [PubMed] [Google Scholar]
- 11.Li H, et al. Validation of the Proteasome as a Therapeutic Target in Plasmodium Using an Epoxyketone Inhibitor with Parasite-Specific Toxicity. Chem. Biol. 2012;19:1535–1545. doi: 10.1016/j.chembiol.2012.09.019. [DOI] [PMC free article] [PubMed] [Google Scholar]
- 12.Stadtmueller BM, Hill CP. Proteasome Activators. Molecular Cell. 2011;41:8–19. doi: 10.1016/j.molcel.2010.12.020. [DOI] [PMC free article] [PubMed] [Google Scholar]
- 13.Li H, et al. Identification of Potent and Selective Non-covalent Inhibitors of the Plasmodium falciparum Proteasome. J. Am. Chem. Soc. 2014;136:13562–13565. doi: 10.1021/ja507692y. [DOI] [PMC free article] [PubMed] [Google Scholar]
- 14.O'Donoghue AJ, et al. Destructin-1 is a collagen-degrading endopeptidase secreted by Pseudogymnoascus destructans, the causative agent of white-nose syndrome. Proc. Nat. Acad. Sci. USA. 2015;112:7478–7483. doi: 10.1073/pnas.1507082112. [DOI] [PMC free article] [PubMed] [Google Scholar]
- 15.O'Donoghue AJ, et al. Global identification of peptidase specificity by multiplex substrate profiling. Nat. Methods. 2012;9:1095–1100. doi: 10.1038/nmeth.2182. [DOI] [PMC free article] [PubMed] [Google Scholar]
- 16.Colaert N, Helsens K, Martens L, Vandekerckhove J, Gevaert K. Improved visualization of protein consensus sequences by iceLogo. Nat. Methods. 2009;6:786–787. doi: 10.1038/nmeth1109-786. [DOI] [PubMed] [Google Scholar]
- 17.Harris JL, Alper PB, Li J, Rechsteiner M, Backes BJ. Substrate specificity of the human proteasome. Chem. Biol. 2001;8:1131–1141. doi: 10.1016/s1074-5521(01)00080-1. [DOI] [PubMed] [Google Scholar]
- 18.Kisselev AF, van der Linden WA, Overkleeft HS. Proteasome inhibitors: an expanding army attacking a unique target. Chem. Biol. 2012;19:99–115. doi: 10.1016/j.chembiol.2012.01.003. [DOI] [PMC free article] [PubMed] [Google Scholar]
- 19.Bogyo M, et al. Covalent modification of the active site threonine of proteasomal β subunits and the Escherichia coli homolog HslV by a new class of inhibitors. Proc. Natl. Acad. Sci. USA. 1997;94:6629–6634. doi: 10.1073/pnas.94.13.6629. [DOI] [PMC free article] [PubMed] [Google Scholar]
- 20.Da Fonseca PCA, Morris EP. Cryo-EM reveals the conformation of a substrate analogue in the human 20S proteasome core. Nat. Commun. 2015;6:7573–7576. doi: 10.1038/ncomms8573. [DOI] [PMC free article] [PubMed] [Google Scholar]
- 21.Harshbarger W, Miller C, Diedrich C, Sacchettini J. Crystal structure of the human 20S proteasome in complex with carfilzomib. Structure. 2015;23:418–424. doi: 10.1016/j.str.2014.11.017. [DOI] [PubMed] [Google Scholar]
- 22.Meshnick SR. Artemisinin: mechanisms of action, resistance and toxicity. Int. J. Parasitol. 2002;32:1655–1660. doi: 10.1016/s0020-7519(02)00194-7. [DOI] [PubMed] [Google Scholar]
- 23.Ashley EA, et al. Spread of Artemisinin Resistance in Plasmodium falciparum Malaria. N. Engl. J. Med. 2014;371:411–423. doi: 10.1056/NEJMoa1314981. [DOI] [PMC free article] [PubMed] [Google Scholar]
- 24.Straimer J, et al. K13-propeller mutations confer artemisinin resistance in Plasmodium falciparum clinical isolates. Science. 2015;347:428–431. doi: 10.1126/science.1260867. [DOI] [PMC free article] [PubMed] [Google Scholar]
- 25.Dogovski C, et al. Targeting the Cell Stress Response of Plasmodium falciparum to Overcome Artemisinin Resistance. PLoS Biol. 2015;13:e1002132. doi: 10.1371/journal.pbio.1002132. [DOI] [PMC free article] [PubMed] [Google Scholar]
- 26.Britton M, et al. Selective inhibitor of proteasome's caspase-like sites sensitizes cells to specific inhibition of chymotrypsin-like sites. Chem. Biol. 2009;16:1278–1289. doi: 10.1016/j.chembiol.2009.11.015. [DOI] [PMC free article] [PubMed] [Google Scholar]
- 27.Bedford L, Paine S, Sheppard PW, Mayer RJ, Roelofs J. Assembly, structure, and function of the 26S proteasome. Trends Cell Biol. 2010;20:391–401. doi: 10.1016/j.tcb.2010.03.007. [DOI] [PMC free article] [PubMed] [Google Scholar]
- 28.Palmer JT, Rasnick D, Klaus JL, Brömme D. Vinyl sulfones as mechanism-based cysteine protease inhibitors. J. Med. Chem. 1995;38:3193–3196. doi: 10.1021/jm00017a002. [DOI] [PubMed] [Google Scholar]
- 29.Arastu-Kapur S, et al. Identification of proteases that regulate erythrocyte rupture by the malaria parasite Plasmodium falciparum. Nat. Chem. Biol. 2008;4:203–213. doi: 10.1038/nchembio.70. [DOI] [PubMed] [Google Scholar]
- 30.Zhou HJ, et al. Design and synthesis of an orally bioavailable and selective peptide epoxyketone proteasome inhibitor (PR-047). J. Med. Chem. 2009;52:3028–3038. doi: 10.1021/jm801329v. [DOI] [PubMed] [Google Scholar]
- 31.Scheres SHW. Semi-automated selection of cryo-EM particles in RELION-1.3. J. Struct. Biol. 2015;189:114–122. doi: 10.1016/j.jsb.2014.11.010. [DOI] [PMC free article] [PubMed] [Google Scholar]
- 32.Frank J, Radermacher M, Penczek P, Zhu J, Li Y. SPIDER and WEB: processing and visualization of images in 3D electron microscopy and related fields. J. Struct. Biol. 1996;116:190–199. doi: 10.1006/jsbi.1996.0030. [DOI] [PubMed] [Google Scholar]
- 33.Pettersen EF, et al. UCSF Chimera--a visualization system for exploratory research and analysis. J. Comput. Chem. 2004;25:1605–1612. doi: 10.1002/jcc.20084. [DOI] [PubMed] [Google Scholar]
- 34.Kucukelbir A, Sigworth FJ, Tagare HD. Quantifying the local resolution of cryo-EM density maps. Nat. Methods. 2014;11:63–65. doi: 10.1038/nmeth.2727. [DOI] [PMC free article] [PubMed] [Google Scholar]
- 35.Kelley LA, Mezulis S, Yates CM, Wass MN, Sternberg MJE. The Phyre2 web portal for protein modeling, prediction and analysis. Nat. Protoc. 2015;10:845–858. doi: 10.1038/nprot.2015.053. [DOI] [PMC free article] [PubMed] [Google Scholar]
- 36.Trabuco LG, Villa E, Mitra K, Frank J, Schulten K. Flexible fitting of atomic structures into electron microscopy maps using molecular dynamics. Structure. 2008;16:673–683. doi: 10.1016/j.str.2008.03.005. [DOI] [PMC free article] [PubMed] [Google Scholar]
- 37.Emsley P, Lohkamp B, Scott WG. Features and development of Coot. Acta Crystallogr. D. 2010;66:486–501. doi: 10.1107/S0907444910007493. [DOI] [PMC free article] [PubMed] [Google Scholar]
- 38.Afonine PV, et al. Towards automated crystallographic structure refinement with phenix.refine. Acta Crystallogr. D. 2012;68:352–367. doi: 10.1107/S0907444912001308. [DOI] [PMC free article] [PubMed] [Google Scholar]
- 39.Chen VB, et al. MolProbity: all-atom structure validation for macromolecular crystallography. Acta Crystallogr. D. 2010;66:12–21. doi: 10.1107/S0907444909042073. [DOI] [PMC free article] [PubMed] [Google Scholar]
Extended Data References
- 1.Verdoes M, et al. A Fluorescent Broad-Spectrum Proteasome Inhibitor for Labeling Proteasomes In Vitro and In Vivo. Chem. Biol. 2006;13:1217–1226. doi: 10.1016/j.chembiol.2006.09.013. [DOI] [PubMed] [Google Scholar]
- 2.Chen VB, et al. MolProbity: all-atom structure validation for macromolecular crystallography. Acta Crystallographica Section D. 2010;66:12–21. doi: 10.1107/S0907444909042073. [DOI] [PMC free article] [PubMed] [Google Scholar]
- 3.Rosenthal PB, Henderson R. Optimal determination of particle orientation, absolute hand, and contrast loss in single-particle electron cryomicroscopy. J Mol Biol. 2003;333:721–745. doi: 10.1016/j.jmb.2003.07.013. [DOI] [PubMed] [Google Scholar]
- 4.da Fonseca PCA, Morris EP. Cryo-EM reveals the conformation of a substrate analogue in the human 20S proteasome core. Nat Commun. 2015;6:7573–7576. doi: 10.1038/ncomms8573. [DOI] [PMC free article] [PubMed] [Google Scholar]
Associated Data
This section collects any data citations, data availability statements, or supplementary materials included in this article.


