

Abstract
Background
Fibromyalgia is a clinically well‐defined chronic condition with a biopsychosocial aetiology. Fibromyalgia is characterized by chronic widespread musculoskeletal pain, sleep problems, cognitive dysfunction, and fatigue. Patients often report high disability levels and poor quality of life. Since there is no specific treatment that alters the pathogenesis of fibromyalgia, drug therapy focuses on pain reduction and improvement of other aversive symptoms.
Objectives
The objective was to assess the benefits and harms of selective serotonin reuptake inhibitors (SSRIs) in the treatment of fibromyalgia.
Search methods
We searched the Cochrane Central Register of Controlled Trials (CENTRAL; 2014, Issue 5), MEDLINE (1966 to June 2014), EMBASE (1946 to June 2014), and the reference lists of reviewed articles.
Selection criteria
We selected all randomized, double‐blind trials of SSRIs used for the treatment of fibromyalgia symptoms in adult participants. We considered the following SSRIs in this review: citalopram, fluoxetine, escitalopram, fluvoxamine, paroxetine, and sertraline.
Data collection and analysis
Three authors extracted the data of all included studies and assessed the risks of bias of the studies. We resolved discrepancies by discussion.
Main results
The quality of evidence was very low for each outcome. We downgraded the quality of evidence to very low due to concerns about risk of bias and studies with few participants. We included seven placebo‐controlled studies, two with citalopram, three with fluoxetine and two with paroxetine, with a median study duration of eight weeks (4 to 16 weeks) and 383 participants, who were pooled together.
All studies had one or more sources of potential major bias. There was a small (10%) difference in patients who reported a 30% pain reduction between SSRIs (56/172 (32.6%)) and placebo (39/171 (22.8%)) risk difference (RD) 0.10, 95% confidence interval (CI) 0.01 to 0.20; number needed to treat for an additional beneficial outcome (NNTB) 10, 95% CI 5 to 100; and in global improvement (proportion of patients who reported to be much or very much improved: 50/168 (29.8%) of patients with SSRIs and 26/162 (16.0%) of patients with placebo) RD 0.14, 95% CI 0.06 to 0.23; NNTB 7, 95% CI 4 to 17.
SSRIs did not statistically, or clinically, significantly reduce fatigue: standard mean difference (SMD) ‐0.26, 95% CI ‐0.55 to 0.03; 7.0% absolute improvement on a 0 to 10 scale, 95% CI 14.6% relative improvement to 0.8% relative deterioration; nor sleep problems: SMD 0.03, 95 % CI ‐0.26 to 0.31; 0.8 % absolute deterioration on a 0 to 100 scale, 95% CI 8.3% relative deterioration to 6.9% relative improvement.
SSRIs were superior to placebo in the reduction of depression: SMD ‐0.39, 95% CI ‐0.65 to ‐0.14; 7.6% absolute improvement on a 0 to 10 scale, 95% CI 2.7% to 13.8% relative improvement; NNTB 13, 95% CI 7 to 37. The dropout rate due to adverse events was not higher with SSRI use than with placebo use (23/146 (15.8%) of patients with SSRIs and 14/138 (10.1%) of patients with placebo) RD 0.04, 95% CI ‐0.06 to 0.14. There was no statistically or clinically significant difference in serious adverse events with SSRI use and placebo use (3/84 (3.6%) in patients with SSRIs and 4/84 (4.8%) and patients with placebo) RD ‐0.01, 95% CI ‐0.07 to 0.05.
Authors' conclusions
There is no unbiased evidence that SSRIs are superior to placebo in treating the key symptoms of fibromyalgia, namely pain, fatigue and sleep problems. SSRIs might be considered for treating depression in people with fibromyalgia. The black box warning for increased suicidal tendency in young adults aged 18 to 24, with major depressive disorder, who have taken SSRIs, should be considered when appropriate.
Plain language summary
Selective serotonin reuptake inhibitors (SSRIs) for fibromyalgia
Researchers of the Cochrane Collaboration conducted a review of research about the effects of antidepressants classified as serotonin reuptake inhibitors (SSRIs) on fibromyalgia. After searching for all relevant studies up to June 2014, they found seven studies that compared SSRIs with a fake medication. These studies included a total of 383 people. Most participants were middle‐aged women. The SSRIs that they studied were citalopram, fluoxetine and paroxetine. Five studies were each funded by pharmaceutical companies, and two studies were funded by public institutions.
Key results We are uncertain of the evidence of the outcomes of reduction of pain, sleep problems, fatigue, depression, global improvement (proportion of patients who reported to be much or very much improved), tolerability (dropout rates due to adverse events), and safety (serious adverse events).
Possible side effects of SSRIs may include dry mouth, nausea/vomiting, and sexual dysfunction. Rare complications may include allergies, diseases of the immune system, liver damage, and impairment of a person’s ability to drive or operate machinery; serious side effects, such as suicidal thoughts and liver failure, are very rare. What is fibromyalgia and what are serotonin reuptake inhibitors? People with fibromyalgia suffer from chronic widespread pain, sleep problems, and fatigue. There is no cure for fibromyalgia at present. Treatments aim at relieving the symptoms and improving health‐related quality of life.
Serotonin is a chemical which is produced by the human body and is involved in the experiences of pain, sleep, and mood. Decreased concentrations of serotonin have been reported in people with fibromyalgia. SSRIs are antidepressants that increase the concentration of serotonin in the brain. SSRIs are not approved for use as fibromyalgia treatment, but are approved for depression and anxiety disorder.
Quality of the evidence The quality of evidence was very low for each outcome. We downgraded the quality of evidence to very low due to concerns about risk of bias and studies with few participants. Therefore we are uncertain whether taking SSRIs for an average of eight weeks improves fibromyalgia symptoms (number of people who reported that their pain was reduced by at least 30%, and number of people reporting a clinically important global improvement in pain intensity, fatigue, sleep problems, and depression).
This is the Abstract and Plain Language Summary of a Cochrane Review, prepared and maintained by The Cochrane Collaboration, currently published in The Cochrane Database of Systematic Reviews 2011 Issue X, Copyright © 2011 The Cochrane Collaboration. Published by John Wiley and Sons, Ltd. The full text of the review is available in The Cochrane Library (ISSN 1464‐780X). This record should be cited as: Walitt B, Urrútia G, Nishishinya MB, Riera Lizardo RJ, Cantrell SE, Häuser W. Selective serotonin reuptake inhibitors for fibromyalgia syndrome. Cochrane Database of Systematic Reviews [Year], Issue [Issue].
Summary of findings
for the main comparison.
| Selective serotonin reuptake inhibitors (SSRIs) compared with placebo for fibromyalgia | |||||||
|
Patient or population: Patients with fibromyalgia Settings: Outpatient clinical centers Intervention: SSRIs Comparison: Placebo |
|||||||
| Outcomes | Illustrative comparative risks* (95% CI) | Relative effect (95% CI) | No. of Participants (studies) | Quality of the evidence (GRADE) | Comments | ||
| Assumed risk | Corresponding risk | ||||||
| Placebo | SSRI | ||||||
| Number of patients with at least 30% pain reduction | 228 per 1000 |
333 per 1000 (237 to 429) |
RD 0.10 (0.01 to 0.20) | 343 (6 studies) | ⊕⊝⊝⊝ very low1,2,3 | Absolute risk difference (more patients with at least 30% pain reduction): 10% (95% CI 1% to 20%) Relative per cent improvement: 37% (95% CI 4% deterioration to 98% improvement) NNTB 10 (95% CI 5 to 100) |
|
| Number of patients with a clinically important global improvement | 160 per 1000 | 302 per 1000 (220 to 390) | RD 0.14 (0.06 to 0.23) | 330 (6 studies) | ⊕⊝⊝⊝ very low1,2,3 | Absolute risk difference (more patients with clinically important global improvement): 14% (95% CI 6% to 23%) Relative per cent improvement: 78% (95% CI 17% to 170% improvement) NNTB 7 (95% CI 4 to 17) |
|
| Fatigue (lower scores mean less fatigue) | Baseline score control group 7.5 (2.7) * |
Mean fatigue score was 0.70 points lower (1.46 lower to 0.08 lower) based on a 0‐10 scale | 192 (5 studies) | ⊕⊝⊝⊝ very low1,2,3 | SMD ‐0.26 (95% CI ‐0.55 to 0.03) 7.0% (95% CI 14.6% fewer points to 0.8% fewer points on the fatigue scale) (absolute improvement) 9.4% relative improvement (95% CI 15.6% relative improvement to 1.1% relative deterioration) |
||
| Sleep problems (lower scores mean less sleep problems) | Baseline score control group 68.0 (26.6) ** | Mean sleep problems score was 0.80 points higher (8.3 higher to 6.9 lower) based on a 0‐100 scale | 193 (5 studies) | ⊕⊝⊝⊝ very low1,2,3 | SMD 0.03 (95% CI ‐0.26 to 0.31) 0.08% more (95% CI 8.3% more to 6.9% fewer points) on the sleep problems scale (absolute deterioration) 1.2% relative deterioration (95% CI 10.2% relative improvement to 12.1% relative deterioration |
||
| Depression (lower scores mean less depression) | Baseline score control group 2.5 (2.0) *** | Mean depression score was 0.76 points lower (0.27 lower to 1.38 lower) based on 0‐10 scale | 244 (6 studies) | ⊕⊝⊝⊝ very low1,2,3 | SMD ‐0.39 (95% CI ‐0.65 to ‐0.14) 7.6% (95% CI 2.7% to 13.8%) fewer points on the depression scale (absolute improvement) 30.4% relative improvement (95% CI 11.2% to 52.0% relative improvement) NNTB 13 (95% CI 7 to 37) |
||
| Discontinuation due to adverse events | 101 per 1000 | 140 per 1000 (42 to 241) | RD 0.04 ( ‐0.06 to 0.14) | 284 (5 studies) | ⊕⊝⊝⊝ very low2,3,4 | Absolute risk difference 4% (95% CI 6% less to 14% more discontinuation due to adverse events) Relative per cent deterioration 44% (95% CI 38% improvement to 233% deterioration) |
|
| Serious adverse events | 48 per 1000 | 40 per 1000 (‐22 to 98) | RD ‐0.01 (‐0.07 to 0.05) | 168 (2 studies) | ⊕⊝⊝⊝ very low2,3 | Absolute risk difference ‐1% less (95% CI 7% less to 5% more serious adverse events) Relative per cent improvement 24% (95% CI 83% improvement to 224% deterioration) |
|
| CI: confidence interval; NNTB: number needed to treat for an additional beneficial outcome; RD: risk difference; SMD: standard mean difference | |||||||
| GRADE Working Group grades of evidence High quality: Further research is very unlikely to change our confidence in the estimate of effect. Moderate quality: Further research is likely to have an important impact on our confidence in the estimate of effect and may change the estimate. Low quality: Further research is very likely to have an important impact on our confidence in the estimate of effect and is likely to change the estimate. Very low quality: We are very uncertain about the estimate. | |||||||
1 > 50% of the participants in low quality studies 2 Patients with inflammatory rheumatic diseases and/ or depressive disorders were excluded in > 50% of participants 3 Total number of patients <400 4 I² > 50%
*Arnold 2002; N = 60 participants (VAS 0‐10)
** Goldenberg 1996; N = 31 participants (VAS 0‐100)
***Arnold 2002; N = 60 participants (VAS 0‐10)
Background
Fibromyalgia is a common disorder occurring in all populations across the world. Estimates of the prevalence of fibromyalgia according to the American College of Rheumatology (ACR) 1990 classification criteria in the general European population ranged from 2.1% to 2.9% (Branco 2010) and was 2.0 % in Wichita, USA (Wolfe 1995). The prevalence of fibromyalgia according to the research criteria was 2.1% in the general German (Wolfe 2013) and Japanese population (Nakamura 2014). People with fibromyalgia use a wide range of different types of drugs and non‐pharmacological therapies (Bennett 2007; Häuser 2012a; Marschall 2011).
Description of the condition
The disorder is characterized by chronic widespread musculoskeletal pain, which commonly co‐exists with cognitive dysfunction, sleep disturbance, and fatigue (Wolfe 2010). Correspondingly, patients often report high disability levels and poor quality of life, along with extensive use of medical care (Haviland 2012; Knight 2013; Marschall 2011). Lacking a specific laboratory test, clinical diagnosis is often based on the ACR 1990 classification (Wolfe 1990), the ACR 2010 preliminary diagnostic criteria (Wolfe 2010), and the 2010 epidemiologic research criteria (Wolfe 2011a; Wolfe 2014). In the past, other criteria had been used to diagnose fibromyalgia (Smythe 1981;Yunus 1981;Yunus 1982;Yunus 1984).
A biopsychosocial model of factors predisposing, triggering and perpetuating fibromyalgia symptoms has been suggested (Sommer 2012). An array of factors have been correlated with fibromyalgia, including genes (Arnold 2013; Lee 2010), life‐style factors, such as obesity and physical inactivity (Mork 2010), social disadvantage, psychological and physical stress (van Houdenhove 2005), and sleep disturbances (Mork 2012). Physical and sexual abuse in childhood and adolescence (Häuser 2011), and somatic diseases such as rheumatoid arthritis, often precede the development of fibromyalgia symptoms (Wolfe 2011b). Concommitant psychological disorders, such as depression (Lange 2010) and post‐traumatic stress (Häuser 2013a) have a negative impact on the clinical outcome of fibromyalgia. Several biological mechanisms, such as alterations of central pain pathways, hyporeactivity of the hypothalamus‐pituitary‐ adrenal axis, increased systemic pro‐inflammatory and reduced anti‐inflammatory cytokine profiles, disturbances in the dopaminergic and serotonergic systems, and small fibre pathology have been associated with fibromyalgia. However, none of these mechanisms has been demonstrated to have a causal relationship to fibromyalgia or to be specific for fibromyalgia (Sommer 2012; Üceyler 2013a). The dominant modern pathophysiologic concept views fibromyalgia as the result of alterations in central pain processing, involving alteration of sensory input, its cognitive‐emotional appraisal, and reflexive regulation of future sensory input (Bradley 2009). Since specific treatment aimed at altering the pathogenesis is not possible, drug therapy focusing on symptom reduction is widely employed.
Description of the intervention
Serotonin reuptake inhibitors (SSRIs) act on serotonergic neurons in the nervous system. Serotonin is implicated in the mediation of endogenous pain inhibitory mechanisms.
How the intervention might work
Central pain conditions, in which persistent pain occurs in the absence of objective anatomic abnormality, are presumed to respond best to centrally active neuromodulating agents, such as antidepressants and anticonvulsants (Häuser 2012b). Dysfunction of serotonin transmission, which it reported to mediate endogenous analgesic mechanisms via descending inhibitory pain pathways in the central nervous system, may play a role in the pathophysiologic mechanisms of fibromyalgia. Researchers found that levels of metabolites of biogenic amines associated with descending inhibition were lower than normal in at least three fibromyalgia body fluid compartments (Legagneux 2001; Russell 1992). Imbalance or deficiency in serotonin is also associated with other defining symptoms of fibromyalgia, such as fatigue and cognitive deficits (Bradley 2009). Treatment with SSRI increases the functional expression of serotonin and may improve pain, fatigue, and cognitive deficits.
Why it is important to do this review
Anticonvulsants, antidepressants, non‐steroidal anti‐inflammatory drugs, and opioids are the most frequently used drugs by fibromyalgia patients (Bennett 2007; Häuser 2012a). SSRIs were prescribed in 16% of insurants diagnosed with fibromyalgia in a German statutory health insurance company with seven million insurants between 2008 and 2010 (Marschall 2011). A comprehensive assessment of the potential benefits and risks of SSRIs in fibromyalgia could assist patients and physicians making choices about using medications for fibromyalgia treatment. We continued the Cochrane Reviews of the Cochrane Musculoskeletal Group (CMSG) on centrally acting agents in fibromyalgia (Häuser 2013b; Tort 2012; Üceyler 2013b) with a review on SSRIs.
Objectives
The objective was to assess the benefits and harms of selective serotonin reuptake inhibitors (SSRIs) in the treatment of fibromyalgia.
Methods
Criteria for considering studies for this review
Types of studies
We selected all relevant double‐blind, randomized controlled trials (RCTs) with a study duration of equal to, or greater than four weeks. We included studies with a parallel or cross‐over design. We included studies with a cross‐over design if (a) separated data from the two periods were reported, (b) data were presented which excluded statistically significant carry‐over effects, or (c) statistical adjustments were carried out in the case of a significant carry‐over effect.
Types of participants
Adults (+ 18 years) having a clinical diagnosis of fibromyalgia by any recognized criteria (Smythe 1981;Wolfe 1990; Wolfe 2010; Wolfe 2014; Yunus 1981;Yunus 1982;Yunus 1984).
Types of interventions
We accepted trials comparing SSRIs with placebo or another active drug. We allowed cointerventions, such as non‐steroidal anti‐inflammatory drugs, non‐opioid analgesics and physical therapy. We considered the following SSRIs in this review: citalopram, fluoxetine, escitalopram, fluvoxamine, paroxetine, and sertraline.
Types of outcome measures
We selected outcomes measures based on the recommendations of the CMSG 2014 and OMERACT (Mease 2011) for fibromyalgia studies, and on recommendations of best practice in the reporting of systematic reviews in chronic pain (Moore 2010). In discussion with the CMSG, we modified the recommended CMSG outcomes for fibromyalgia to include fatigue and sleep problems as primary outcomes (and shifted tenderness and physical functioning to secondary outcomes). Along with chronic widespread pain, fatigue and sleep problems are currently considered essential symptoms of fibromyalgia. We chose dichotomous outcomes instead of continuous outcomes for pain and global improvement because a) the distribution of response in chronic pain trials is typically not Gaussian, and b) average changes of pain scores are of very limited utility because they are unrepresentative of the patient experience (Moore 2010).
Primary outcomes
We used only patient‐reported outcomes of symptoms.
Number of patients with at least 30% pain reduction rates: If not reported, we calculated responder rates by a validated imputation method (Furukawa 2005) based on means and standard deviations (SDs) of average pain scores. We preferred single item pain scales (e.g. Visual Analogue Scale (VAS) or numeric rating scales) over composite pain scales, (e.g. McGill Pain Questionnaire).
Global improvement: Number of patients with a clinically important global improvement: We preferred proportion of patients who reported to be much or very much improved over investigator‐defined composite responder scores. If these outcomes were not available, we used the proportion of patients with a >= 25% reduction of the Fibromyalgia Impact Questionnaire (FIQ)FIQ total score. We calculated responder rates by a validated imputation method (Furukawa 2005) based on means and SDs of average FIQ total scores.
Fatigue: We preferred total scores of validated fatigue instruments (e.g. Fatigue Impact Scale) over single item scales (e.g. VAS 0‐10).
Sleep problems: We preferred total scores of validated sleep problem instruments (e.g. Medical Outcomes Study (MOS) sleep scale) over single item scales (e.g. VAS 0‐10).
Depression: We preferred total scores of validated depression instruments (e.g. Beck Depression Inventory (BDI)) over single item scales (e.g. VAS 0‐10).
Tolerability: Discontinuation rates due to adverse events.
Safety: Proprotion of patients with any serious adverse event.
Secondary outcomes
Pain Intensity: We preferred single item pain scales (e.g. VAS or numeric rating scales) over composite pain scales (e.g. McGill Pain Questionnaire).
Physical functioning: We preferred total scores of validated instruments (e.g. SF‐36 physical function) over single item scales (e.g. VAS 0‐10).
Anxiety: We preferred total scores of validated anxiety instruments (e.g. AIMS anxiety) over single item scales (e.g. VAS 0‐10).
Tenderness: We preferred combined scores with dolorimetry (e.g. total myalgic score) over tender point count (preferring dolorimetry over tender point count to thumb pressure).
Search methods for identification of studies
Electronic searches
We ran an electronic search in the Cochrane Central Register of Controlled Trials (CENTRAL; 2014, Issue 5), MEDLINE accessed through PubMed (1966 to June 2014), and EMBASE accessed through Elsevier (1946 to June 2014). We ran previous searches in November 2010 and February 2009. The June 2014 search not only updated the search with respect to years of coverage, but also incorporated a stronger and more comprehensive search strategy. Additionally, the June 2014 search provided greater access to EMBASE content (1946 to present versus 1980 to present) than earlier searches. See Appendix 1 for search strategies in all databases and the corresponding number of retrieved results.
Searching other resources
We handsearched bibliographies from reviewed articles and retrieved relevant articles. We contacted content experts for both published and unpublished potential studies.
Our search included all languages. We contacted the corresponding authors of identified RCTs when possible for additional information about other relevant studies. We also searched for ongoing trials in relevant databases such as ClinicalTrials.gov (https://clinicaltrials.gov) and the metaRegister of controlled trials (http://www.isrctn.com).
Data collection and analysis
Selection of studies
Four reviewers (BN, BW, RR, SC) independently scrutinized all the titles and abstracts revealed by the searches and determined which fulfilled the selection criteria. A fifth reviewer (GU) verified that the selection had been properly realized (see Figure 1).
1.

Study flow diagram.
Data extraction and management
Four review authors (BN, RR, BW, WH) extracted data independently onto a specially designed data extraction form. All data were checked by at least two authors. There were no disagreements in this process. Two authors (BN, WH) entered data into Review Manager (RevMan 2014) and a third review author (GU) checked them.
Assessment of risk of bias in included studies
Three review authors (BN, GU, WH) independently assessed the risk of bias of each included trial. We resolved disagreements by consensus and, if needed, referral to a fourth review author (BW). For each included study, we assessed risk of bias against key criteria of selection bias, performance bias, detection bias, attrition bias, reporting bias, and funding bias, in accordance with methods recommended by The Cochrane Collaboration (Higgins 2011). We judged each of these criteria using: low risk of bias; high risk of bias; or unclear (either lack of information or uncertainty over the potential for bias) (see Appendix 2).
Measures of treatment effect
The effect measures of choice were absolute risk difference (RD) for dichotomous data and standard mean difference (SMD) for continuous data. We selected SMD to enable us to analyze the results of several different measurement scales for a particular outcome as a single outcome estimate. We calculated the numbers needed to treat for an additional beneficial outcome (NNTB) and the numbers needed to treat for an additional harmful outcome (NNTH) for the dichotomous variables by 1/ARR (absolute risk reduction) with 95% confidence intervals (CIs).
We used Cohen’s categories to evaluate the magnitude of the effect size, calculated by SMD, with Hedge’s g of 0.2 = small, 0.5 = medium and 0.8 = large (Cohen 1988). We labelled g < 0.2 to be a ”not substantial” effect size. We assumed a minimally important difference if Hedges’ g was ≥ 0.2 (Fayers 2014). We set the threshold for “appreciable benefit” or “appreciable harm” for categorical variables by a NNTB or NNTH < 10 (Moore 2008).
Unit of analysis issues
In the case of multiple SSRI arms compared with one placebo group, we adjusted the number of participants in the placebo group according to the number of SSRI arms for continuous outcomes.
Assessment of heterogeneity
We assessed heterogeneity using the I² statistic. We assumed substantial heterogeneity if I² was > 50% (Higgins 2011). We assessed clinical heterogeneity by assessing the demographic and clinical characteristics of the study populations.
Assessment of reporting biases
We assessed publication bias using a method designed to detect the amount of unpublished data with a null effect that would be required to make any result clinically irrelevant (usually taken to mean a NNT of 10 or more ) (Moore 2008).
Data synthesis
We undertook each meta‐analysis using a random‐effects model, using the inverse variance method in Review Manager (RevMan 2014).
We used the Grading of Recommendations Assessment, Development and Evaluation (GRADE) to assess the overall quality of evidence (Balshem 2008), defined as the extent of confidence in the estimates of treatment benefits and harms. We made quality ratings separately for each of the eight quality indicators. We defined a study to be of high quality when it fulfilled six to eight of the indicators, to be of moderate quality when it fulfilled three to five of the indicators, and to be of low quality if it fulfilled zero to two of the quality indicators. We downgraded the quality of evidence by one level for each of the following factors that we encountered.
Limitations of study design: > 50% of the participants in low quality studies.
Inconsistency of effect size: I² > 50%.
Indirectness: We assessed whether the question being addressed in this systematic review was different from the available evidence regarding the population in routine clinical care, if patients with inflammatory rheumatic diseases and/or depressive disorders were excluded in > 50% of participants.
Imprecision: There was only one trial or when there was more than one trial, the total number was < 400 patients or when 95% CI of the effect size included zero.
We categorized the quality of evidence as follows.
High: We are very confident that the true effect lies close to that of the estimate of the effect.
Moderate: We are moderately confident in the effect estimate; the true effect is likely to be close to the estimate of the effect, but there is a possibility that it is substantially different.
Low: Our confidence in the effect estimate is limited; the true effect may be substantially different from the estimate of the effect.
Very low: We have very little confidence in the effect estimate; the true effect is likely to be substantially different from the estimate of effect; any estimate of effect is very uncertain.
We analyzed data in three tiers, according to outcome and freedom from known sources of bias.
The first tier uses data meeting current best standards, where studies report the outcome of at least 50% pain intensity reduction over baseline (or its equivalent), without the use of last observation carried forward (LOCF) or other imputation methods for dropouts, report an intention‐to‐treat (ITT) analysis, last eight or more weeks, have a parallel‐group design, and have at least 200 participants (preferably at least 400) in the comparison.
The second tier uses data from at least 200 participants, but where one or more of the above conditions is not met (for example, reporting at least 30% pain intensity reduction, using LOCF or a completer analysis, or lasting four to eight weeks).
The third tier of evidence relates to data from fewer than 200 participants, or where there are expected to be significant problems because, for example, the studies are of very short duration (of less than four weeks), where there is major heterogeneity between studies, or where there are shortcomings in allocation concealment, attrition, or incomplete outcome data (Moore 2010).
Subgroup analysis and investigation of heterogeneity
We planned to separately analyze data for single SSRIs, for studies of 4 to 12 weeks and >12 weeks duration, and for studies with and without industry sponsorship of the primary outcomes. At least two studies should be available for a valid subgroup analysis.
Sensitivity analysis
We planned to exclude studies in which we extracted data from figures and/or in which we calculated SDs from P values and/or in which we used imputation methods to calculate pain reduction rates.
'Summary of findings' table
We calculated the numbers needed to treat for an additional beneficial outcome (NNTB) or harmful outcome (NNTH) in the 'Summary of findings’ table according to the Cochrane Handbook for Systematic Reviews of Interventions (Higgins 2011). For outcomes of continuous variables (fatigue, sleep problems), we calculated the NNTB by 1/ARR (absolute risk reduction = % absolute improvement or deterioration).
Results
Description of studies
Results of the search
While initial searches were conducted in 2009 and 2010, we redeveloped our search strategies in June 2014. All search strategies at each time point are available in Appendix 1. In 2014, we ran an electronic search in MEDLINE (accessed through PubMed, 1966 to June 2014), the Cochrane Central Register of Controlled Trials (CENTRAL; 2014, Issue 5), and EMBASE (accessed through Elsevier, < 1946 to June 2014). The 2014 search identified 6314 articles. After removing 1942 duplicate citations, this number dropped to 4372 articles. As the search strategy was designed as part of a global search strategy to identify all the RCTs on pharmacological and non‐pharmacological treatments for fibromyalgia, many of the obtained references were not related to selective seratonin reuptake inhibitor (SSRI) antidepressants. We excluded 4353 references as they did not fulfill inclusion criteria related to the interventions evaluated in this review. We identified 19 studies potentially related to these interventions, and we obtained the full text for each of them. We excluded 11 studies. See Characteristics of excluded studies for further details about reasons for exclusion and Figure 1 for a study flow diagram. Therefore, we included eight studies. See Included studies for full description of studies.
Included studies
One study had a cross‐over design (Goldenberg 1996) and seven had a parallel design (Anderberg 2000; Arnold 2002; GSK 2005; Hussain 2010; Norregaard 1995; Patkar 2007; Wolfe 1994).
A total of 383 patients diagnosed with fibromyalgia were randomized. Of them, 42 received citalopram, 77 fluoxetine, 84 paroxetine, and 180 placebo. In a cross‐over study, the same 31 patients that received fluoxetine also got amitriptyline, placebo or the combination of both drugs. Sample sizes ranged from 40 to 116 patients, with a mean of 57 patients per study.
Five studies were funded by pharmaceutical companies: Glaxo Smith Kline funded Patkar 2007 and GSK 2005; Eli Lilly and Company funded Arnold 2002 and Wolfe 1994; and H. Lundbeck sponsored Norregaard 1995. The remaining studies were funded by public grants (Anderberg 2000; Goldenberg 1996; Hussain 2010).
Baseline demographic characteristics and risks factors were well balanced in most of the studies. Most patients were females (90% to 100%), except for one study in which 77% of patients were males (GSK 2005). Ages ranged from 42.5 to 52.9 years. All the studies used the American College of Rheumatology (ACR) 1990 classification criteria (Wolfe 1990) to diagnose fibromyalgia. Patients with inflammatory rheumatic disease were explicitly excluded in five studies (Arnold 2002; GSK 2005; Norregaard 1995; Patkar 2007; Wolfe 1994). Three studies did not provide detailed information on this topic (Anderberg 2000; Goldenberg 1996; Hussain 2010). Four studies explicitly excluded patients with major depressive symptoms (Anderberg 2000; Arnold 2002; Norregaard 1995; Patkar 2007. Two studies did not provide detailed information on this topic (Hussain 2010; Wolfe 1994). GSK 2005 explicitly included patients with depressive symptoms.
Four studies were conducted in the US (Arnold 2002; Goldenberg 1996; Patkar 2007; Wolfe 1994), one study was conducted in Asia (Hussain 2010), and the remaining studies were in Europe (Anderberg 2000; GSK 2005; Norregaard 1995).
Two studies had a duration of six weeks (Goldenberg 1996; Wolfe 1994), three studies were eight‐weeks long (GSK 2005; Hussain 2010Norregaard 1995), another two had a duration of 12 weeks (Arnold 2002; Patkar 2007), and one study was 16‐weeks long (Anderberg 2000).
Interventions
Two studies compared citalopram with placebo using a flexible dose of 20 to 40 mg/day (Anderberg 2000; Norregaard 1995). Three studies compared fluoxetine with placebo, two of them using a fixed dose of 20 mg/day (Goldenberg 1996; Wolfe 1994) and another one using a flexible dose of 20 to 80 mg/day (Arnold 2002). One study compared paroxetine controlled release flexible (mean dose of 39.1 ± 8.6 mg/day) with placebo (Patkar 2007) and another one compared paroxetine 20 mg/day fixed with placebo (GSK 2005). One study compared fluoxetine 20 mg/day with amitriptyline 25 mg/day and a combination of both with placebo (Goldenberg 1996), and another one compared fluoxetine 20 mg/d fixed with melatonin 5 mg/d fixed (Hussain 2010). Three studies did not report on rescue medication (GSK 2005; Hussain 2010; Norregaard 1995). The remaining studies allowed rescue medication such as acetaminophen, aspirin, non‐steroidal anti‐inflammatory drugs and codeine.
Outcomes
Pain relief, defined by at least 25% pain reduction, was reported in two studies (Arnold 2002; Patkar 2007). We calculated at least 30% pain reduction rates for all studies.
Global improvement was defined as having at least 25% reduction of the Fibromyalgia Impact Questionnaire (FIQ) total score in two studies (Arnold 2002; Patkar 2007). Anderberg 2000 reported the number of patients with global improvement of well‐being. Goldenberg 1996 defined global improvement by an at least 25% reduction of a composite score (pain score, tender point score, global well‐being score, physician global assessment) ranging from 0 to 100. We calculated global improvement by at least 25% reduction rates of global severity (Wolfe 1994), and by at least 25% improvement of general well‐being (Norregaard 1995) using an imputation method. We could not calculate global improver scores for the remaining studies as they did not assess global measures of well‐being.
Fatigue was measured by a single item Visual Analogue Scale (VAS) in six studies (Anderberg 2000; Arnold 2002; Goldenberg 1996; Hussain 2010; Norregaard 1995; Patkar 2007).
Sleep problems were measured by a single item VAS in four studies (Goldenberg 1996; Hussain 2010; Norregaard 1995; Patkar 2007). One study used the sleep item of the Montgomery Asberg Depression Rating Scale (MADRS) (Anderberg 2000).
Four studies assessed depression using the Beck Depression Inventory (BDI) scale (Goldenberg 1996; Norregaard 1995; Patkar 2007; Wolfe 1994). Anderberg 2000 used the MADRS. GSK 2005 and Hussain 2010 used a single item VAS.
Pain intensity was assessed in all the studies, although using different scales: a VAS (0‐3) was used in Wolfe 1994, a VAS (0‐10) in Anderberg 2000, Arnold 2002, Hussain 2010, and Norregaard 1995 and a VAS (0‐100) in Goldenberg 1996, GSK 2005, and Patkar 2007.
Disease‐specific health‐related quality of life was measured with the FIQ using different scales: FIQ (0‐3) in Anderberg 2000 and Norregaard 1995, and FIQ (0‐80) was used by Arnold 2002, Goldenberg 1996 and Patkar 2007.
Physical functioning was assessed by a single item VAS scale of the FIQ in three studies (Anderberg 2000; Arnold 2002; Hussain 2010) and by the Health Assessment Questionnaire (HAQ) in two studies (GSK 2005,; Wolfe 1994).
Anxiety was assessed by a single item VAS in four studies (Anderberg 2000; Arnold 2002; GSK 2005; Hussain 2010), and by the AIMS anxiety score in one study (Wolfe 1994).
Tenderness was assessed by the myalgic score (Anderberg 2000; Arnold 2002 ) and by the tender point count (Norregaard 1995; Wolfe 1994) in two studies each. Wolfe 1994 used dolorimetry.
Risk of bias in included studies
The risk of bias of most items was unclear in all studies: see Figure 2 and Figure 3 for a 'Risk of bias' summary and graph, and Characteristics of included studies for detailed information regarding risk of bias assessments of each study.
2.
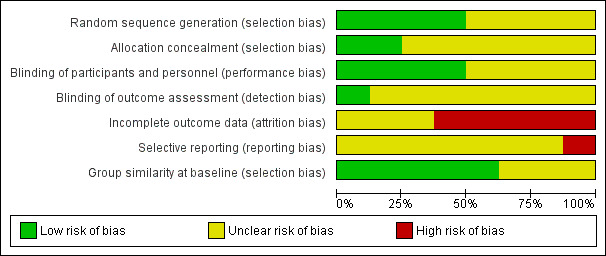
Risk of bias graph: review authors' judgements about each risk of bias item presented as percentages across all included studies.
3.

Risk of bias summary: review authors' judgements about each risk of bias item for each included study.
Allocation
All studies were randomized. Two studies properly described sequence generation and allocation concealment (Anderberg 2000; Patkar 2007), but no information was provided in other studies (Arnold 2002; GSK 2005; Hussain 2010). Goldenberg 1996 and Wolfe 1994 described sequence generation, but gave no details regarding allocation concealment. In terms of selection bias, there were no significant differences in demographic and pain parameters at baseline between SSRI and control groups.
Blinding
All studies reported to be "double‐blind". However, only four studies reported that all tablets were identical in appearance (Arnold 2002; Goldenberg 1996; Norregaard 1995; Patkar 2007). Only one study provided details of the blinding of the outcome assessor (Goldenberg 1996).
Incomplete outcome data
One study had no dropouts (Hussain 2010). Dropout rates were high across studies (12% to 43%) and most studies also reported a high rate of dropouts in the placebo group (5% to 40%). Intention to treat (ITT) analysis was performed in two studies by last observation carried forward (LOCF) (Arnold 2002; Patkar 2007). Anderberg 2000 and Wolfe 1994 reported some outcomes based on ITT‐analysis (LOCF), and some outcomes based on completer analyzes.
Selective reporting
It was not possible to assess selective outcome reporting as we did not have access to the study protocols.
Effects of interventions
See: Table 1
We analyzed the following effects of interventions separately: SSRIs versus placebo and SSRIs versus other active drugs. The quality of evidence was very low for each outcome. We downgraded the quality of evidence to very low due to concerns about risk of bias and studies with few participants. There was second tier evidence (Moore 2010) of efficacy for comparisons of SSRIs versus placebo in the outcomes: number of patients with an at least 30% pain reduction, number of patients with a clinically important global improvement, depression, and tolerability. There was third tier evidence of efficacy for comparisons of SSRIs with placebo for the remaining outcomes, and for all comparisons of SSRIs with active drug controls.
SSRIs versus placebo
Number of patients with at least 30% pain reduction
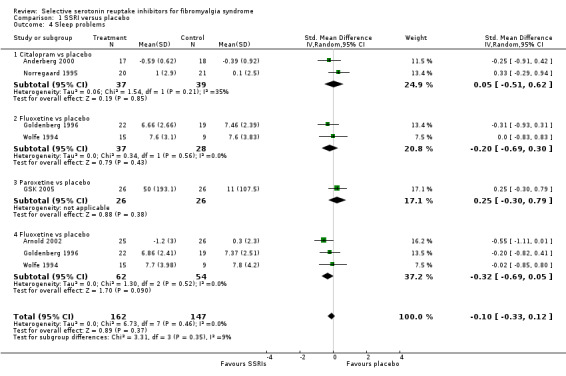
We analyzed six studies with 343 participants experiencing pain reduction rates of at least 30%. SSRIs were statistically significantly superior to placebo (P = 0.04); RD 0.10, 95% CI 0.01 to 0.20; 56/172 (32.6%) of patients with SSRIs and 39/171 (22.8%) of patients with placebo reported at least 30% pain reduction resulting in a NNTB of 10 (95% CI 5 to 100). The use of SSRIs in fibromyalgia had no appreciable clinical benefit compared to placebo. The quality of evidence was very low (see Analysis 1.1).
1.1. Analysis.
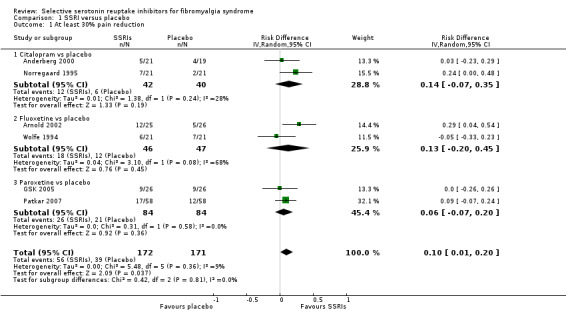
Comparison 1 SSRI versus placebo, Outcome 1 At least 30% pain reduction.
Number of patients with a clinically important global improvement
We analyzed six studies with 330 patients with a clinically important global improvement. SSRIs were statistically significantly superior to placebo (P = 0.001); RD 0.14, 95% CI 0.06 to 0.23; 50/168 (29.8%) of patients with SSRIs and 26/162 (16.0%) of patients with placebo reported a clinically important global improvement resulting in a NNTB of 7 (95% CI 4 to 17). The use of SSRIs in fibromyalgia had an appreciable clinical benefit compared to placebo. The quality of evidence was very low (Analysis 1.2).
1.2. Analysis.
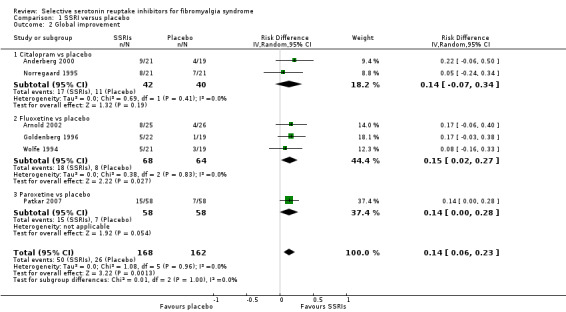
Comparison 1 SSRI versus placebo, Outcome 2 Global improvement.
Fatigue
We analyzed five studies with 192 participants for reduction of fatigue. SSRIs were not statistically significant superior to placebo (P = 0.08) (9.4% relative improvement); SMD ‐0.26, (95% CI ‐0.55 to 0.03). The quality of evidence was very low (Analysis 1.3).
1.3. Analysis.
Comparison 1 SSRI versus placebo, Outcome 3 Fatigue.
Sleep problems
We analyzed five studies with 193 participants for reduction of sleep problems. SSRIs were not statistically significant superior to placebo (P = 0.86) (1.2% relative deterioration); SMD 0.03, 95% CI ‐0.26 to 0.31. The quality of evidence was very low (Analysis 1.4).
1.4. Analysis.
Comparison 1 SSRI versus placebo, Outcome 4 Sleep problems.
Depression
We analyzed six studies with 244 participants for reduction of depression scores. SSRIs were statistically and clinically significant superior over placebo (P = 0.005) (relative improvement 30.4%); SMD ‐0.39, 95% CI ‐0.65 to ‐0.14. The effect size was small according to Cohen's categories. We could not enter one study into the meta‐analysis: paroxetine was not statistically superior (P = 0.08) over placebo (Patkar 2007). The quality of evidence was very low (Analysis 1.5).
1.5. Analysis.

Comparison 1 SSRI versus placebo, Outcome 5 Depression.
Tolerability (discontinuation rates due to adverse events)
We analyzed five studies with 284 participants for discontinuation rates due to adverse events. There was no statistically significant or clinically important difference between SSRIs and placebo (P = 0.46); RD 0.04, 95 % CI ‐0.06 to 0.14; 23/146 (15.8%) of patients discontinued treatment in SSRI groups and 14/138 (10.1%) in placebo groups due to adverse events. The quality of evidence was very low (Analysis 1.6).
1.6. Analysis.
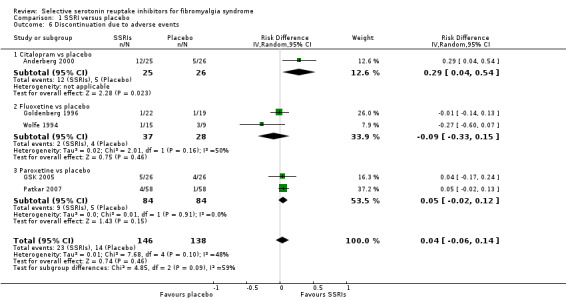
Comparison 1 SSRI versus placebo, Outcome 6 Discontinuation due to adverse events.
Safety (Serious adverse events)
We analyzed two studies with 168 participants for serious adverse events. There was no statistically significant or clinically important difference between SSRIs and placebo (P = 0.46); RD ‐0.01, 95% CI ‐0.07 to 0.05. Serious adverse events were reported by 3/84 (3.6%) patients with SSRIs and by 4/84 (4.8%) of patients with placebo. The quality of evidence was very low (Analysis 1.7).
1.7. Analysis.
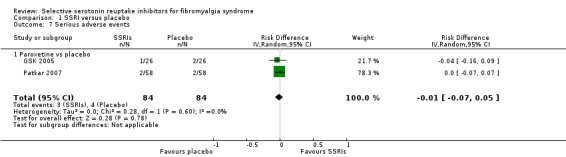
Comparison 1 SSRI versus placebo, Outcome 7 Serious adverse events.
Pain intensity
We analyzed seven studies with 330 participants for reduction in pain intensity. SSRIs were statistically and clinically significantly superior to placebo (P = 0.03); SMD ‐0.37, 95% CI ‐0.69 to ‐0.04). The quality of evidence was very low (Analysis 1.8).
1.8. Analysis.

Comparison 1 SSRI versus placebo, Outcome 8 Pain intensity.
Disease‐specific quality of life
We analyzed two studies with 92 participants for improvement in disease‐specific quality of life. SSRIs were statistically significant and clinically superior to placebo (P = 0.001); SMD ‐0.70, 95% CI ‐1.12 to ‐0.28. The effect size was moderate according to Cohen's categories. We could not enter one study into the meta‐analysis; paroxetine was statistically significantly superior over placebo in reducing the FIQ total score (Patkar 2007). The quality of evidence was very low (Analysis 1.9).
1.9. Analysis.

Comparison 1 SSRI versus placebo, Outcome 9 Disease‐specific quality of life FIQ total score.
Physical functioning
We analyzed three studies with 117 participants for improvement in physical functioning. SSRIs were not statistically significant or clinically superior to placebo (P = 0.65); SMD ‐0.06, 95% CI ‐0.34 to 0.21. The quality of evidence was very low (Analysis 1.10).
1.10. Analysis.

Comparison 1 SSRI versus placebo, Outcome 10 Physical functioning.
Anxiety
We analyzed four studies with 148 participants for reduction of anxiety scores. SSRIs were not statistically significant or clinically superior to placebo (P = 0.46); SMD ‐0.11, 95% CI ‐0.44 to 0.21. Two studies were not suited for meta‐analysis. We could not enter one study into the meta‐analysis; paroxetine was superior to placebo (P < 0.05) (Patkar 2007). Quality of evidence was very low (Analysis 1.11).
1.11. Analysis.
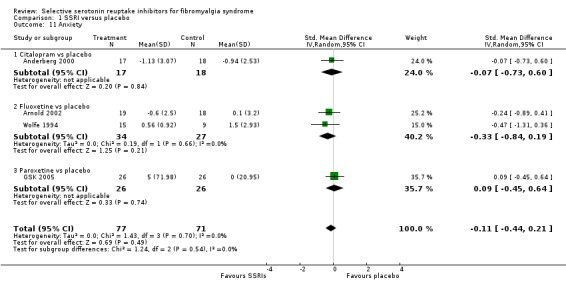
Comparison 1 SSRI versus placebo, Outcome 11 Anxiety.
Tenderness
We analyzed four studies with 158 participants for reduction of tenderness. SSRIs were not statistically significant or clinically superior to placebo (P = 0.14); SMD ‐0.23, 95% CI ‐0.58 to 0.11. We could not enter one study into the meta‐analysis; paroxetine was not statistically superior over placebo (Patkar 2007). The quality of evidence was very low (Analysis 1.12).
1.12. Analysis.

Comparison 1 SSRI versus placebo, Outcome 12 Tenderness.
SSRIs versus active drug
Number of patients with an at least 30% pain reduction
We analyzed two studies with 94 participants experiencing pain reduction rates of at least 30%. SSRIs were not statistically significant superior to other active drugs (P = 0.60); RD ‐ 0.07, 95% CI ‐0.35 to 0.20 (Analysis 2.1).
2.1. Analysis.

Comparison 2 SSRI versus other drugs, Outcome 1 At least 30% pain reduction.
Number of patients with a clinically important global improvement
We analyzed one study with 94 patients with a clinically relevant global improvement. SSRIs were not statistically significant superior to other active drugs (P = 0.23); RD 0.13, 95% CI ‐0.08 to 0.35 (Analysis 2.2).
2.2. Analysis.
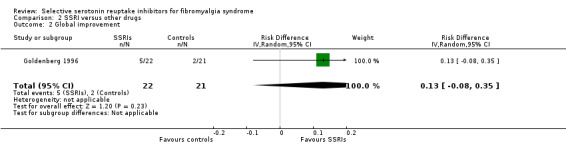
Comparison 2 SSRI versus other drugs, Outcome 2 Global improvement.
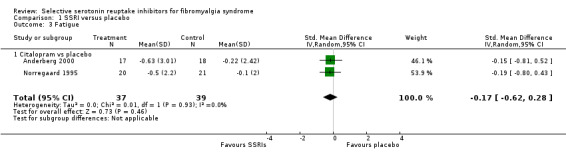
Fatigue
We analyzed two studies with 94 participants for reduction of fatigue. SSRIs were not statistically significant superior to other active drugs (P = 0.32); SMD 0.21, 95% CI ‐0.55 to 0.61 (Analysis 2.3).
2.3. Analysis.
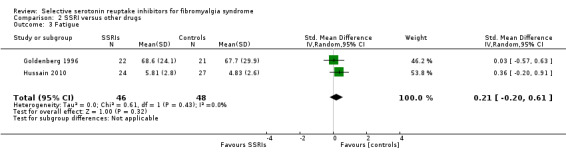
Comparison 2 SSRI versus other drugs, Outcome 3 Fatigue.
Sleep problems
We analyzed two studies with 94 participants for reduction of sleep problems. SSRIs were not statistically superior to other active drugs (P = 0.13); SMD 0.31, 95% CI ‐0.10 to 0.72 (Analysis 2.4).
2.4. Analysis.
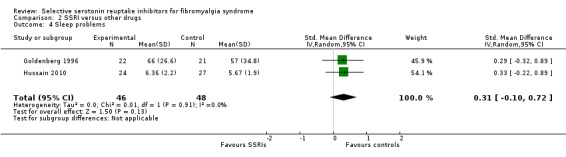
Comparison 2 SSRI versus other drugs, Outcome 4 Sleep problems.
Depression
We analyzed two studies with 94 participants for reduction of depression scores. SSRIs were not statistically significant superior to other active drugs (P = 0.67); SMD 0.11, 95% CI ‐0.40 to 0.63 (Analysis 2.5).
2.5. Analysis.

Comparison 2 SSRI versus other drugs, Outcome 5 Depression.
Tolerability (discontinuation rates due to adverse events)
We analyzed two studies with 94 participants for discontinuation rates due to adverse events. There was no statistically significant or clinically important difference between SSRIs and other active drugs (P = 0.69); RD 0.01, 95% CI ‐0.05 to 0.06 (Analysis 2.6).
2.6. Analysis.
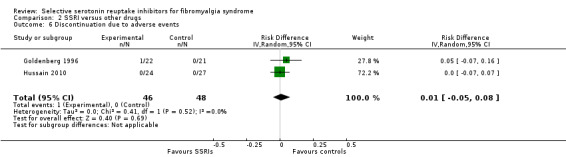
Comparison 2 SSRI versus other drugs, Outcome 6 Discontinuation due to adverse events.
Serious adverse events
The two studies did not report on serious adverse events.
Pain intensity
We analyzed two studies with 94 participants for reduction in pain intensity. SSRIs were not statistically significant superior to other active drugs (P = 0.95); SMD 0.02, 95% CI ‐0.28 to 0.51 (Analysis 2.7).
2.7. Analysis.
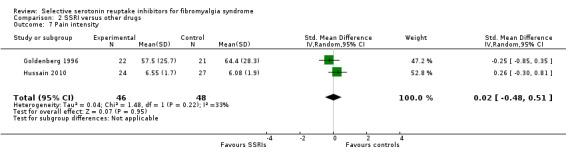
Comparison 2 SSRI versus other drugs, Outcome 7 Pain intensity.
Disease‐specific quality of life
We analyzed one study with 43 participants for improvement of disease‐specific quality of life. SSRIs were not statistically significant superior to other active drugs (P = 0.48); SMD ‐0.22, 95% CI ‐0.82 to 0.38 (Analysis 2.8).
2.8. Analysis.

Comparison 2 SSRI versus other drugs, Outcome 8 Disease‐related quality of life.
Physical functioning
We analyzed one study with 51 participants for improvement of physical functioning. SSRIs were not statistically significant superior to other active drugs (P = 0.11); SMD ‐0.46, 95% CI ‐1.02 to 0.20 (Analysis 2.9).
2.9. Analysis.

Comparison 2 SSRI versus other drugs, Outcome 9 Physical functioning.
Anxiety
We analyzed one study with 51 participants for reduction of anxiety scores. SSRIs were not statistically significant superior to other active drugs (P = 0.34); SMD ‐0.27, 95% CI ‐0.82 to 0.02 (Analysis 2.10).
2.10. Analysis.
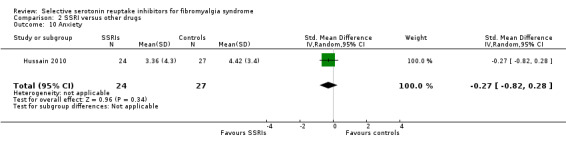
Comparison 2 SSRI versus other drugs, Outcome 10 Anxiety.
Tenderness
We analyzed one study with 43 participants for reduction of anxiety scores. SSRIs were not statistically significant or clinically superior to other active drugs (P = 0.32) SMD 0.31, 95% CI ‐0.29 to 0.91 (Analysis 2.11).
2.11. Analysis.
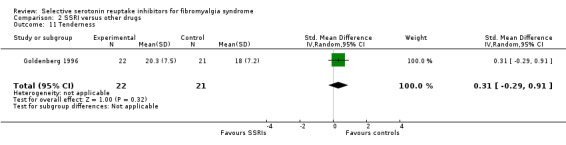
Comparison 2 SSRI versus other drugs, Outcome 11 Tenderness.
Investigation of heterogeneity and subgroup analyzes
Placebo‐controlled studies: There was low heterogeneity in the outcomes: 30% pain reduction (Analysis 1.1), global improvers (Analysis 1.2), fatigue (Analysis 1.3), sleep problems (Analysis 1.4), depression (Analysis 1.5), serious adverse events (Analysis 1.7), disease‐related quality of life (Analysis 1.9), anxiety (Analysis 1.11), and tenderness (Analysis 1.12). Heterogeneity was moderate for discontinuation rates due to adverse events (Analysis 1.6) and high (I² = 51%) for pain intensity (Analysis 1.8). Heterogeneity was due to studies with industry funding (I² = 66%). I² of pain reduction was 0% in studies without industry funding.
Active drug‐controlled studies: There was low heterogeneity in the outcomes: fatigue (Analysis 2.3), sleep problems (Analysis 2.4) and discontinuation due to adverse events (Analysis 2.6). Heterogeneity was moderate for the outcomes: depression (Analysis 2.5) and physical functioning (Analysis 2.9). Heterogeneity was high for the outcome of pain reduction of at least 30%. (Analysis 2.1)
There were no statistically significant subgroup differences between the three SSRIs in the comparison to placebo for the outcomes 30% pain reduction (P = 0.81; I² = 0%) (Analysis 1.1), global improvement (P = 1.00, I² = 0%) (Analysis 1.2), fatigue (P = 0.61, I² = 0%) (Analysis 1.3), sleep problems (P = 0.68, I² = 0.68) (Analysis 1.4), discontinuation rates due to adverse events (P = 0.09, I² = 59) (Analysis 1.6), pain intensity (P = 0.20, I² = 39%) (Analysis 1.8), depression (P = 0.37, I² = 0%) (Analysis 1.5), anxiety (P = 0.58, I² = 0%) (Analysis 1.11), and tenderness (P= 0.15, I² = 0.52) (Analysis 1.12).
There were no clinically relevant differences in the demographic and clinical characteristics of the populations of the studies.
There were no statistically significant differences in the primary outcomes in studies with and without industry sponsorship, except for global improvers (Table 2).
1. Subgroup analysis.
| Outcome title |
Number of studies |
Number of patients |
Effect size (95% CI) |
Test for overall effect P value |
Heterogeneity I² (%) |
| Without industry sponsorship | |||||
| 01 Number of patients with at least 30% pain reduction |
2 | 82 | RD 0.14 (‐0.07 to 0.35) | 0.19 | 28 |
| 02 Number of patients with a clinically important global improvement |
2 | 82 | RD 0.14 (‐0.07 to 0.22) | 0.17 | 0 |
| 03 Fatigue | 2 | 76 | SMD ‐0.17 (‐0.62 to 0.28) | 0.46 | 0 |
| 04 Sleep problems | 2 | 76 | SMD 0.05 (‐0.51 to 0.62) | 0.87 | 35 |
| 05 Dropout due to adverse events | 1 | 61 | RD 0.29 (0.04 to 0.54) | 0.02 | Not applicable |
| With industry sponsorship | |||||
| 01 Number of patients with at least 30% pain reduction |
4 | 261 | RD 0.09 (‐0.04 to 0.22) | 0.17 | 22 |
| 02 Number of patients with a clinically important global improvement |
4 | 248 | RD 0.14 (0.05 to 0.24) | 0.003 | 0 |
| 03 Fatigue | 3 | 117 | SMD ‐0.32 (‐0.69 to 0.05) | 0.09 | 0 |
| 04 Sleep problems | 3 | 158 | SMD ‐0.24 (‐0.60 to 0.13) | 0.21 | 0 |
| 05 Dropout due to adverse events | 4 | 233 | RD 0.02 (‐0.06 to 0.10) | 0.64 | 19 |
RD: risk difference; SMD: standard mean difference
Sensitivity analysis
We could not conduct the predefined sensitivity analyzes because less than two studies were available.
Publication bias
To move the NNTB for global improvers from 7 to 10, 140 extra patients would have to be included in entirely negative trials (zero treatment effect).
Discussion
Summary of main results
There is very low quality evidence that the SSRIs, citalopram, fluoxetine, and paroxetine have a small benefit compared with placebo in increasing the number of patients who experience at least 30% pain reduction and 25% global improvement. There was very low quality evidence that SSRIs were superior to placebo in reducing pain intensity and depression. Because of the very low quality of evidence, we are uncertain if there are differences between the SSRIs citalopram, fluoxetine, paroxetine, and placebo in the reduction of sleep problems, fatigue, anxiety, tenderness, improving physical functioning, health‐related quality of life, tolerability (dropout rate due to adverse events), and safety (frequency of serious adverse events). It would be inappropriate to suggest a class effect of SSRIs on fibromyalgia symptoms.
Overall completeness and applicability of evidence
The applicability of evidence is strongly limited for the following reasons.
The exclusion criteria were strict in most studies; potential participants with other health issues were excluded. Therefore, the study results cannot be applied to people with fibromyalgia complicated by other medical diseases, including inflammatory rheumatic diseases. The study results cannot be applied to people with fibromyalgia and concomitant psychiatric comorbidity (i.e. depression), because no subgroup analysis of people with psychiatric comorbidity were conducted in the studies.
Concomitant medications were not allowed in most studies; potential participants using other medications for fibromyalgia symptoms were excluded. In general practice, patients often use SSRIs as part of a multiple‐drug regimen, rather than as monotherapy.
The majority of the participants were middle‐aged women, making it difficult to apply the results to men, seniors and adolescents.
Fibromyalgia is a chronic condition, potentially requiring treatment over an entire lifetime. The longest study reviewed only considered improvement at the end of four months. None of the studies reviewed provide any insight into the long‐term efficacy of SSRIs for fibromyalgia symptoms.
Finally, no SSRI has been approved for fibromyalgia by any drug agency. Some SSRIs (such as the ones included in this review) are approved for anxiety and depressive disorders.
Quality of the evidence
Some of the included studies were published before the publication of the CONSORT statement, which might partly explain their low quality in data reporting (CONSORT 2010). The evidence of the benefits and harms of SSRIs compared to placebo and other active drugs is severely limited by the very low quality of evidence. There is no unbiased evidence that SSRIs are superior to placebo in treating the key symptoms of fibromyalgia, namely pain, fatigue and sleep problems.
Potential biases in the review process
Most studies analyzed were conducted before registers of clinical trials were established. Therefore we might have missed non‐published studies with negative results. We used an imputation method for responder analyzes.
Agreements and disagreements with other studies or reviews
Our results are in line with other recent systematic reviews and meta‐analyzes (that include the same RCTs) that the SSRIs, citalopram, fluoxetine, and paroxetine offer a small benefit over placebo for the relief of pain and depression, but are not superior to placebo in reducing other key symptoms of fibromyalgia, such as fatigue and sleep problems (Häuser 2009; Häuser 2012b; Sommer 2012). The use of the Cochrane 'Risk of bias' tool and GRADE approach to classify the quality of evidence in our review, point out that all statements on efficacy and harms of SSRIs are based on low quality evidence.
SSRIs were rather well tolerated during the trials; the dropout rate did not differ from placebo in our review. Overall adverse events were quite mild and not highly reported across studies. They were more common in the treatment groups than in the placebo groups, with dry mouth and sexual dysfunction being significantly more reported in the treatment groups. Treatment with SSRIs and serotonin/norepinephrine reuptake inhibitors (SNRIs) is associated with higher rates of sexual dysfunction than with other classes of antidepressants (Clayton 2014). All SSRIs showed similar frequency and range of adverse events, the most common ones being headache, dry mouth, nausea, fatigue, vertigo, sweating, nervousness, and sexual side effects. Nonetheless, Patkar 2007 reported a high percentage of adverse events (65.5% in the treatment group and 58.6% in the placebo one), but only a minority of patients withdrew for this reason. However, a large amount of clinical experience suggests that the safety we report may be overstated. Polypharmacy (the use of multiple medications) is a common issue for fibromyalgia patients. The reviewed trials all administered SSRIs without concomitant central‐acting medication therapies. SSRIs have potential drug interactions with tricyclic antidepressants, tramadol, triptans, carbamazepine, alcohol, diuretics, monamine oxidase inhibitors, and zolpidem, all which are often concomitantly used in fibromyalgia treatment. SSRIs also have withdrawal syndromes that are not considered in the studies we reviewed (Fava 2015). Lastly, SSRIs have been linked to increased suicidal tendency, leading the US Food and Drug Administration to issue a black box warning in 2007 (FDA 2007). The review authors suggest that the use of SSRIs in the general population will be more problematic than reflected in the results of this systematic review.
Despite low quality evidence reported here, most clinical practice guidelines recommend the use of SSRIs, mainly fluoxetine, either on its own or in combination with other tricyclic antidepressants. Thus, EULAR recommended the use of fluoxetine (strength of recommendation A) (Carville 2008), the American Society of Pain suggests the use of SSRIs such as fluoxetine, alone or in combination with tricyclics, for pain relief (strength of recommendation B) (Buckhardt 2005). In contrast, the German guideline on fibromyalgia gave only a weak recommendation for the use of SSRIs in patients with fibromyalgia plus depressive and/or anxiety disorder (Sommer 2012). Our review does not support the American Pain Society and EULAR recommendations.
SSRIs did not differ in their modest efficacy, tolerability, and low quality of evidence from amitriptyline and melatonin. This finding is in line with the results of all head‐to‐head comparisons of SSRIs with amitriptyline (Häuser 2012b) which we did not include in this review due to methodological reasons (see Excluded studies). As with SSRIs, there is no evidence that is both supportive and unbiased that demonstrates that amitriptyline has a beneficial effect (Moore 2012). A network meta‐analysis did not find significant differences between tricyclic agents, SSRIs, SNRIs, and anticonvulsants in reducing pain and limitations of disease‐related quality of life (Nüesch 2013). There is no evidence that SSRIs are superior or inferior to other commonly used fibromyalgia treatments.
Authors' conclusions
Implications for practice.
The total available evidence of the benefits and harms of SSRIs in fibromyalgia is of very low quality. We are uncertain whether taking SSRIs for an average of eight weeks improves fibromyalgia symptoms. Currently, SSRIs are not approved for fibromyalgia by international drug agencies. The US Food and Drug Administration black box warnings for increased suicidal tendency in young adults taking antidepressants should be kept in mind (FDA 2007).
Implications for research.
A re‐analysis of the data using baseline observation carried forward and responder analysis where discontinuation is classified as non‐response would allow a more precise estimate of the efficacy of SSRIs in fibromyalgia, likely reducing the effect size of the clinical benefits reported here.
Clinical effectiveness trials with antidepressants in fibromyalgia are necessary; they should provide information on the proportion of participants with a moderate or substantial response, with tolerable adverse events and with willingness to continue therapy (Moore 2010).
As fibromyalgia is a chronic illness, duration of studies should be substantially longer (at least 48 weeks) to investigate the long‐term use and adverse events of antidepressants.
Studies should include patients with other comorbidities, such as mood disorders and inflammatory rheumatic diseases.
Studies should include patients with different demographics, different disease durations and different severity levels to allow for conclusions to be generalized. Current studies are almost uniformly of middle‐aged Caucasian women.
The current recommended model for treatment of severe fibromyalgia cases is the utilization of a multidisciplinary approach (Ablin 2013). Future studies should consider SSRI use, both in isolation, as well as part of multidisciplinary programs and multiple drug regimens.
What's new
| Date | Event | Description |
|---|---|---|
| 6 February 2018 | Amended | Minor typographical correction in Figure 1; no changes on data or conclusions |
Acknowledgements
We are thankful to Ivan Solà for his help in running the November 2010 and February 2009 searches. This research was supported (in part) by the Intramural Research program of the National Institute of Health (NIH), National Institute of Nursing Research.
We thank Dr. Ricardo J Riera Lizardo for his assistance with data extraction.
The views expressed in this article are those of the authors and do not reflect the official policy of the Department of Army/Navy/Air Force, Department of Defense, or U.S. Government.
Appendices
Appendix 1. Search strategies and hits retrieved
| DATABASE (ACCESS) and date of search | Search strategy and hits retrieved |
|
MEDLINE (PubMed) 1 June 2014 |
#1 fibromyalgia[mh]
#2 fibromyalgi*[tiab]
#3 fibrositis[tiab]
#4 #1 OR #2 OR #3 8153 #5 randomized controlled trial[pt] #6 controlled clinical trial[pt] #7 randomized[tiab] #8 randomised[tiab] #9 randomly[tiab] #10 randomization[tiab] #11 randomisation[tiab] #12 random allocation[mh] #13 double‐blind method[mh] #14 “double blind”[tiab] #15 “double masked”[tiab] #16 placebo[mh] #17 placebo[tiab] #18 drug therapy[sh] #19 trial[tiab] #20 groups[tiab] #21 OR/5‐20 3344304 #22 animals[mh] NOT (animals[mh] AND humans[mh]) #23 #21 NOT #22 2869063 #24 #4 AND #23 2750 |
|
EMBASE (Accessed via Elsevier) 1 June 2014 |
#1 ‘fibromyalgia’/exp
#2 fibromyalgi*: ab,ti
#3 fibrositis:ab,ti #4 #1 OR #2 OR #3 14,348 #5 ‘controlled clinical trial’:de #6 ‘randomized controlled trial’:de #7 randomized:ab,ti #8 randomised:ab,ti #9 randomization:ab,ti #10 randomisation:ab,ti #11 randomly:ab,ti #12 randomization:de #13 placebo:de #14 placebo:ab,ti #15 ‘double blind procedure’:de #16 double AND blind:ti,ab #17 double masked:ti,ab #18 trial:ti,ab #19 OR/5‐18 1,345,881 #20 #4 AND #19 2,594 |
|
CENTRAL Cochrane Central Register of Controlled Trials Issue 5 of 12, May 2014 |
#1MeSH descriptor Fibromyalgia, explode all trees 518 #2 fibromyalgi*:ti,ab,kw 933 #3 fibrositis:ti,ab,kw 58 #4 #1 OR #2 OR #3 970 |
RCTs in fibromyalgia(update November 2010)
| DATABASE (ACCESS) and date of search | Search Strategy and hits retrieved |
|
MEDLINE (PubMed) 4.november.10 |
#1"Fibromyalgia"[Mesh] OR fibromyalgi*[ti] OR fibrositis[ti] 5248 #2 (randomized controlled trial[pt] OR controlled clinical trial[pt] OR randomized[tiab] OR placebo[tiab] OR drug therapy[sh] OR randomly[tiab] OR trial[tiab] OR groups[tiab]) NOT (animals[mh] NOT (humans[mh] AND animals[mh])) 2309479 #3 #1 AND #2 1682 #4 (#2) AND #1 Limits: Publication Date from 2009 312 |
|
CENTRAL (The Cochrane Library) 2010, Issue 10 |
#1MeSH descriptor Fibromyalgia explode all trees 449 #2 fibromyalgi* 755 #3 fibrositis 50 #4 #1 OR #2 OR #3 774 #5 (#1 OR #2 OR #3), from 2009 to 2010 137 (69 in clinical trials) |
|
EMBASE (Ovid) 4.november.10 |
1 exp Fibromyalgia/ 8833 2 fibromyalgia.ti,ab. 6702 3 exp Fibromyalgia/ 8833 4 fibrositis.ti. 271 5 1 or 2 or 3 or 4 9482 6 random:.tw. or placebo:.mp. or double‐blind:.mp. 776985 7 5 and 6 1417 8 limit 7 to yr="2009 ‐Current" 405 |
RCTs in fibromyalgia(initial search February 2009)
| DATABASE (ACCESS) and date of search | Search Strategy and hits retrieved |
|
MEDLINE (PubMed) 9.february.09 |
#1"Fibromyalgia"[Mesh] OR fibromyalgi*[ti] OR fibrositis[ti] 4433 #2 (randomized controlled trial[pt] OR controlled clinical trial[pt] OR randomized[tiab] OR placebo[tiab] OR drug therapy[sh] OR randomly[tiab] OR trial[tiab] OR groups[tiab]) AND humans [mh] 1912816 #3 #1 AND #2 1316 |
|
CENTRAL (The Cochrane Library) 2009, Issue 1 |
#1MeSH descriptor Fibromyalgia explode all trees 315 #2 fibromyalgi* 512 #3 fibrositis 36 #4 #1 OR #2 OR #3 526 |
|
EMBASE (Ovid) 9.february.09 |
1 exp Fibromyalgia/ 5537 2 fibromyalgia.ti,ab. 4304 3 exp Fibromyalgia/ 354 4 fibrositis.ti. 122 5 1 or 2 or 3 or 4 6046 6 random:.tw. or placebo:.mp. or double‐blind:.mp. 514373 7 5 and 6 886 |
Appendix 2. Criteria for risk of bias assessment for RCTs
Criteria for risk of bias assessment for RCTs
1. Random sequence generation (selection bias)
Selection bias (biased allocation to interventions) due to inadequate generation of a randomized sequence
There is a low risk of selection bias if the investigators describe a random component in the sequence generation process such as: referring to a random number table, using a computer random number generator, coin tossing, shuffling cards or envelopes, throwing dice, drawing of lots or minimization (minimization may be implemented without a random element, and this is considered to be equivalent to being random).
There is a high risk of selection bias if the investigators describe a non‐random component in the sequence generation process such as: sequence generated by odd or even date of birth, date (or day) of admission, hospital or clinic record number; or allocation by judgement of the clinician, preference of the participant, results of a laboratory test or a series of tests, or availability of the intervention.
2. Allocation concealment (selection bias)
Selection bias (biased allocation to interventions) due to inadequate concealment of allocations prior to assignment
There is a low risk of selection bias if the participants and investigators enrolling participants could not foresee assignment because one of the following, or an equivalent method, was used to conceal allocation: central allocation (including telephone, web‐based and pharmacy‐controlled randomization); sequentially numbered drug containers of identical appearance; or sequentially numbered, opaque, sealed envelopes.
There is a high risk of bias if participants or investigators enrolling participants could possibly foresee assignments and thus introduce selection bias, such as allocation based on: using an open randomallocation schedule (for example, a list of random numbers); assignment envelopes were used without appropriate safeguards (for example, if envelopes were unsealed or non‐opaque or not sequentially numbered); alternation or rotation; date of birth; case record number; or other explicitly unconcealed procedures.
3. Blinding of participants and of personnel/care providers (performance bias)
Performance bias due to knowledge of the allocated interventions by participants and by personnel/care providers during the study
There is a low risk of performance bias if blinding of participants was ensured and it was unlikely that the blinding could have been broken; or if there was no blinding or incomplete blinding, but the review authors judge that the outcome is not likely to be influenced by lack of blinding.
There is a low risk of performance bias if blinding of personnel was ensured and it was unlikely that the blinding could have been broken; or if there was no blinding or incomplete blinding, but the review authors judge that the outcome is not likely to be influenced by lack of blinding.
4. Blinding of outcome assessor (detection bias)
Detection bias due to knowledge of the allocated interventions by outcome assessors of patient reported outcomes
There is low risk of detection bias if the outcome assessor of patient‐reported outcomes is not the clinical investigator but a statistician not involved in the treatment of the patients. There is an unclear risk of bias if not details are reported who was the outcome assessor. There is a high risk of bias if the outcome assessor was involved in the treatment of the patients.
5. Incomplete outcome data (attrition bias)
Attrition bias due handling of incomplete outcome data
There is low risk of bias if all randomized patients were reported or analyzed in the group to which they were allocated by randomization and dropouts were analyzed by baseline observation forward method (BOCF). There is an unclear risk of bias if all randomized patients were reported or analyzed in the group to which they were allocated by randomization and dropouts were analyzed by last observation forward method (LOCF). There is a high risk of bias if there was no ITT analysis and only completers were reported.
6. Selective reporting (reporting bias)
Reporting bias due to selective outcome reporting
There is low risk of reporting bias if the study protocol is available and all of the study’s prespecified (primary and secondary) outcomes that are of interest in the review have been reported in the prespecified way, or if the study protocol is not available but it is clear that the published reports include all expected outcomes, including those that were prespecified (convincing text of this nature may be uncommon).
There is a high risk of reporting bias if not all of the study’s prespecified primary outcomes have been reported; one or more primary outcomes is reported using measurements, analysis methods or subsets of the data (for example, subscales) that were not prespecified; one or more reported primary outcomes were not prespecified (unless clear justification for their reporting is provided, such as an unexpected adverse effect); one or more outcomes of interest in the review are reported incompletely so that they cannot be entered in a meta‐analysis; the study report fails to include results for a key outcome that would be expected to have been reported for such a study.
7. Group similarity at baseline (selection bias)
Bias due to dissimilarity at baseline for the most important prognostic indicators. There is low risk of bias if groups are similar at baseline for demographic factors, value of main outcome measure(s), and important prognostic factors.
Data and analyses
Comparison 1. SSRI versus placebo.
| Outcome or subgroup title | No. of studies | No. of participants | Statistical method | Effect size |
|---|---|---|---|---|
| 1 At least 30% pain reduction | 6 | 343 | Risk Difference (IV, Random, 95% CI) | 0.10 [0.01, 0.20] |
| 1.1 Citalopram vs placebo | 2 | 82 | Risk Difference (IV, Random, 95% CI) | 0.14 [‐0.07, 0.35] |
| 1.2 Fluoxetine vs placebo | 2 | 93 | Risk Difference (IV, Random, 95% CI) | 0.13 [‐0.20, 0.45] |
| 1.3 Paroxetine vs placebo | 2 | 168 | Risk Difference (IV, Random, 95% CI) | 0.06 [‐0.07, 0.20] |
| 2 Global improvement | 6 | 330 | Risk Difference (IV, Random, 95% CI) | 0.14 [0.06, 0.23] |
| 2.1 Citalopram vs placebo | 2 | 82 | Risk Difference (IV, Random, 95% CI) | 0.14 [‐0.07, 0.34] |
| 2.2 Fluoxetine vs placebo | 3 | 132 | Risk Difference (IV, Random, 95% CI) | 0.15 [0.02, 0.27] |
| 2.3 Paroxetine vs placebo | 1 | 116 | Risk Difference (IV, Random, 95% CI) | 0.14 [‐0.00, 0.28] |
| 3 Fatigue | 2 | 76 | Std. Mean Difference (IV, Random, 95% CI) | ‐0.17 [‐0.62, 0.28] |
| 3.1 Citalopram vs placebo | 2 | 76 | Std. Mean Difference (IV, Random, 95% CI) | ‐0.17 [‐0.62, 0.28] |
| 4 Sleep problems | 6 | 309 | Std. Mean Difference (IV, Random, 95% CI) | ‐0.10 [‐0.33, 0.12] |
| 4.1 Citalopram vs placebo | 2 | 76 | Std. Mean Difference (IV, Random, 95% CI) | 0.05 [‐0.51, 0.62] |
| 4.2 Fluoxetine vs placebo | 2 | 65 | Std. Mean Difference (IV, Random, 95% CI) | ‐0.20 [‐0.69, 0.30] |
| 4.3 Paroxetine vs placebo | 1 | 52 | Std. Mean Difference (IV, Random, 95% CI) | 0.25 [‐0.30, 0.79] |
| 4.4 Fluoxetine vs placebo | 3 | 116 | Std. Mean Difference (IV, Random, 95% CI) | ‐0.32 [‐0.69, 0.05] |
| 5 Depression | 6 | 244 | Std. Mean Difference (IV, Random, 95% CI) | ‐0.39 [‐0.65, ‐0.14] |
| 5.1 Citalopram vs placebo | 2 | 76 | Std. Mean Difference (IV, Random, 95% CI) | ‐0.13 [‐0.59, 0.32] |
| 5.2 Fluoxetine vs placebo | 3 | 116 | Std. Mean Difference (IV, Random, 95% CI) | ‐0.55 [‐0.93, ‐0.18] |
| 5.3 Paroxetine vs placebo | 1 | 52 | Std. Mean Difference (IV, Random, 95% CI) | ‐0.44 [‐0.99, 0.11] |
| 6 Discontinuation due to adverse events | 5 | 284 | Risk Difference (IV, Random, 95% CI) | 0.04 [‐0.06, 0.14] |
| 6.1 Citalopram vs placebo | 1 | 51 | Risk Difference (IV, Random, 95% CI) | 0.29 [0.04, 0.54] |
| 6.2 Fluoxetine vs placebo | 2 | 65 | Risk Difference (IV, Random, 95% CI) | ‐0.09 [‐0.33, 0.15] |
| 6.3 Paroxetine vs placebo | 2 | 168 | Risk Difference (IV, Random, 95% CI) | 0.05 [‐0.02, 0.12] |
| 7 Serious adverse events | 2 | 168 | Risk Difference (IV, Random, 95% CI) | ‐0.01 [‐0.07, 0.05] |
| 7.1 Paroxetine vs placebo | 2 | 168 | Risk Difference (IV, Random, 95% CI) | ‐0.01 [‐0.07, 0.05] |
| 8 Pain intensity | 7 | 330 | Std. Mean Difference (IV, Random, 95% CI) | ‐0.37 [‐0.69, ‐0.04] |
| 8.1 Citalopram vs placebo | 2 | 76 | Std. Mean Difference (IV, Random, 95% CI) | ‐0.24 [‐0.69, 0.21] |
| 8.2 Fluoxetine vs placebo | 3 | 116 | Std. Mean Difference (IV, Random, 95% CI) | ‐0.72 [‐1.31, ‐0.13] |
| 8.3 Paroxetine vs placebo | 2 | 138 | Std. Mean Difference (IV, Random, 95% CI) | ‐0.09 [‐0.43, 0.25] |
| 9 Disease‐specific quality of life FIQ total score | 2 | 92 | Std. Mean Difference (IV, Random, 95% CI) | ‐0.70 [‐1.12, ‐0.28] |
| 9.1 Fluoxetine vs placebo | 2 | 92 | Std. Mean Difference (IV, Random, 95% CI) | ‐0.70 [‐1.12, ‐0.28] |
| 10 Physical functioning | 5 | 204 | Std. Mean Difference (IV, Random, 95% CI) | ‐0.06 [‐0.34, 0.21] |
| 10.1 Citalopram vs placebo | 2 | 77 | Std. Mean Difference (IV, Random, 95% CI) | 0.0 [‐0.45, 0.45] |
| 10.2 Fluoxetine vs placebo | 2 | 75 | Std. Mean Difference (IV, Random, 95% CI) | ‐0.27 [‐0.73, 0.19] |
| 10.3 Paroxetine vs placebo | 1 | 52 | Std. Mean Difference (IV, Random, 95% CI) | 0.13 [‐0.42, 0.67] |
| 11 Anxiety | 4 | 148 | Std. Mean Difference (IV, Random, 95% CI) | ‐0.11 [‐0.44, 0.21] |
| 11.1 Citalopram vs placebo | 1 | 35 | Std. Mean Difference (IV, Random, 95% CI) | ‐0.07 [‐0.73, 0.60] |
| 11.2 Fluoxetine vs placebo | 2 | 61 | Std. Mean Difference (IV, Random, 95% CI) | ‐0.33 [‐0.84, 0.19] |
| 11.3 Paroxetine vs placebo | 1 | 52 | Std. Mean Difference (IV, Random, 95% CI) | 0.09 [‐0.45, 0.64] |
| 12 Tenderness | 4 | 158 | Std. Mean Difference (IV, Random, 95% CI) | ‐0.23 [‐0.58, 0.11] |
| 12.1 Citalopram vs placebo | 1 | 42 | Std. Mean Difference (IV, Random, 95% CI) | ‐0.63 [‐1.25, ‐0.01] |
| 12.2 Fluoxetine vs placebo | 3 | 116 | Std. Mean Difference (IV, Random, 95% CI) | ‐0.10 [‐0.47, 0.27] |
Comparison 2. SSRI versus other drugs.
| Outcome or subgroup title | No. of studies | No. of participants | Statistical method | Effect size |
|---|---|---|---|---|
| 1 At least 30% pain reduction | 2 | 94 | Risk Difference (IV, Random, 95% CI) | ‐0.07 [‐0.35, 0.20] |
| 2 Global improvement | 1 | 43 | Risk Difference (IV, Random, 95% CI) | 0.13 [‐0.08, 0.35] |
| 3 Fatigue | 2 | 94 | Std. Mean Difference (IV, Random, 95% CI) | 0.21 [‐0.20, 0.61] |
| 4 Sleep problems | 2 | 94 | Std. Mean Difference (IV, Random, 95% CI) | 0.31 [‐0.10, 0.72] |
| 5 Depression | 2 | 93 | Std. Mean Difference (IV, Random, 95% CI) | 0.11 [‐0.40, 0.63] |
| 6 Discontinuation due to adverse events | 2 | 94 | Risk Difference (IV, Random, 95% CI) | 0.01 [‐0.05, 0.08] |
| 7 Pain intensity | 2 | 94 | Std. Mean Difference (IV, Random, 95% CI) | 0.02 [‐0.48, 0.51] |
| 8 Disease‐related quality of life | 1 | 43 | Std. Mean Difference (IV, Fixed, 95% CI) | ‐0.22 [‐0.82, 0.38] |
| 9 Physical functioning | 1 | 51 | Std. Mean Difference (IV, Random, 95% CI) | ‐0.46 [‐1.02, 0.10] |
| 10 Anxiety | 1 | 51 | Std. Mean Difference (IV, Random, 95% CI) | ‐0.27 [‐0.82, 0.28] |
| 11 Tenderness | 1 | 43 | Std. Mean Difference (IV, Random, 95% CI) | 0.31 [‐0.29, 0.91] |
Characteristics of studies
Characteristics of included studies [ordered by study ID]
Anderberg 2000.
| Methods |
Study setting: Single center study in Sweden Study design: Parallel Study duration: (1) duration wash‐out not reported, (2) 16 weeks titration and maintenance, (3) no follow‐up |
|
| Participants |
Inclusion criteria: ACR criteria (1990) Exclusion criteria: Patients with severe heart diseases, such as angina pectoris or post‐heart infarct, as well as brain infarction, suicidal thoughts or who were seriously depressed (in need of immediate psychiatric care), and who took major or minor tranquilizers, major antidepressants or strong analgesics No separate demographic data for citalopram (N = 20) and Placebo (N = 19) reported; total sample: 100% women, mean age 49 years, race not reported; citalopram pain baseline FIQ subscale 6.6 (SD 2.2); placebo pain baseline FIQ subscale 6.6 (SD 1.9); no FIQ total scores reported |
|
| Interventions |
Citalopram: 10‐40 mg/day p.o. Patients started with either 10 or 20 mg/day for the first week and increased the dose by 10 mg every fifth day up to either 30 or 40 mg/day Placebo: p.o. for 16 weeks Rescue medication: Paracetamol 500 mg twice daily or acetylsalicylic acid 1g twice daily were allowed Co‐therapies allowed or prohibited: No information provided |
|
| Outcomes |
At least 30% pain reduction: Calculated by imputation method Global improvement: Not reported Fatigue: FIQ subscale VAS 0‐10 Sleep problems: Item reduced sleep of the Montgomery Asberg Depression Rating Scale Drop out due to adverse: Reported Serious adverse events: Not reported Depression: FIQ subscale VAS 0‐10; total score of Montgomery Asberg Depression Rating Scale not reported Pain: VAS 0‐10 Disease‐related quality of life: FIQ total score VAS 0‐80 not reported Physical functioning: FIQ subscale 0‐10 Anxiety: FIQ subscale VAS 0‐10 Tenderness: Myalgic score |
|
| Notes | Adverse effects were more common in the citalopram‐treated group as compared to the placebo one. The most commonly seen side effects were headache, nausea, fatigue, vertigo, sweating, sexual side effects and dry mouth. Three patients stopped citalopram treatment after the first dose due to severe nausea and severe dizziness Funding: Supported by public grants |
|
| Risk of bias | ||
| Bias | Authors' judgement | Support for judgement |
| Random sequence generation (selection bias) | Low risk | "Randomisation was made at the medical products agency, and the investigator had a coded list" |
| Allocation concealment (selection bias) | Low risk | "The code was held secret to the involved investigators and patients until the end of study" |
| Blinding of participants and personnel (performance bias) All outcomes | Unclear risk | No information provided |
| Blinding of outcome assessment (detection bias) All outcomes | Unclear risk | No information provided |
| Incomplete outcome data (attrition bias) All outcomes | High risk | Completer analysis for most outcomes |
| Selective reporting (reporting bias) | High risk | FIQ total score and total score of Montgomery Asberg Depression Rating Scale not reported |
| Group similarity at baseline (selection bias) | Unclear risk | No demographic data of citalopram and placebo group reported |
Arnold 2002.
| Methods |
Study setting: Single center study in US Study design: Parallel Study duration: (1) duration wash‐out not reported, (2) 12 weeks titration and maintenance, (3) no follow‐up |
|
| Participants |
Inclusion criteria: At least 18 years of age and met the ACR criteria (1990) Exclusion criteria: Evidence of traumatic injury, inflammatory rheumatic disease, or infectious or endocrine‐related arthropathy; unstable medical illness; a lifetime history of hypomania, mania, psychosis or dementia; alcohol or substance dependence during the past months; substantial risk of suicide; any current Axis I disorder; a score >= 10 on the Hamilton Depression Rating Scale (0‐17); received any antidepressants within 2 weeks before randomisation; received investigational medications within 3 months before randomisation; previously received fluoxetine for fibromyalgia Fluoxetine: N = 30; Mean age 46 years; 100% women; 90% white; Pain baseline 6.1 (SD 1.9); FIQ total baseline 42 (SD 14) Placebo: N = 30; Mean age 46 years; 100% women; 97% white; Pain baseline 6.0 (SD 1.9); FIQ total baseline 44 (SD 14) |
|
| Interventions |
Fluoxetine 10‐80 mg p.o. 1/d for 12 weeks. Starting dose of 20 mg. After 2 weeks, the dose could be in 10‐ to 20‐mg increments every 2 weeks to a maximum of 80 mg/d Placebo p.o. 1/d for 12 weeks Rescue medication: Subjects were allowed to continue acetaminophen or NSAID on their usual schedule Co‐therapies allowed or prohibited: No information provided |
|
| Outcomes |
At least 30% pain reduction: Calculated by imputation method (>= 25% pain reduction scores reported) Global improvement: >= 25% improvement in FIQ total score Fatigue: FIQ subscale VAS 0‐10 Sleep problems: Not assessed Depression: FIQ subscale VAS 0‐10 Drop out due to adverse: Reported Serious adverse events: Not reported Pain: FIQ subscale VAS 0‐10 Disease‐related quality of life: FIQ total score VAS 0‐80 Physical functioning: FIQ subscale 0‐10 Anxiety: FIQ subscale VAS 0‐10 Tenderness: Myalgic score |
|
| Notes | High attrition rate (38.3%) Dropouts for any reasons: fluoxetine: 11/30 (36.6%), placebo: 12/30 (40%) The reasons for withdrawal were an adverse effect or event (n = 12), including nervousness, headache, insomnia, nausea, gastrointestinal reflux, increased appetite, decreased appetite or weight loss, fatigue, sedation, anorgasmia, weakness, decreased coordination, decreased concentration, migraine, worsening pain, herniated lumber disc, fall with muscle strain, ear pain, or diagnosis of breast cancer; lack of efficacy (n = 5); loss to follow‐up (n = 4); or for other reasons that were not related to medication (n = 2). There were no significant differences between the treatment groups in the incidence of these events Funding: Supported by an investor initiated grant by Eli‐Lilly |
|
| Risk of bias | ||
| Bias | Authors' judgement | Support for judgement |
| Random sequence generation (selection bias) | Unclear risk | No information provided |
| Allocation concealment (selection bias) | Unclear risk | No information provided |
| Blinding of participants and personnel (performance bias) All outcomes | Low risk | "All medication were in identical capsules" |
| Blinding of outcome assessment (detection bias) All outcomes | Unclear risk | No information provided |
| Incomplete outcome data (attrition bias) All outcomes | Unclear risk | ITT by LOCF |
| Selective reporting (reporting bias) | Unclear risk | Insufficient information about the protocol to permit judgment |
| Group similarity at baseline (selection bias) | Low risk | No significant differences between the two groups in demographic and clinical variables |
Goldenberg 1996.
| Methods |
Study setting: Single center study in US Study design: cross‐over Study duration: (1) Duration of wash‐out not reported, (2) each study period 6 weeks, separated by two weeks of wash‐out, (3) no follow‐up |
|
| Participants |
Inclusion criteria: Patients who met ACR criteria (1990). Age within 18‐60 years. Willingness to discontinue all central nervous system active medications, nonsteroidal antiinflammatory drugs, and analgesics (other than acetaminophen) for at least 1 week prior to the study. Pain VAS ≥ 30, Hamilton Rating Scale <= 18 Exclusion criteria: No current or past history of systemic illness (cardiac, kidney, haematological or liver disease) Total sample (N = 31): Age: 43 (SD 9.1) years; 90% female; 100 white; Pain baseline 68.4 (SD 20.4); FIQ total baseline 57.3 (17.6) |
|
| Interventions |
Amitryptiline: 25 mg p.o. fixed Fluoxetine : 20 mg p.o. fixed Amitriptyline 25mg + fluoxetine 20 mg p.o.: fixed Placebo: p.o. Rescue medication: acetaminophen Co‐therapies allowed or prohibited: no information provided |
|
| Outcomes |
At least 30% pain reduction: Calculated by imputation method Global improvement: Composite score (global well‐being, pain, tender point score, physician global VAS): >= 25% improvement on a 100‐point scale Fatigue: VAS 0‐100 Sleep problems: VAS 0‐100 Depression: Beck Depression Inventory Drop out due to adverse: Reported Serious adverse events: Not reported Pain: VAS 0‐100 Disease‐related quality of life: FIQ total score VAS 0‐80 Physical functioning: Not reported Anxiety: Not assessed Tenderness: Tender point score |
|
| Notes | High attrition rate (39%); withdrawals for any reason: amitriptyline 1/22 (4.5%), fluoxetine 4/26 (15%), amitrptyline + fluoxetine 5/24 (21%), placebo: 1/20 (5%). No details on adverse events reported. Carry‐over effects possible. Authors included a factor for periods effects in the analysis Funding: Public funding |
|
| Risk of bias | ||
| Bias | Authors' judgement | Support for judgement |
| Random sequence generation (selection bias) | Low risk | The pharmacy assigned patients using randomisation tables |
| Allocation concealment (selection bias) | Unclear risk | No details reported |
| Blinding of participants and personnel (performance bias) All outcomes | Low risk | "All tablets were identical in appearance" |
| Blinding of outcome assessment (detection bias) All outcomes | Low risk | "All evaluations were done by a physician who had no prior contact to the patients" |
| Incomplete outcome data (attrition bias) All outcomes | High risk | Completer analysis |
| Selective reporting (reporting bias) | Unclear risk | Insufficient information about the protocol to permit judgment |
| Group similarity at baseline (selection bias) | Low risk | Identical demographic and clinical data because of cross‐over design |
GSK 2005.
| Methods |
Study setting: Single center study, Belgium Study design: Parallel Study duration: (1) duration wash‐out not reported, (2) maintenance 8 weeks, (3) no follow‐up |
|
| Participants |
Inclusion criteria: ACR criteria (1990) and having concomitant depressive symptoms. Minimum score of 4 on the VAS for global or pain assessment Exclusion criteria: Patients with known rheumatic or other organic diseases, current treatment with anticoagulants or anti‐arrhythmics, current suicidal risk, psychiatric disorders, abusers of alcohol or illicit drugs, abnormalities in haematology, pregnant or lactating women and women of childbearing potential who did not use adequate contraception. Previous prolonged treatment with paroxetine Paroxetine (N = 26): Mean age 44, 73% women, race not reported; pain baseline: 69 (SD 20.4) Placebo (N = 26); mean age 46, 81% women, race not reported, pain baseline 64 (SD 20.4) |
|
| Interventions |
Paroxetine: 20 mg/day p.o. fixed for 8 weeks Placebo p.o. for 8 weeks Rescue medication: No information provided Co‐therapies allowed or prohibited: No information provided |
|
| Outcomes |
At least 30% pain reduction: Calculated by imputation method Global improvement: Health assessment questionnaire; no baseline values reported Fatigue: Not assessed Sleep: VAS 0‐100 Depression: VAS 0‐100 Drop out due to adverse: Reported Serious adverse events (considered to be related to study medication): Reported Pain: VAS 0‐100 Disease‐related quality of life: FIQ total score VAS 0‐80 Physical functioning: Not reported Anxiety: VAS 0‐100 Tenderness: Tender point score not reported |
|
| Notes | Dropouts for any reason: paroxetine: 8/26 (31%), placebo: 5/26 (19%) Adverse effects were common in both groups. The most commonly seen adverse events were infectious illness, gastro‐intestinal complaints, headache, and musculoskeletal complaints. Five patients (19%) in the paroxetine group and four (15%) in the placebo group withdrew due to adverse events; one patient (4%) in the placebo group withdrew due to lack of efficacy and three (12%) in the paroxetine group withdrew for other reasons. There were three serious adverse events: one in the paroxetine group (acute depression) and two in the placebo group: stroke and abscess in thigh Funding: The study was funded by Glaxo |
|
| Risk of bias | ||
| Bias | Authors' judgement | Support for judgement |
| Random sequence generation (selection bias) | Unclear risk | Information not available |
| Allocation concealment (selection bias) | Unclear risk | Information not available |
| Blinding of participants and personnel (performance bias) All outcomes | Unclear risk | Information not available |
| Blinding of outcome assessment (detection bias) All outcomes | Unclear risk | No information provided |
| Incomplete outcome data (attrition bias) All outcomes | High risk | Completer analysis |
| Selective reporting (reporting bias) | Unclear risk | Protocol not available |
| Group similarity at baseline (selection bias) | Low risk | No significant differences between paroxetine and placebo in demographic and clinical parameters |
Hussain 2010.
| Methods |
Study setting: Single center study in Iraq Study design: Parallel Study duration: (1) Duration of wash‐out not reported, (2) maintenance 4 weeks (3) no follow‐up |
|
| Participants |
Inclusion criteria: Primary fibromyalgia (fibromyalgia) according to the ACR criteria
Exclusion criteria: Other marked pathologic disorders that may interfere with the outcome of the study protocol as revealed by the clinical investigation. Patients who were pregnant or breastfeeding were excluded Total sample: Mean age 39 years; 94% female; race not reported; Pain baseline fluoxetine (N = 24) 7.64 ((SD 1.8); Pain baseline melatonin (N = 27) 8.33 (SD 1.1) |
|
| Interventions |
Fluoxetine (N = 24): 20 mg/d p.o. fixed Melatonine (N = 27): 5 mg/d p.o. fixed Rescue medication: No information provided Co‐therapies allowed or prohibited: They were not on analgesic, antiinflammatory drugs, or antioxidant therapy including aspirin |
|
| Outcomes |
At least 30% pain reduction: Calculated by imputation method Global improvement: No imputation method applicable (FIQ total score mot reported) Fatigue: VAS 0‐10 Sleep problems: VAS 0‐10 Drop out due to adverse: There were no dropouts according to analyzes presented Serious adverse events: Not reported Pain: VAS 0‐10 Disease‐related quality of life: FIQ total score not reported Physical function: VAS 0‐10 Depression: VAS 0‐10 Anxiety: VAS 0‐10 Tenderness: Not assessed |
|
| Notes | No details on adverse events reported Funding: Public funding |
|
| Risk of bias | ||
| Bias | Authors' judgement | Support for judgement |
| Random sequence generation (selection bias) | Unclear risk | We had insufficient information to permit judgement |
| Allocation concealment (selection bias) | Unclear risk | We had insufficient information to permit judgement |
| Blinding of participants and personnel (performance bias) All outcomes | Unclear risk | We had insufficient information to permit judgement |
| Blinding of outcome assessment (detection bias) All outcomes | Unclear risk | We had insufficient information to permit judgement |
| Incomplete outcome data (attrition bias) All outcomes | Unclear risk | Probably ITT; no details reported |
| Selective reporting (reporting bias) | Unclear risk | We had insufficient information to permit judgement |
| Group similarity at baseline (selection bias) | Unclear risk | We had insufficient information to permit judgement |
Norregaard 1995.
| Methods |
Study setting: Single center study in Denmark Study design: Parallel Study duration: (1) Duration wash‐out not reported, (2) maintenance 8 weeks, (3) no follow‐up |
|
| Participants |
Inclusion criteria: ACR criteria (1990) Exclusion criteria: Cardiovascular, pulmonary or hepatic diseases, glaucoma, were pregnant or lactating, had an earlier diagnosis of endogenous depression or received antidepressant medication or monoamine oxidase inhibitors. If they received opioids other than codeine they had to stop the treatment at least 2 weeks before the trial in order to participate. Two patients were taking a low dose of dextropropoxyphene 2 weeks before the inclusion.They were also excluded if they suffered from inflammatory rheumatological disease or had laboratory tests suggesting other medical diseases. Citalopram (n = 21): Mean age 48 years; gender and race not reported: Pain 6.3 (SD 2); FIQ total score not reported Placebo (n = 21): Mean age 50 years; gender and race not reported: Pain 6.7 (SD 1.9); FIQ total score not reported |
|
| Interventions |
Citalopram flexible 20‐40 mg/day p.o. for 8 weeks Placebo p.o. for 8 weeks Rescue medication: No details reported Co‐therapies allowed or prohibited: People were allowed to take usual concomitant medication like acetaminophen, codeine or NSAIDs |
|
| Outcomes |
At least 30% pain reduction: Calculated by imputation method Global improvement: At least 25% improvement of global well‐being (VAS 0‐10) calculated by imputation method Fatigue: VAS 0‐10 Sleep problems: VAS 0‐10 Depression: Beck Depression Inventory 0‐63 Drop out due to adverse: Reported Serious adverse events: Not reported Pain: VAS 0‐100 Disease‐related quality of life: FIQ total score VAS 0‐80 assessed but not reported Physical functioning: FIQ 0‐3 Anxiety: Not assessed Tenderness: Tender points count 0‐18 |
|
| Notes | Total dropouts: 10/42 (24%). Unclear which group they belonged to or reason for dropping out (side‐effect or no effect). The reported side effects (dry mouth, nausea/vomiting, fatigue, sleep disturbance, headache) were few and similar in both groups, with no statistically significant differences Funding: Funding by the manufacturer of the drug (H. Lundbeck) |
|
| Risk of bias | ||
| Bias | Authors' judgement | Support for judgement |
| Random sequence generation (selection bias) | Unclear risk | “22 patients with fibromyalgia were randomised” |
| Allocation concealment (selection bias) | Unclear risk | Not details reported |
| Blinding of participants and personnel (performance bias) All outcomes | Low risk | All tablets were identical in appearance |
| Blinding of outcome assessment (detection bias) All outcomes | Unclear risk | No information provided |
| Incomplete outcome data (attrition bias) All outcomes | High risk | No ITT |
| Selective reporting (reporting bias) | Unclear risk | Insufficient information about the protocol to permit judgment |
| Group similarity at baseline (selection bias) | Unclear risk | We had insufficient information to permit judgement |
Patkar 2007.
| Methods |
Study setting: Two‐sites, study in US Study design: Parallel Duration: (1) One week single‐blind placebo run‐in and wash‐out; placebo responders (>= 25% reduction of FIQ total score were excluded; (2) 12 weeks maintenance; (3) no follow‐up |
|
| Participants | Inclusion criteria: 18‐65 years of age, who fulfilled ACR criteria (1990). Other inclusion criteria included a Visual Analogue Scale for pain score of ≥ 5 and a Beck Depression Inventory score of ≤ 23 at screening and placebo lead‐in visits Exclusion criteria: Inflammatory disease, unstable medical diseases, psychotic disorders, current depressive or anxiety disorders, substance abuse in the previous 12 months, history of hypersensitivity to paroxetine paroxetine controlled release, involvement in workers compensation or related litigation, or pregnancy Paroxetine (N = 58): Mean age 48 years; 95% female; race not reported; pain baseline 74.2 (SD 22.7); FIQ total score 53 (SD 8.9) Placebo (N = 58); Mean age 49 years;93% female; race not reported; pain baseline 75.3 (SD 19.8); FIQ total score 49 (SD 12.2) |
|
| Interventions |
Paroxetine‐controlled release: flexible starting at a dose of 12.5 mg/day till 62.5 mg/day p.o. if tolerated Placebo: oral Rescue medication: Acetaminophen up to 4 g/day, ibuprofen up to 1.2 g/day Co‐therapies allowed or prohibited: Concomitant medication exclusion included psychotropics, analgesics,muscle relaxants, steroids, and hypnotics |
|
| Outcomes |
At least 30% pain reduction: Calculated by imputation method; at least 25% pain reduction rates reported Global improvement: FIQ total score >= 50% reduction reported Fatigue: FIQ subscale VAS 0‐10 * Sleep problems: Not assessed Drop out due to adverse: Reported Serious adverse events: Reported Pain: VAS 0‐100 Disease‐related quality of life: FIQ total score VAS 0‐80 ** Depression: Beck Depression Inventory 0‐63 *** Anxiety: Beck Anxiety inventory 0‐63 **** Tenderness: Tender points count 0‐18 ***** |
|
| Notes |
Dropouts due to any reason: Paroxetine: 20 (34.4%), Placebo: 10 (17.4%) Any treatment‐emergent adverse event was reported by 38 (65.5%) of the drug and 34 (58.6%) of the placebo groups. Adverse events were cited as the reason for study discontinuation by 4 subjects receiving paroxetine controlled release and 1 subject receiving placebo. Drowsiness, dry mouth, female genital disorders, ejaculatory problems, impotence, anxiety, and blurred vision were reported with ≥2 fold frequency with paroxetine controlled release than placebo * Paroxetine was superior to placebo (P < 0.05); no means or SD reported ** Paroxetine was superior to placebo (P = 0.02); no means or SDs reported *** Paroxetine was not superior to placebo (P = 0.08); no means or SD reported **** Paroxetine was superior to placebo (P < 0.05); no means or SD reported ***** Paroxetine was not superior to placebo (no P values reported); no means or SD reported Funding: By manufacturer of the drug (Glaxo Smith Kline) |
|
| Risk of bias | ||
| Bias | Authors' judgement | Support for judgement |
| Random sequence generation (selection bias) | Low risk | Computer‐generated sequence |
| Allocation concealment (selection bias) | Low risk | "The allocation sequence was concealed from the staff before and after assignment" |
| Blinding of participants and personnel (performance bias) All outcomes | Low risk | "The study drug and placebo were identical in appearance and taste" |
| Blinding of outcome assessment (detection bias) All outcomes | Unclear risk | No information provided |
| Incomplete outcome data (attrition bias) All outcomes | Unclear risk | ITT with LOCF performed |
| Selective reporting (reporting bias) | Unclear risk | Insufficient information about the protocol to permit judgment |
| Group similarity at baseline (selection bias) | Low risk | No significant difference between the two groups in demographic and clinical variables |
Wolfe 1994.
| Methods |
Study setting: Single‐center study in US Study design: Parallel Study duration: (1) Duration wash‐out not reported; (2) maintenance 6 weeks, (3) no follow‐up |
|
| Participants |
Inclusion criteria: ACR criteria (1990), at least 7 of 14 tender points, 21‐70 years, VAS pain => 1 (0‐3)
Exclusion criteria: Other rheumatic disease, previously treated with fluoxetine Fluoxetine (n = 21): Mean age 48 years: 100% female; 100% white; Pain baseline (VAS 0‐3) 1.7 (SD 0.48): Placebo (n = 21): Mean age 53 years: 100% female; 95% white; Pain baseline (VAS 0‐3) 1.8 (SD 0.81): |
|
| Interventions |
Fluoxetine: 20 mg, 1/d, p.o., fixed
Placebo: 1/d, p.o. Rescue medication: No information provided Co‐therapies allowed or prohibited: NSAIDs and acetaminophen were allowed |
|
| Outcomes |
At least 30% pain reduction: Calculated by imputation method Global improvement: At least 25% reduction of global severity score (VAS 0‐100) calculated by imputation method, Fatigue: VAS 0‐15 Sleep problems: VAS 0‐15 Depression: AIMS Depression: 0‐9.9 Drop out due to adverse: Reported Serious adverse events: Not reported Death: Not reported Pain: VAS 0‐3 Disease‐related quality of life: Not assessed Physical functioning: Health assessment questionnaire HAQ 0‐3 Anxiety: AIMS Anxiety 0‐9.9 Tenderness: Dolorimetry score |
|
| Notes | High attrition rate (43%) The number of total adverse events did not differ between the placebo and fluoxetine groups. Most common adverse event was nausea. Other reported events: rash, headache, diarrhoea, bruising, dyspepsia. Sample size was calculated but the recruitment did not reach the planned number of patients. The ITT was only made for depression scores. Funding: by manufacturer of the drug (Eli Lilly) |
|
| Risk of bias | ||
| Bias | Authors' judgement | Support for judgement |
| Random sequence generation (selection bias) | Low risk | Assignment was made by the use of a computer‐generated random number table |
| Allocation concealment (selection bias) | Unclear risk | Information not reported |
| Blinding of participants and personnel (performance bias) All outcomes | Unclear risk | Information not reported |
| Blinding of outcome assessment (detection bias) All outcomes | Unclear risk | Information not reported |
| Incomplete outcome data (attrition bias) All outcomes | High risk | No ITT |
| Selective reporting (reporting bias) | Unclear risk | Insufficient information about the protocol to permit judgment |
| Group similarity at baseline (selection bias) | Low risk | No significant differences between the groups in demographic and clinical variables |
ACR: American College of Rheumatology FIQ: Fibromyalgia Impact Questionnaire ITT: intention‐to‐treat LOCF: last observation carried forward NSAID: non‐steroidal anti‐inflammatory drug p.o.: by mouth SD: standard deviation VAS: visual analogue scale
Characteristics of excluded studies [ordered by study ID]
| Study | Reason for exclusion |
|---|---|
| Ataoglu 1997 | Open trial |
| Cantini 1994 | Open trial |
| Cantini 1995 | Open trial |
| Capaci 2002 | Single‐blind trial |
| De Vanna 1998 | Cross‐over study with no wash‐out period; Outcomes only in graphics |
| Erhan 2000 | Cross‐over study with 15 fibromyalgia‐patients comparing amitriptyline and fluvoxamine; no wash‐out periods reported; no tests of carry over effects conducted |
| Giordano 1999 | Single‐blind trial |
| Gonzalez‐Viejo 2005 | Compared sertraline versus ultrasonography and physiotherapy |
| Nishikai 2003 | Open trial |
| Ozerbil 2006 | Compared fluoxetine versus amitriptyline, using an outcome not included in our review (VO2 max)/Wingate anaerobic test) |
| Sencan 2004 | Compared paroxetine with aerobic exercise and transcutaneous electrical nerve stimulation (TENS) placebo |
Differences between protocol and review
The original protocol for this review is entitled 'Antidepressants and centrally active agents for fibromyalgia syndrome'. It was published in 2006 (Nishishinya 2006) has been split into several systematic reviews that will be/have been published as:
Anticonvulsants for fibromyalgia (Üceyler 2013b)
Monoamine oxidase inhibitors (MAOIs) for fibromyalgia syndrome (Tort 2012)
Non‐steroidal anti‐inflammatory drugs (NSAIDs), analgesics and opioids for fibromyalgia
Sedatives and hypnotic agents for fibromyalgia
Selective serotonin reuptake inhibitors (SSRIs) for fibromyalgia
Serotonin and noradrenaline reuptake inhibitors (SNRIs) for fibromyalgia syndrome (Häuser 2013b)
Tricyclic agents for fibromyalgia
The 'clinical relevant tables' and the 'grading system' due to be performed as mentioned in the original protocol have been superseded by the new guidelines for 'Summary of findings' tables, and GRADE, and the new 'Risk of bias' tool for Cochrane reviews.
Contributions of authors
SC performed the June 2014 search. BN, GU, BW, SC, and WH were involved in the initial screening of articles. BN, GU, and WH were involved in the data extraction and risk of bias assessment, with the help of BW. BW, GU, SC, and WH wrote the manuscript.
Sources of support
Internal sources
Iberoamerican Cochrane Centre, Spain.
External sources
Agencia d'Avaluació de Tecnologia i Recerca Mèdiques (146/24/2004), Spain.
Declarations of interest
WH received an honorarium for consulting for study design by Daiichi Sankyo and honoraria for educational lectures by Abbott Germany, MSD Sharp & Dohme and Pfizer.
The other authors have no conflcits of interest to declare.
Edited (no change to conclusions)
References
References to studies included in this review
Anderberg 2000 {published data only}
- Anderberg UM, Marteinsdottir I, Knorring L. Citalopram in patients with fibromyalgia‐a randomized, double‐blind, placebo‐controlled study. European Journal of Pain 2000;4(1):27‐35. [DOI] [PubMed] [Google Scholar]
Arnold 2002 {published data only}
- Arnold LM, Hess EV, Hudson JI, Welge JA, Berno SE, Keck PE Jr. A randomized, placebo‐controlled, double‐blind, flexible‐dose study of fluoxetine in the treatment of women with fibromyalgia. American Journal of Medicine 2002;112(3):191‐7. [DOI] [PubMed] [Google Scholar]
Goldenberg 1996 {published data only}
- Goldenberg D, Mayskiy M, Mossey C, Ruthazer R, Schmid C. A randomized, double‐blind crossover trial of fluoxetine and amitriptyline in the treatment of fibromyalgia. Arthritis and Rheumatism 1996;39(11):1852‐9. [DOI] [PubMed] [Google Scholar]
GSK 2005 {published data only}
- GlaxoSmithKline. Treatment of fibromyalgia: a randomized, double blind, placebo‐controlled study of paroxetine, a selective serotonin re‐uptake inhibitor. Study ID 29060/433. http://www.gsk‐clinicalstudyregister.com/.
Hussain 2010 {published data only}
- Hussain SA, Al‐Khalifa II, Jasim NA, Gorial F. Adjuvant use of melatonin for treatment of fibromyalgia. Journal of Pineal Research 2011;50(3):267‐71. [DOI] [PubMed] [Google Scholar]
Norregaard 1995 {published data only}
- Norregaard J, Volkmann H, Danneskiold‐Samsoe B. A randomized controlled trial of citalopram in the treatment of fibromyalgia. Pain 1995;61(3):445‐9. [DOI] [PubMed] [Google Scholar]
Patkar 2007 {published data only}
- Patkar AA, Masand PS, Krulewicz S, Mannelli P, Peindl K, Beebe KL, et al. A randomized, controlled, trial of controlled release paroxetine in fibromyalgia. The American Journal of Medicine 2007;120:448‐54. [DOI] [PubMed] [Google Scholar]
Wolfe 1994 {published data only}
- Wolfe F, Cathey MA, Hawley DJ. A double‐blind placebo controlled trial of fluoxetine in fibromyalgia. Scandinavian Journal of Rheumatology 1994;23(5):255‐9. [DOI] [PubMed] [Google Scholar]
References to studies excluded from this review
Ataoglu 1997 {published data only}
- Ataoglu S, Ataoglu A, Erdogan F, Saraç J. Comparison of paroxetine, amitriptyline in the treatment of fibromyalgia. Turkish Journal of Medical Science 1997;27:535‐9. [Google Scholar]
Cantini 1994 {published data only}
- Cantini F, Bellandi F, Niccoli L, Munno O. Fluoxetin combined with cyclobenzaprine in the treatment of fibromyalgia. [Italian]. Minerva Medicine 1994;85(3):97‐100. [PubMed] [Google Scholar]
Cantini 1995 {published data only}
- Cantini F, Niccoli L, Bellandi F, Munno O. Effectiveness of fluoxetine associated with cyclobenzaprine in the treatment of fibromyalgia: Twelve‐months‐follow up results. [Italian]. Reumatismo 1995;47(2):103‐8. [Google Scholar]
Capaci 2002 {published data only}
- Capaci K, Hepguler S. Comparison of the effects of amitriptyline and paroxetine in the treatment of fibromyalgia syndrome. The Pain Clinic 2002;14(3):223‐8. [Google Scholar]
De Vanna 1998 {published data only}
- Vanna M, Ventre L. Fluoxetine and primary fibromyalgic syndrome: A double blind study. [Italian]. Medicina Psicosomatica 1998;43(2):73‐82. [Google Scholar]
Erhan 2000 {published data only}
- Erhan E, Uyar M, Turan S, Yegül I, Tuglular L, Gökçe, et al. Fluvoxamine versus amitriptyline in the treatment of fibromyalgia. Agri 2000;12:32‐6. [Google Scholar]
Giordano 1999 {published data only}
- Giordano N, Geraci S, Santacroce C, Mattii G, Battisti E, Gennari C. Efficacy and tolerability of paroxetine in patients with fibromyalgia syndrome: A single‐blind study. Current Therapeutic Research, Clinical and Experimental 1999;60(12):696‐702. [Google Scholar]
Gonzalez‐Viejo 2005 {published data only}
- Gonzalez‐Viejo MA, Avellanet M, Hernandez‐Morcuende MI. A comparative study of fibromyalgia treatment: ultrasonography and physiotherapy versus sertraline treatment. [French]. Annales de Réadaptation et de Médicine Physique 2005;48(8):610‐5. [DOI] [PubMed] [Google Scholar]
Nishikai 2003 {published data only}
- Nishikai M, Akiya K. Fluvoxamine therapy for fibromyalgia. Journal of Rheumatology 2003;30(5):1124. [PubMed] [Google Scholar]
Ozerbil 2006 {published data only}
- Ozerbil O, Okudan N, Gökbel H, Levendoglu F. Comparison of the effects of two antidepressants on exercise performance of the female patients with fibromyalgia. Clinical Rheumatology 2006;25(4):495‐7. [DOI] [PubMed] [Google Scholar]
Sencan 2004 {published data only}
- Sencan S, Ak S, Karan A, Muslumanoglu L, Ozcan E, Berker E. A study to compare the therapeutic effect of aerobic exercise and paroxetine in fibromyalgia syndrome. Journal of Back and Musculoskeletal Rehabilitation 2004;17:57‐61. [Google Scholar]
Additional references
Ablin 2013
- Ablin J, Fitzcharles MA, Buskila D, Shir Y, Sommer C, Häuser W. Treatment of fibromyalgia syndrome: recommendations of recent evidence‐based interdisciplinary guidelines with special emphasis on complementary and alternative therapies. Evidence‐Based Complementary Alternative Medicine 2013 Nov 21 [Epub ahead of print]. [DOI] [PMC free article] [PubMed]
Arnold 2013
- Arnold LM, Fan J, Russell IJ, Yunus MB, Khan MA, Kushner I, et al. The fibromyalgia family study: a genome‐wide linkage scan study. Arthritis and Rheumatism 2013;65:1122‐8. [DOI] [PMC free article] [PubMed] [Google Scholar]
Balshem 2008
- Balshem H, Helfand M, Schunemann HJ, Oxman AD, Kunz R, Brozek J, et al. GRADE guidelines: 3. Rating the quality of evidence. Journal of Clinical Epidemiology 2011;64(4):401‐6. [DOI] [PubMed] [Google Scholar]
Bennett 2007
- Bennett RM, Jones J, Turk DC, Russell IJ, Matallana L. An internet survey of 2,596 people with fibromyalgia. BMC Musculoskeletal Disorders 2007;8:27. [DOI] [PMC free article] [PubMed] [Google Scholar]
Bradley 2009
- Bradley LA. Pathophysiology of fibromyalgia. American Journal of Medicine 2009;122(12 Suppl):S22‐30. [DOI] [PMC free article] [PubMed] [Google Scholar]
Branco 2010
- Branco JC, Bannwarth B, Failde I, Abello Carbonell J, Blotman F, Spaeth M. Prevalence of fibromyalgia: a survey in five European countries. Seminars in Arthritis and Rheumatism 2010;39:448‐53. [DOI] [PubMed] [Google Scholar]
Buckhardt 2005
- Buckhardt CS, Goldenberg D, Crofford L, Gerwin R, Gowens S, Jackson K, et al. Guideline for the Management of Fibromyalgia Syndrome Pain in Adults and Children. Glenview: American Pain Society (APS), 2005. [Google Scholar]
Carville 2008
- Carville SF, Arendt‐Nielsen S, Bliddal H, Blotman F, Branco JC, Buskila D, et al. EULAR evidence‐based recommendations for the management of fibromyalgia syndrome. Annals of Rheumatic Diseases 2008;67(4):536. [DOI] [PubMed] [Google Scholar]
Clayton 2014
- Clayton AH, Croft HA, Handiwala L. Antidepressants and sexual dysfunction: mechanisms and clinical implications. Posgraduate Medicine 2014;126:91‐9. [DOI] [PubMed] [Google Scholar]
CMSG 2014
- Cochrane Musculoskeletal Group. Proposed Outcomes for Summary of Findings. http://musculoskeletal.cochrane.org/proposed‐outcomes 2014.
Cohen 1988
- Cohen J. Statistical Power Analysis for the Behavioral Sciences. Vol. 1, Hillsdale: Lawrence Erlbaum Associates, 1988. [Google Scholar]
CONSORT 2010
- Moher D, Hopewell S, Schulz KF, Montori V, Gotzsche PC, Devereaux PJ, et al. CONSORT 2010 Explanation and Elaboration: updated guidelines for reporting parallel group randomised trials. BMJ 2010;340:c869. [DOI] [PMC free article] [PubMed] [Google Scholar]
Fava 2015
- Fava GA, Gatti A, Belaise C, Guidi J, Offidani E. Withdrawal symptoms after selective serotonin reuptake inhibitor discontinuation: a systematic review. Psychotherapy Psychosomatics 2015;84:72‐81. [DOI] [PubMed] [Google Scholar]
Fayers 2014
- Fayers PM, Hays RD. Don’t middle your MIDs: regression to the mean shrinks estimates of minimally important differences. Qual Life Res 2014;23:1‐4. [DOI] [PMC free article] [PubMed] [Google Scholar]
FDA 2007
- FDA Proposes New Warnings About Suicidal Thinking, Behavior in Young Adults Who Take Antidepressant Medications. Available from http://www.fda.gov (accessed May 2008).
Furukawa 2005
- Furukawa TA, Cipriani A, Barbui C, Brambilla P, Watanabe N. Imputing response rates from means and standard deviations in meta‐analyses. International Clinical Psychopharmacology 2005;20:49‐52. [DOI] [PubMed] [Google Scholar]
Haviland 2012
- Haviland MG, Banta JE, Przekop P. Hospitalisation charges for fibromyalgia in the United States, 1999‐2007. Clinical Experimental Rheumatology 2012;30(6 Suppl 74):129‐35. [PubMed] [Google Scholar]
Higgins 2011
- Higgins JPT, Green S (editors). Cochrane Handbook for Systematic Reviews of Interventions Version 5.1.0 [updated March 2011]. The Cochrane Collaboration, 2011. Available from www.cochrane‐handbook.org. The Cochrane Collaboration.
Häuser 2009
- Häuser W, Bernardy K, Uçeyler N, Sommer C. Treatment of fibromyalgia syndrome with antidepressants: a meta‐analysis. JAMA 2009;301(2):198‐209. [DOI] [PubMed] [Google Scholar]
Häuser 2011
- Häuser W, Kosseva M, Üceyler N, Klose P, Sommer C. Emotional, physical, and sexual abuse in fibromyalgia syndrome: a systematic review with meta‐analysis. Arthritis Care and Research 2011;63:808‐20. [DOI] [PubMed] [Google Scholar]
Häuser 2012a
- Häuser W, Jung E, Erbslöh‐Möller B, Gesmann M, Kühn‐Becker H, Petermann F, Langhorst J, Weiss T, Thoma R, Winkelmann A. German fibromyalgia consumer reports. Benefits and harms of fibromyalgia syndrome therapies. [German]. Schmerz 2012;26(2):150‐9. [DOI] [PubMed] [Google Scholar]
Häuser 2012b
- Häuser W, Wolfe F, Tölle T, Uçeyler N, Sommer C. The role of antidepressants in the management of fibromyalgia syndrome: a systematic review and meta‐analysis. CNS Drugs 2012;26:297‐307. [DOI] [PubMed] [Google Scholar]
Häuser 2013a
- Häuser W, Galek A, Erbslöh‐Möller B, Köllner V, Kühn‐Becker H, Langhorst J, et al. Posttraumatic stress disorder in fibromyalgia syndrome: prevalence, temporal relationship between posttraumatic stress and fibromyalgia symptoms, and impact on clinical outcome. Pain 2013;154(8):1216‐23. [DOI] [PubMed] [Google Scholar]
Häuser 2013b
- Häuser W, Urrútia G, Tort S, Uçeyler N, Walitt B. Serotonin and noradrenaline reuptake inhibitors (SNRIs) for fibromyalgia syndrome. Cochrane Database of Systematic Reviews 2013, Issue 1. [DOI: 10.1002/14651858.CD010292] [DOI] [PubMed] [Google Scholar]
Knight 2013
- Knight T, Schaefer C, Chandran A, Zlateva G, Winkelmann A, Perrot S. Health‐resource use and costs associated with fibromyalgia in France, Germany, and the United States. ClinicoEconomics and Outcomes Research 2013;5:171‐180. [DOI] [PMC free article] [PubMed] [Google Scholar]
Lange 2010
- Lange M, Petermann F. Influence of depression on fibromyalgia : A systematic review. Schmerz 2010;24:326‐33. [DOI] [PubMed] [Google Scholar]
Lee 2010
- Lee YH, Choi SJ, Ji JD, Song GG. Candidate gene studies of fibromyalgia: a systematic review and meta‐analysis. Rheumatology International 2010;32:417‐26. [DOI] [PubMed] [Google Scholar]
Legagneux 2001
- Legangneux E, Mora JJ, Spreux‐Varoquaux O, Thorin I, Herrou M, Alvado G, et al. Cerebrospinal fluid biogenicamine metabolites, plasma‐rich platelet serotonin and [3H]imipramine reuptake in the primary fibromyalgia syndrome. Rheumatology 2001;40(3):290‐6. [DOI] [PubMed] [Google Scholar]
Marschall 2011
- Marschall U, Arnold B, Häuser W. Treatment and healthcare costs of fibromyalgia syndrome in Germany: analysis of the data of the Barmer health insurance (BEK) from 2008‐2010. [German]. Schmerz 2011;25:402‐10. [DOI] [PubMed] [Google Scholar]
Mease 2011
- Mease PJ, Clauw DJ, Christensen R, Crofford LJ, Gendreau RM, Martin SA, et al. OMERACT Fibromyalgia Working Group. Toward development of a fibromyalgia responder index and disease activity score: OMERACTmodule update. Journal of Rheumatology 2011;38:1487‐95. [DOI] [PMC free article] [PubMed] [Google Scholar]
Moore 2008
- Moore RA, Barden J, Derry S, McQuay HJ. Systematic Reviews in Pain Research: Methodology Refined. Seattle: IASP Press, 2008. [Google Scholar]
Moore 2010
- Moore RA, Eccleston C, Derry S, Wiffen P, Bell RF, Straube S, et al. ACTINPAIN Writing Group of the IASP Special Interest Group on Systematic Reviews in Pain Relief, Cochrane Pain, Palliative and Supportive Care Systematic Review Group Editors. "Evidence" in chronic pain ‐ establishing best practice in the reporting of systematic reviews. Pain 2010;150(3):386‐9. [DOI] [PubMed] [Google Scholar]
Moore 2012
- Moore RA, Derry S, Aldington D, Cole P, Wiffen PJ. Amitriptyline for neuropathic pain and fibromyalgia in adults. Cochrane Database of Systematic Reviews 2012, Issue 12. [DOI: 10.1002/14651858.CD008242] [DOI] [PubMed] [Google Scholar]
Mork 2010
- Mork PJ, Vasseljen O, Nilsen TI. Association between physical exercise, body mass index, and risk of fibromyalgia: longitudinal data from the Norwegian Nord‐Trøndelag Health Study. Arthritis Care and Research 2010;62:611‐7. [DOI] [PubMed] [Google Scholar]
Mork 2012
- Mork PJ, Nilsen T. Sleep problems and risk of fibromyalgia: longitudinal data on an adult female population in Norway. Arthritis and Rheumatism 2012;64:281‐4. [DOI] [PubMed] [Google Scholar]
Nakamura 2014
- Nakamura I, Nishioka K, Usui C, Osada K, Ichibayashi H, Ishida M, et al. An epidemiological internet survey of fibromyalgia and chronic pain in Japan. Arthritis Care and Research 2014;66(7):1093‐101. [DOI] [PubMed] [Google Scholar]
Nishishinya 2006
- Nishishinya MB, Walitt B, Urrútia G, Mease PJ, Rodríguez A, Riera Lizardo RJ, et al. Anti‐depressants and centrally active agents for fibromyalgia syndrome. Cochrane Database of Systematic Reviews 2006, Issue 4. [DOI: 10.1002/14651858.CD006192] [DOI] [Google Scholar]
Nüesch 2013
- Nüesch E, Häuser W, Bernardy K, Barth J, Jüni P. Comparative efficacy of pharmacological and non‐pharmacological interventions in fibromyalgia syndrome: network meta‐analysis. Annals of Rheumatic Diseases 2013;72:955‐62. [DOI] [PubMed] [Google Scholar]
RevMan 2014 [Computer program]
- The Nordic Cochrane Centre, The Cochrane Collaboration. Review Manager (RevMan). Version 5.3. Copenhagen: The Nordic Cochrane Centre, The Cochrane Collaboration, 2014.
Russell 1992
- Russell IJ, Vaeroy H, Javors M, Nyberg F. Cerebrospinalfluid biogenic amine metabolites in fibromyalgia/fibrositissyndrome and rheumatoid arthritis. Arthritis and Rheumatism 1992;35:550‐6. [DOI] [PubMed] [Google Scholar]
Smythe 1981
- Smythe HA. Textbook of Reumathology. 1st Edition. Philadelphia: WB Saunders, 1981. [Google Scholar]
Sommer 2012
- Sommer C, Häuser W, Burgmer M, Engelhardt R, Gerhold K, Petzke F, et al. Arbeitsgemeinschaft der Wissenschaftlichen Medizinischen Fachgesellschaften. [German]. Etiology and pathophysiology of fibromyalgia syndrome. Schmerz 2012;26(3):259‐67. [DOI] [PubMed] [Google Scholar]
Tort 2012
- Tort S, Urrútia G, Nishishinya MB, Walitt B. Monoamine oxidase inhibitors (MAOIs) for fibromyalgia syndrome. Cochrane Database of Systematic Reviews 2012, Issue 4. [DOI: 10.1002/14651858.CD009807] [DOI] [PubMed] [Google Scholar]
van Houdenhove 2005
- Houdenhove B, Egle U, Luyten P. The role of life stress in fibromyalgia. Current Rheumatology Reports 2005;7:365‐70. [DOI] [PubMed] [Google Scholar]
Wolfe 1990
- Wolfe F, Smythe HA, Yunus MB, Bennett RM, Bombardier C, Goldenberg DL, et al. The American College of Rheumatology 1990 Criteria, for the Classification of Fibromyalgia. Report of the Multicenter Criteria Committee. Arthritis and Rheumatism 1990;33(12):1863‐4. [DOI] [PubMed] [Google Scholar]
Wolfe 1995
- Wolfe F, Ross K, Anderson J, Russell IJ, Hebert L. The prevalence and characteristics of fibromyalgia in the general population. Arthritis and Rheumatism 1995;38:19‐25. [DOI] [PubMed] [Google Scholar]
Wolfe 2010
- Wolfe F, Clauw DJ, Fitzcharles MA, Goldenberg DL, Katz RS, Mease P, et al. The American College of Rheumatology preliminary diagnostic criteria for fibromyalgia and measurement of symptom severity. Arthritis and Rheumatism 2010;62(5):600‐10. [DOI] [PubMed] [Google Scholar]
Wolfe 2011a
- Wolfe F, Clauw DJ, Fitzcharles MA, Goldenberg DL, Häuser W, Katz RS, et al. Fibromyalgia criteria and severity scales for clinical and epidemiological studies: a modification of the ACR Preliminary Diagnostic Criteria for Fibromyalgia. Journal of Rheumatology 2011;38:1113‐22. [DOI] [PubMed] [Google Scholar]
Wolfe 2011b
- Wolfe F, Häuser W, Hassett AL, Katz RS, Walitt BT. The development of fibromyalgia‐I: examination of rates and predictors in patients with rheumatoid arthritis (RA). Pain 2011;152(2):291‐9. [DOI] [PubMed] [Google Scholar]
Wolfe 2013
- Wolfe F, Brähler E, Hinz A, Häuser W. Fibromyalgia prevalence, somatic symptom reporting, and the dimensionality of polysymptomatic distress: results from a survey of the general population. Arthritis Care and Research 2013;65:777‐85. [DOI] [PubMed] [Google Scholar]
Wolfe 2014
- Wolfe F. Fibromyalgia research criteria. Journal of Rheumatology 2014;41:187. [DOI] [PubMed] [Google Scholar]
Yunus 1981
- Yunus M, Masi AT, Calabro JJ, Miller KA, Feigenbaum SL. Primary fibromyalgia (fibrositis): clinical study of 50 patients with matched normal controls. Seminars in Arthritis and Rheumatism 1981;11(1):151‐71. [DOI] [PubMed] [Google Scholar]
Yunus 1982
- Yunus M, Masi AT, Calabro JJ, Shah IK. Primary fibromyalgia. American Family Physician 1982;25(5):115‐21. [PubMed] [Google Scholar]
Yunus 1984
- Yunus MB. Primary fibromyalgia syndrome: current concepts. Comprehensive Therapy 1984;10(8):21‐8. [PubMed] [Google Scholar]
Üceyler 2013a
- Üçeyler N, Zeller D, Kahn AK, Kewenig S, Kittel‐Schneider S, Schmid A, et al. Small fibre pathology in patients with fibromyalgia syndrome. Brain 2013;136:1857‐67. [DOI] [PubMed] [Google Scholar]
Üceyler 2013b
- Üçeyler N, Sommer C, Walitt B, Häuser W. Anticonvulsants for fibromyalgia. Cochrane Database of Systematic Reviews 2013, Issue 10. [DOI: 10.1002/14651858.CD010782] [DOI] [PubMed] [Google Scholar]