Abstract
Advances in computed tomography (CT) imaging are opening new avenues toward more precise characterization and quantification of connective tissue microarchitecture. In the last two decades, micro-computed tomography (microCT) has significantly augmented destructive methods for the 3D micro-analysis of tissue structure, primarily in the bone research field. Recently, microCT has been employed in combination with contrast agents to generate contrast-enhanced images of soft tissues that are otherwise difficult to visualize due to their native radiodensity. More recent advances in CT technology have enabled ultra-high resolution imaging by utilizing a more powerful nano-focused X-ray source, such as that found in nano-computed tomography (nanoCT) systems. NanoCT imaging has facilitated the expansion of musculoskeletal research by reducing acquisition time and significantly expanding the range of samples that can be imaged in terms of size, age and tissue-type (bone, muscle, tendon, cartilage, vessels and adipose tissue). We present the application and early results of nanoCT imaging in various tissue types and how this ultra-high resolution imaging modality is capable of characterizing microstructures at levels of details previously not possible. Contrast-enhanced imaging techniques to enable soft-tissue visualization and characterization are also outlined.
Keywords: Bone, cellular imaging, connective tissue imaging, contrast enhanced-CT, microCT, nano-computed tomography, vascular imaging
Introduction
The quantitative three-dimensional (3D) characterization of the compositional and morphological properties of mineralized tissues was revolutionized with the introduction of micro-computed tomography (microCT) imaging and image-analysis (1–4). Following commercialization of microCT systems in the mid-1990s, the characterization of bone by microCT expanded greatly, augmenting conventional histological processing, which is destructive and cost- and time-intensive (5–14). MicroCT imaging has since reached numerous areas of medicine to facilitate non-destructive, rapid, 3D quantification of morphology and density, both of which are important parameters related to tissue and organ-level homeostasis and for systematically assessing the response to genetic and/or environmental perturbations (15–21). However, due to the low X-ray attenuating properties of soft tissues, quantitative tomography-based imaging has generally been limited to high-density, mineralized tissues. As the majority of connective tissues possess radiodensities at or near that of water, the use of conventional X-ray tomography-based imaging of these tissues has been highly limited. Contrast-enhanced imaging using a large variety of chemical agents is able to address this limitation by increasing the attenuation of specific components of the extracellular matrix (ECM) or cellular structures, thereby widening the range of tissues available for quantification. While some contrast agents simply allow for morphological characterization by raising the equivalent radiodensity of a tissue via simple diffusion or perfusion (22-24), other agents are able to provide information about a specific ECM component by exploiting electrostatic interactions between the agent and ECM macromolecule (25,26).
However, many important tissue structures are at or below the resolving capabilities of microCT, namely microvasculature, microstructural components of bone and individual cells. Thus, conventional microCT was also limited in its use to cover the entire hierarchical assembly and organization of connective tissues. Lastly, conventional microCT systems had specimen size constraints that made it very difficult, in some cases impossible, to image both small-animal specimens and large-scale human specimens. This limitation prohibited the execution of translational studies between neonatal and mature tissues or between small-animal and human specimens.
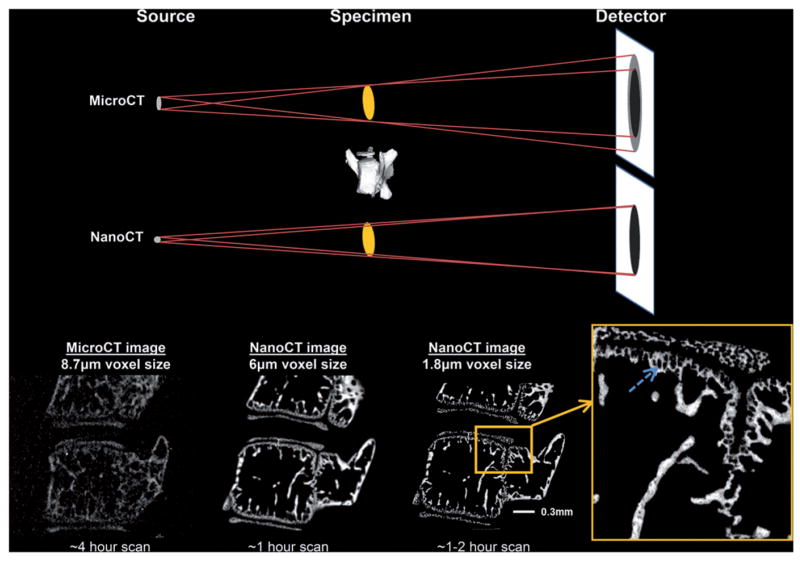
The introduction of nano-computed tomography (nanoCT) systems during the past decade has enabled researchers to expand upon the foundation established by the earlier microCT systems. Due to drastically increased power and a nano-focused beam, nanoCT systems are capable of higher resolution, increased signal-to-noise ratio (SNR) and reduced imaging time (27). Importantly, the nano-focused X-ray beam significantly improved the image quality for samples scanned in the 5-15 micron voxel size range, which is the range most often used by conventional microCT systems. As shown in Figure 1, decreasing the focal spot size of the X-ray beam reduces peripheral shadowing resulting in a significant improvement in resolution over microCT systems, even for structures reconstructed at comparable voxel sizes. This shift in technology from microCT to nanoCT not only improved upon conventional imaging, but opened the door to imaging small structures, even down to the cellular scale, with markedly improved contrast, as well as imaging large scale structures, such as a human proximal femur. In addition, the nanoCT opens a new avenue for the quantitative analyses of very small structures and cells, such as lacunae voids and osteocytes in cortical bone of both large (human) and small (mouse) samples that are difficult to accomplish with microCT. This article outlines the applications available for imaging a wide range of connective tissues using the nanoCT system.
Figure 1.
Image resolution is primarily determined by the focal spot size of the X-ray source. A smaller focal spot size enhances the image resolution (i.e. sharpness and clarity) by decreasing blurriness or “penumbra effect”. The small focal spot size of the nanoCT (1 micron) clearly shows the advantage with regard to clear edges and almost complete absence of noise compared to the microCT image. In addition, there is greater detail detectability, allowing for the characterization and quantification of less mineralized tissue, for example, around hypertrophic chondrocytes in murine lumbar spine as shown by the arrow in the inset.
Methods
Detailed contrast enhancement methods are discussed within their corresponding sections. All specimens were scanned using the nanotom-s nanoCT system (phoenix x-ray, GE Measurement & Control; Wunstorf, Germany). Imaging parameters were optimized for each specimen to maximize spatial resolution and image contrast. Reconstruction of raw data was performed using Datos.rec (phoenix x-ray, GE Measurement & Control; Wunstorf, Germany). Three-dimensional visualization of the reconstructed images was performed using VGStudio MAX 2.1 (Volume Graphics GmbH, Heidelberg, Germany). The computer used for nanoCT reconstruction is an HP Z820 workstation with two eight-core Intel Xeon E5-2650 v2 at 2.6 GHz processors, 192 GB of memory, a 2 TB hard disk and running Microsoft Windows 7 Ultimate 64 bit operating system. In addition, a Cubix Elite Xpander (Cubix Corporation, Carson City, NV) graphics processing unit is attached, which greatly speeds up the reconstruction program. The computers used for analyses are HP Z800 workstations with dual quad-core Intel Xeon X5672 at 3.19 GHz processors, 128 GB of memory, a 2 TB hard disk, two graphics cards (NVIDIA Quadro 5000 and Telsa CS075 (NVIDIA, Santa Clara, CA)) with a WALCOM graphics monitor, and running Microsoft Windows 7 Professional 64 bit operating system. The following illustrations can be accomplished with other nanoCT systems and are not unique to one scanner.
Results and discussion
Large sample imaging
MicroCT systems allow researchers to investigate human bone at a microstructural scale compared to conventional computed tomography (CT) systems. Visualizing individual trabeculae using microCT required users to machine cubes of bone from selected regions within metaphyses. Imaging whole human metaphyseal regions was not possible due to the physical space inside the machine (10). One of the original microCT systems, custom-built at the University of Michigan Orthopaedic Research Labs in the mid-1980s, was capable of scanning an 8 mm cube of human trabecular bone at 50 micron voxel size (10). Unfortunately, in order to get a higher resolution scan, the size of the sample had to be decreased.
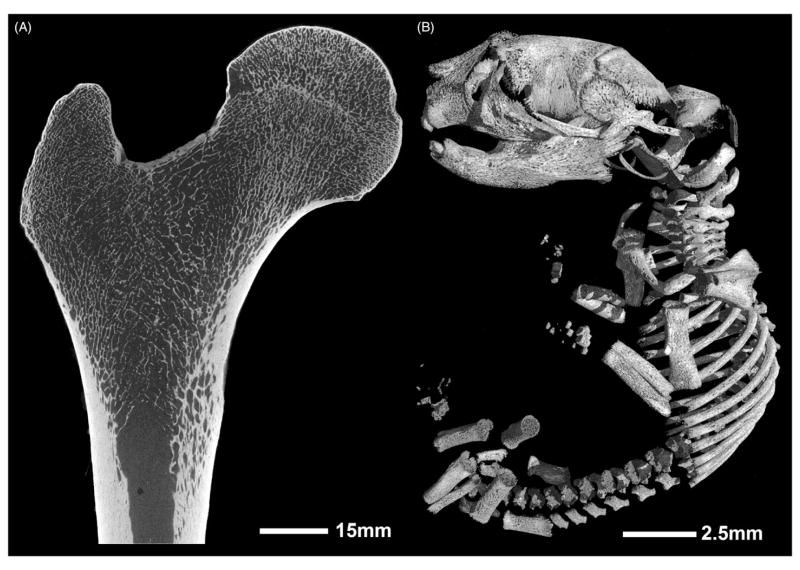
By the early 2000s, van Rietbergen et al. (28) achieved successful microCT imaging of a human proximal femur at 80 micron voxel size, which was a huge advancement in the field for understanding how load is transferred among trabeculae during the single stance phase of walking. However, a single scan took approximately 3 days. Today, advancements in detector technology and sample mounting systems have enabled the imaging of larger samples at much higher resolutions with decreased scanning times in nanoCT compared to microCT systems. The detector is mounted on a rail system in order to allow movement to different horizontal positions, thereby increasing the overall field of view (FOV). Using this feature, a standard 12 cm × 12 cm detector can move to multiple positions to create a virtual 12 cm × 36 cm detector (27). Utilizing this feature, we have been able to image cross-sections of human diaphyseal bone at 5 microns and clearly visualize and quantify the intra-cortical porosity (Figure 2). In addition to the virtual detector, another feature that increases the FOV for scanning is the ability to stitch images in the vertical direction (“multi-scan” mode). The sample can be moved vertically while the machine runs multiple scans along the height of the specimen. During reconstruction, a stitching algorithm seamlessly reconstructs multiple scans into a single 3D reconstruction, without the need for external sample reference points. By combining the virtual detector and multi-scan features, we can scan an entire human proximal femur at a 27 micron voxel size in 9h (Figure 3A). Cubes of bone can now be virtually extracted without sectioning the bone, thereby allowing the bone to be used for other tests, such as mechanical loading. Lastly, the nanoCT has a powerful tube with a maximum voltage of 180kV and output power of 15W. This allows researchers to image different samples, from a very fine butterfly to a 20 million-year-old fossilized hominoid proximal femur (29), with the ability to appreciate the internal trabecular arcades (Figures 4 and 5).
Figure 2.
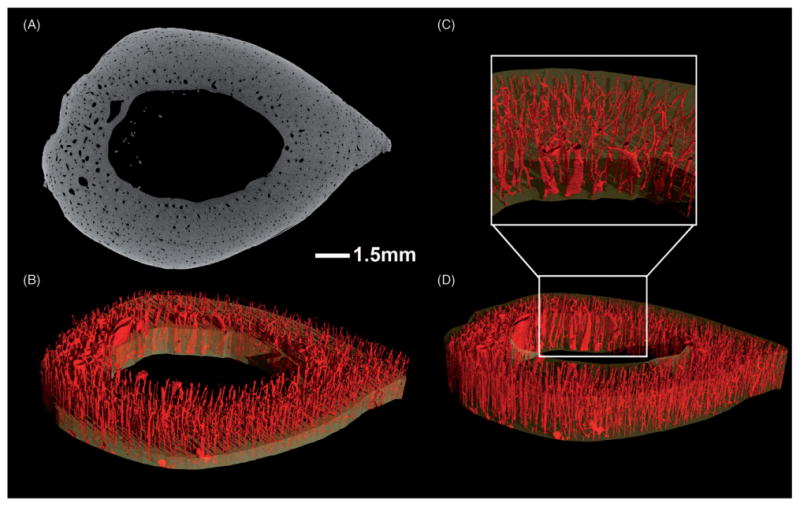
Section of a human radius scanned at 5 μm voxel size, showing intra-cortical porosity of 2.59%. Scanning parameters of 120kV, 140μA, 1000 ms exposure time, and a scan length of 179 min. (A) 2D transverse section illustrating contrast between bone and microstructures. (B) 3D inverse image with clipping plane. (D) 3D isosurface rendering of the section with (C) inset to accentuate the microstructure.
Figure 3.
The nanoCT allows a large variety of specimens of different sizes to be scanned. (A) Human proximal femur of 24-year-old female scanned at 27μm voxel size, 110kV, 200 μA, 1000 ms exposure time, 2 panels with a 0.07 mm brass filter and a scan length of approximately 9 h. (B) 1-day-old mouse scanned at 8.5 μm voxel size, 90 kV, 390 μA, 750 ms exposure time, single panel with a 0.1 mm aluminum filter, and a scan length of 50min.
Figure 4.
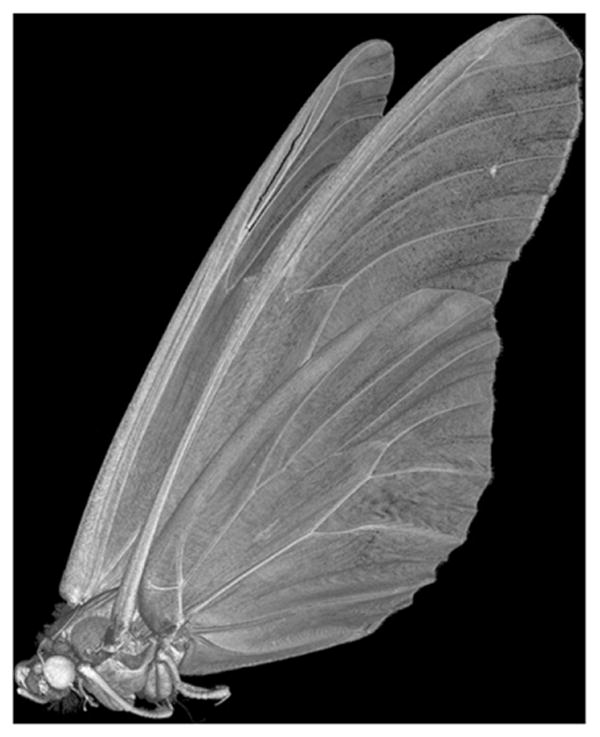
A butterfly scanned at 15 μm voxel size, 70 kV, 570 μA, 1000 ms exposure time and a scan length of approximately 9h.
Figure 5.
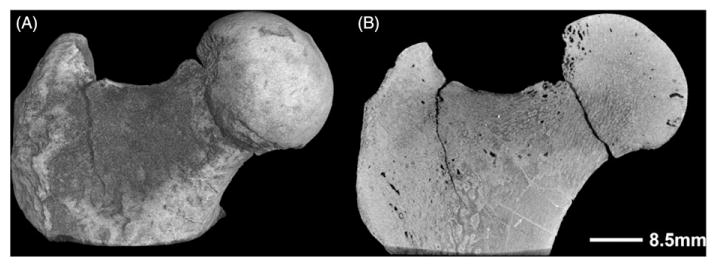
Fossilized femur from Morotpithecus bishopi, the oldest well-dated recognized hominoid, dated at >20.6 million years. Scanned at 20μm voxel size, 180kV, 145 μA, 1500 ms exposure time and 262 min scan time. (A) 3D reconstruction. (B) Sagittal slice through the fossil showing trabecular structures.
Small sample imaging
Phenotype characterization via CT has become commonplace in bone research (30) and more recently has become useful in connective tissue research (31–33). In bone, these data have helped quantify morphology as well as calibrated density measurements of both cortical and trabecular bone volumes. Many studies have shown success in the quantification of intra-cortical porosity in humans (34,35) and some success in animal models, such as rats (36–39), but as of yet few studies have used microCT to successfully quantify the small intra-cortical porosity in mice (40). The microstructure of mouse bone (i.e. porosity and lacunae voids) has been a challenge to quantify because of the limitation in resolution and contrast capabilities of microCT. Therefore, many scientists have continued the painstaking work of histology or have opted for a less time consuming and more precise alternative, such as synchrotron imaging technology (41,42). Synchrotron imaging quality is exceptional; however, sample size and availability are limited.
The development of nanoCT has the potential to alleviate some of these issues. NanoCT can resolve intra-cortical porosity, both small and large in mouse femora because of better resolution and a more powerful X-ray source. For example, a 4 mm section of the diaphysis of a single mouse femur can be scanned quickly and easily at 1.55 micron voxel size. Additionally, a thin-walled tube made of acrylic makes it possible to image femora (as well as other long bones and vertebrae) while in isotonic or fixative solutions to ensure that the specimen can be used for subsequent analysis and testing (Figure 6A). The high resolution scanning protocol employed to scan a single mouse femur can be used in conjunction with the multi-scan, multiple detector position and software stitching capabilities of the nanoCT. This unique combination of hardware and software enables the examination of an entire mouse femur at a voxel size sufficient to quantify large and small vascular channels. If specimens do not need to be preserved for subsequent analysis, they can be dried and scanned with nanoCT to resolve even more detailed micro-structure (i.e. lacunae voids and calcified cartilage) as shown in the cross-sectional image in Figure 6(B). The dry bone scanned in air provides for better contrast between bone and background and therefore greater detail-detectability.
Figure 6.
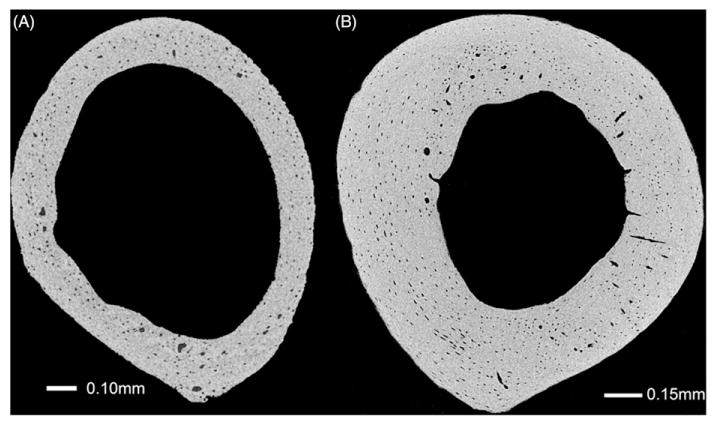
2D transverse slice of the mid-diaphysis of A/J mouse femora. (A) Four-week-old femur scanned while submerged in water at 1.55 μm voxel size, 70 kV, 375 μA, 2000 ms exposure time, and 135 min scan time. (B) Sixteen-week-old femur scanned dry at 1.18 μm voxel size, 70 kV, 375μA, 2000 ms exposure time, and 202 min scan time. Dry specimen shows slightly increased contrast.
Contrast-enhanced imaging of vasculature via perfusion
The resolution capabilities and addition of contrast agents open the utility of nanoCT to endless research programs and diverse research questions. For example, perfusion of the vascular system with radiopaque material for radiographic analysis was frequently done in the 1950s and 1960s in canine and murine models to characterize the vascularity of bone and to assess angiogenic activity within fracture calluses (43–49). These studies often used finely-divided barium sulfate (<1 μm) suspended in formalin as the perfusate. Inserting a catheter into the left ventricle of the heart, the blood was first drained from the chosen animal via the right atrium of the heart using saline, and then replaced with the radiopaque suspension (50). The perfusate should be administered at the same physiological rate as the animal's blood circulation using a suspension that matches the viscosity and osmolality of blood (47). After successful perfusion, large portions of bone could be longitudinally or transversely sectioned and imaged with high-energy plain film X-rays, creating an angiogram (46,49). With the addition of perfusion, microCT is able to visualize large blood vessels outside of the bone in 3D, but has yet been able to visualize small blood vessels inside the cortical bone without decalcification. In combination, nanoCT and perfusion have opened the door to high resolution 3D imaging of intra-cortical vascularity (Figure 7C–D). We can use the same perfusion methodology to three-dimensionally visualize whole-body and connective tissue vasculature with nanoCT (Figures 7A–B and 8). Moreover, by adding India ink to the perfusate we can histologically validate that all vessels were successfully perfused.
Figure 7.
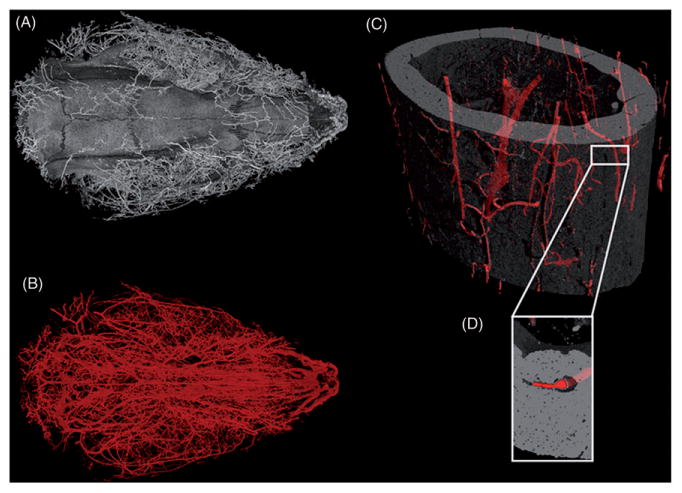
3D images of barium sulfate perfused rodents. (A) Isosurface rendering of a six-month-old Sprague-Dawley rat cranium including blood vessels highlighted by barium sulfate. (B) Blood vessels of head of same rat, visible because of the dense perfusion fluid (barium sulfate) used. This image illustrates the vast vascularization of the internal and external compartments of the head. The rat head was scanned at 16 μm voxel size, 90 kV, 515 μA, 500 ms exposure time, with a scan time of 100 min. (C) Mid-diaphysis of a C57BL/6J mouse femur with barium sulfate-filled blood vessels highlighted. Scanned at 1.5 μm voxel size, 70 kV, 375 μA, 2000 ms exposure time, and 97 min scan time. (D) Inset of a small portion of the mid-diaphysis to illustrate the successfully perfused intra-cortical blood vessel.
Figure 8.
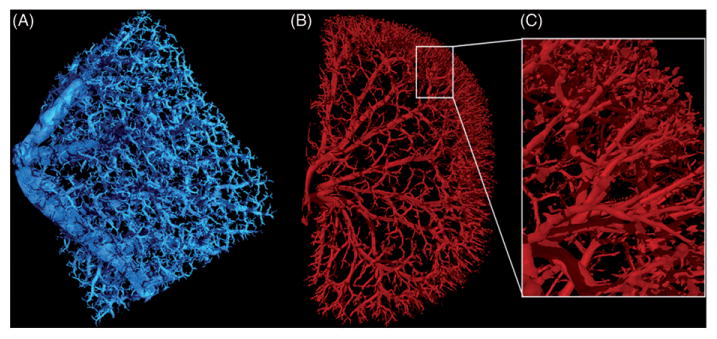
3D images of barium sulfate perfused rodent organs. (A) Portion of a mouse lung scanned at 3.8μ m voxel size, 115kV, 140μA, 750 ms exposure time, and 64 min scan time. (B) Six-month-old Sprague-Dawley rat kidney scanned at 9.2μm voxel size, 90kV, 430μA, 1250ms exposure time, and 61 min scan time. (C) Close up image of the highly branched arterioles of the kidney.
Contrast-enhanced imaging of muscle and tendon
Phosphomolybdic acid (PMA) is one of many histological stains that have been commonly used in the last several decades. PMA contains molybdenum, a high atomic number (42) transition metal, which confers high attenuation in CT when attached to biological soft tissues. According to Everett and Miller (51), PMA enables contrast enhancement of soft tissues via binding of anionic groups of the polyacid to tissue cationic centers. PMA interacts with collagen, a protein that is ubiquitously incorporated into connective tissues, by binding to the basic groups found in this structural protein (52).
To date, contrast enhanced microCT imaging of muscle has been limited to a few contrast agents, namely those containing inorganic iodine. Iodine potassium iodide (I2KI) has been described as a contrast-enhancing agent to visualize skeletal muscle (53–55), myocardial tissue (54,56), rodent masticatory musculature (57–59), alligator jaw muscles (60), pectinate muscles of the heart (61), avian muscle anatomy (62,63), and muscular morphology of insects, fish and other invertebrates (22,23). Another contrast agent that has been recently applied to connective tissue imaging is phosphotungstic acid (PTA). Metscher (22) demonstrated effective muscle fiber staining in small embryonic vertebrates and invertebrates with PTA. However, PTA is a large molecule and requires extended staining times for appropriate diffusion. For example, a 12-hour immersion is needed to stain specimens 2–3 mm thick, thus limiting its use to specimens less than 1–2 cm3 (22). Alongside PTA and I2KI, PMA has been briefly explored as a possible microCT contrast agent. Pauwels et al. (64) evaluated several metal-containing compounds that demonstrated marked contrast enhancement. Of these, PMA and a few others gave the best relative contrast among connective tissues, muscle and adipose tissue. They also measured contrast agent penetration depth by determining the distance the contrast agent had diffused into the tissue using a software-based tool, and tested whether the contrast agent remained bound in the tissue after re-immersion in water for four days. In PMA samples, structures within the muscle tissue were visually discernible and PMA enabled visualization of individual muscle fascicles. PMA also allowed for clear visualization of the patellar tendon. Lastly, PMA remained fixed in the tissue for several days, affording the advantage of being able to image samples that must remain immersed in liquid for extended periods of time (64). Other studies involving contrast-enhanced imaging using PMA are limited, and Golding presents the only other work involving the use of PMA, but only for small invertebrate samples (65,66).
We sought to employ PMA-based contrast enhancement to discern muscle, tendon and bone. Generally speaking, contrast enhancing techniques should enable the segmentation of several tissues simultaneously by separating their relative density spectra. We determined the optimal concentration and incubation time of PMA to visualize musculo-tendinous constructs, delineating between the muscle and the tendon in the mouse knee joint and rotator cuff. The ultimate application of this imaging technique can enable quantitative determination of morphological changes of multiple tissues simultaneously due to pathology, injury or healing.
After sacrifice, the construct consisting of the humerus, scapula, the four attached rotator cuff musculo-tendinous units and coracoacromial (CA) arch was harvested from mouse limbs. Specimens were fixed in 10% neutral-buffered formalin (NBF) for 24 h and then stored in 70% ethanol until staining. Specimens were immersed in an aqueous solution of 1% w/v PMA (Sigma-Aldrich Inc., St Louis, MO) for four days. The four-day immersion is sufficient in staining the entire sample with little to no artifacts, from what we can presently see. Each specimen was removed from the staining solution, rinsed with distilled water, and imaged by nanoCT. Our results show that PMA staining allows clear delineation of the supraspinatus tendon and muscle and their attachment sites (Figure 9); thus, we can easily extract the muscle or tendon of interest for quantitative analysis. In this example, we have contoured a region of interest around the supraspinatus muscle and tendon, and measured their volumes to be 37.91 and 0.1891 mm3, respectively.
Figure 9.
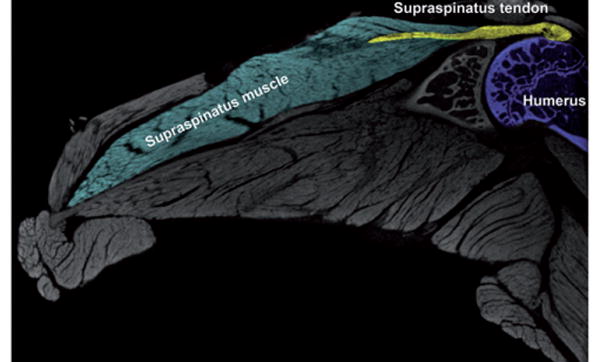
2D slice of a 16-week-old C57 BL/6J mouse shoulder enhanced with phosphomolybdic acid (PMA). Scanning parameters of 6.0 μm voxel size, 70kV, 360μA, 1250ms exposure time, and 61 min scan time.
In addition, PMA can be used for small (e.g. mouse heart, kidney) and large samples (e.g. entire mouse limbs with all muscles intact), with diffusion time dependent on sample size. A limitation of contrast-enhancement is the need to wait for diffusion to reach equilibrium. If not, diffusion artifacts may be present in the image. This would therefore fall under a time limitation since some samples need up to several days of incubation. The PMA stain remains fixed in the tissue for at least one month, thus imaging can be delayed after incubation, which can be critical when handling large sample numbers that cannot be imaged immediately. In addition, the PMA-stained tissue is less likely to shrink or expand during scanning because the PMA will not diffuse out in the scanning media, ultimately reducing the incidence of motion artifacts.
More recent studies have successfully replicated these methods in the mouse patellar tendon, yielding a clearly defined tibial insertion, which was successfully used to generate a mesh for finite element analysis (FEA) at this complex interface (Figure 10). These results support that the generated detailed 3D reconstructions of muscle and other connective tissue can be adapted for further computational analysis, such as FEA. Furthermore, PMA can be successfully applied to other connective tissues (Figure 11) and when combined with vascular perfusion, imaging of two types of tissues simultaneously is now possible (Figure 12). In addition to allowing clear distinction among different tissue types, PMA allows for the quantitative characterization of muscle morphology, such as fascicle length, muscle volume, cross-sectional area, fiber angle and orientation, attachment sites, as well as spatial relationships between tissue structures.
Figure 10.
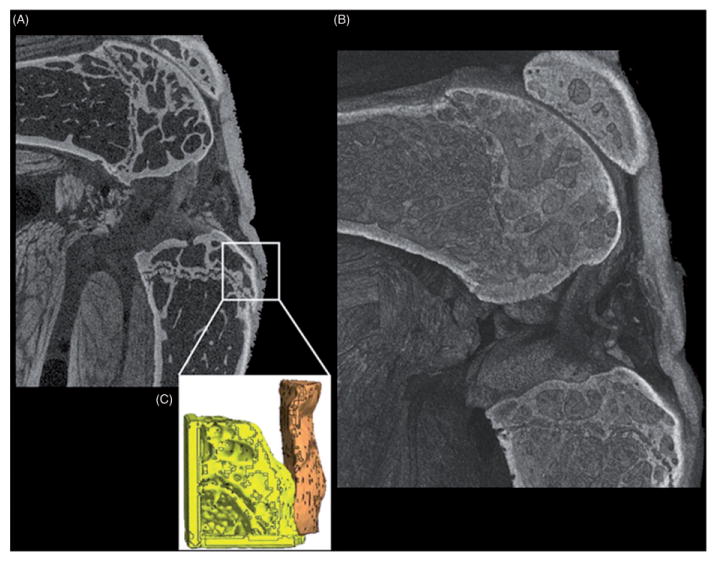
Mouse hindlimb contrast-enhanced with PMA, focusing on the knee joint to show the stained patellar tendon. (A) Virtual slice of the 3D image, clearly showing the patellar tendon and its insertion point on the tibia, that was used to generate (C) a 3D mesh for finite element analysis at this complex interface. Scanning parameters of 5.5 μm voxel size, 80 kV, 290μA, 1250 ms exposure time, and 61 min scan time.
Figure 11.
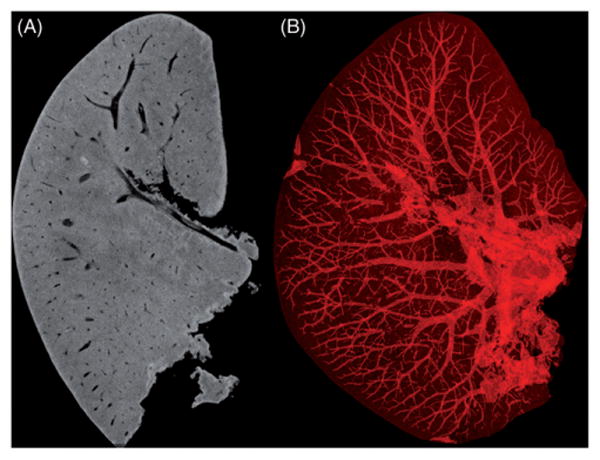
Mouse liver stained with PMA. (A) 2D slice that shows the connective tissue is evenly stained while the vascular network remained unstained. (B) 3D image with an inverse density profile to highlight non-enhanced tissue with clear visualization of the presumed vascular network. Scanning parameters of 8 μm voxel size, 70 kV, 480 μA, 1500 ms exposure time and 73min scan time.
Figure 12.
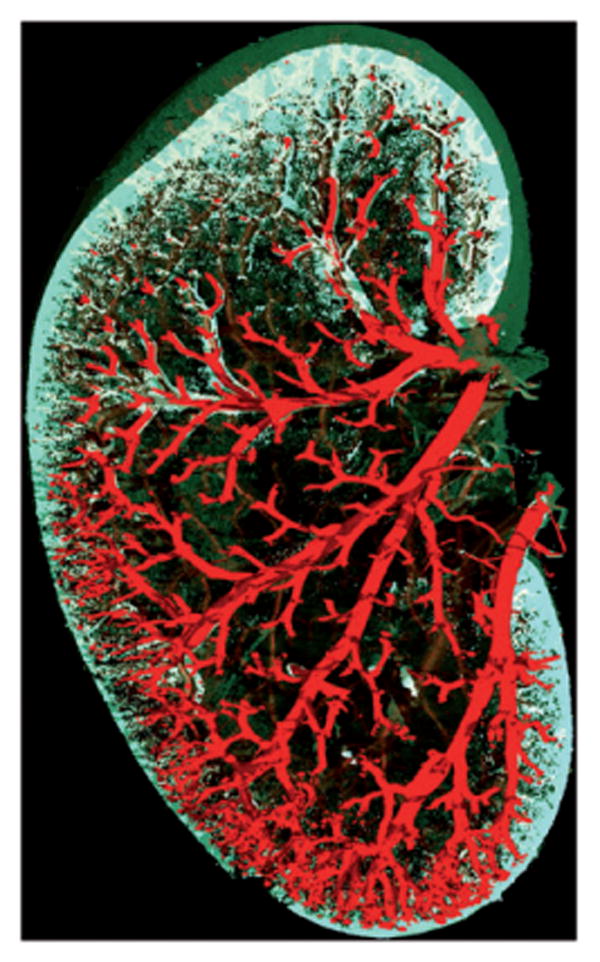
3D rendering of a barium sulfate perfused Sprague-Dawley rat kidney with surrounding connective tissue enhanced with PMA. Scanning parameters of 10μm voxel size, 90 kV, 460 μA, 500 ms exposure time and 25 min scan time.
Further studies validating PMA staining in muscle and tendon are ongoing. These include histological sectioning to confirm staining of the specific connective tissues, and cross-validation of quantitative volume measurements using a micro-volumeter. Now that high fidelity imaging is available, another challenge going forward is to remove these joints in a way that minimizes distortions in the morphology of the relevant tissues within a joint.
Contrast-enhanced imaging of individual adipocytes
Osmium tetroxide (OsO4) has been used as a fixative to prepare samples for electron microscopy since the mid-1900s (67). OsO4 reacts with olefinic sites of unsaturated fats in biological specimens to form stable osmium-containing esters (68,69). Osmium is highly radiodense and clusters of OsO4-stained lipids, such as those within the adipocyte, are readily imaged with CT. This was recently applied to the study of bone marrow adipose tissue using microCT to analyze skeletal fat content in 3D (70,71). However, the resolution of microCT is insufficient to quantitatively analyze single cells.
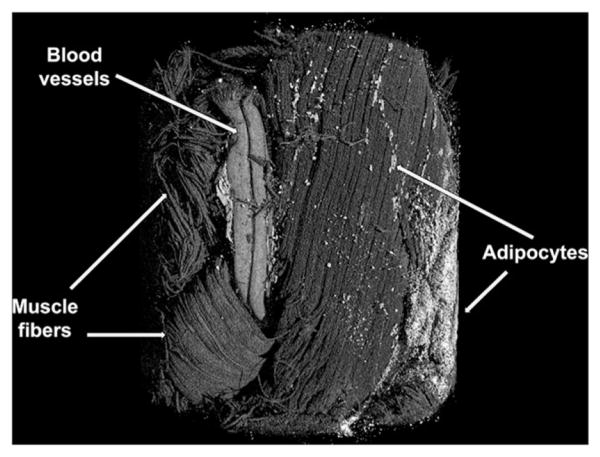
NanoCT-based analyses of OsO4-stained bone or tissue fragments allow imaging of single adipocytes with minimal tissue disruption in a non-destructive manner. Quantification of adipocyte size at the cellular level provides a measure of glycerolipid breakdown, fatty acid release and thus metabolic activity in response to genetic, nutritional or other experimental manipulations. Documented differences in cell size and lipid content can then be used to inform metabolic analyses of the whole adipose tissue. NanoCT is especially useful for analysis of small, complex samples with limited numbers of adipocytes, such as mouse bones (Figure 13). However, the same principle can also be applied to whole adipose tissue and has been used successfully in samples from mice and rats. To confirm the potential utility of nanoCT for 2D adipocyte size quantification, we compared the adipocyte size distribution of adjacent pieces of rat inguinal subcutaneous adipose tissue using conventional histology (72) and OsO4/nanoCT (Figure 14). The exact protocols for adipocyte size quantification are still in development, but we have found that using the nanoCT to generate images for 2D analysis closely mimics our results with conventional paraffin-embedded histology (72) (E.L.S. unpublished). This “digital histology” approach uses image analysis software to determine the area of the adipocytes based on the size of their radiodense, OsO4-stained lipid droplet. Unlike serial sectioning of paraffin blocks, the nanoCT can generate thousands of 2 micron thick slices in a short time period that requires minimal input from the operator. These images can be easily related back to landmark structures, such as the proximal growth plate in mouse tibia, to standardize the region of analysis. Analysis time for one sample ranges from as little as 10 min to up to 30 min, depending on the number of adipocytes and how closely packed they are. In addition, the nanoCT can successfully image stained adipocytes of a large size range (e.g. 200 to 20 000 μm2). The dense accumulation of osmium in the unilocular adipocytes makes them easy to distinguish from the decalcified bone, marrow or tissue matrix. Decalcification of the bone prior to OsO4 staining facilitates maximal stain penetration and is necessary for accurate assessment of adipocyte volume with threshold-based microCT (70). To calculate trabecular or cortical bone parameters, the samples can be scanned by CT prior to decalcification and OsO4 staining. The two scans (one non-decalcified/unstained, one decalcified/OsO4 stained) can be overlaid as needed to compare the bone and adipocyte regions. We have thus far applied the same rationale to nanoCT-based marrow adipose tissue analysis; however, it may be possible to visualize both non-decalcified bone and OsO4 stained adipocytes simultaneously with modification of the staining and scanning protocols.
Figure 13.
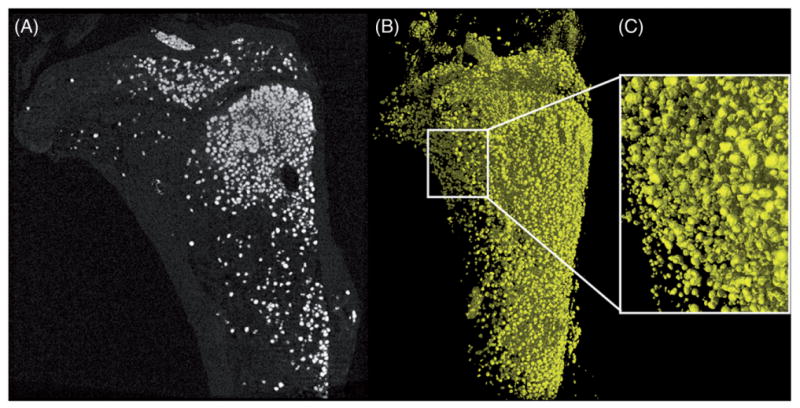
Mouse tibial bone marrow adipocytes enhanced by osmium tetroxide, scanned at 2.0 μm voxel size, 90 kV, 90 μA, 1500 ms exposure time and 73 min scan time. (A) 2D slice of bone marrow adipocytes in white. (B) A 3D rendering of stained adipocytes. (C) Enlarged 3D image of osmium tetroxide-filled adipocytes.
Figure 14.
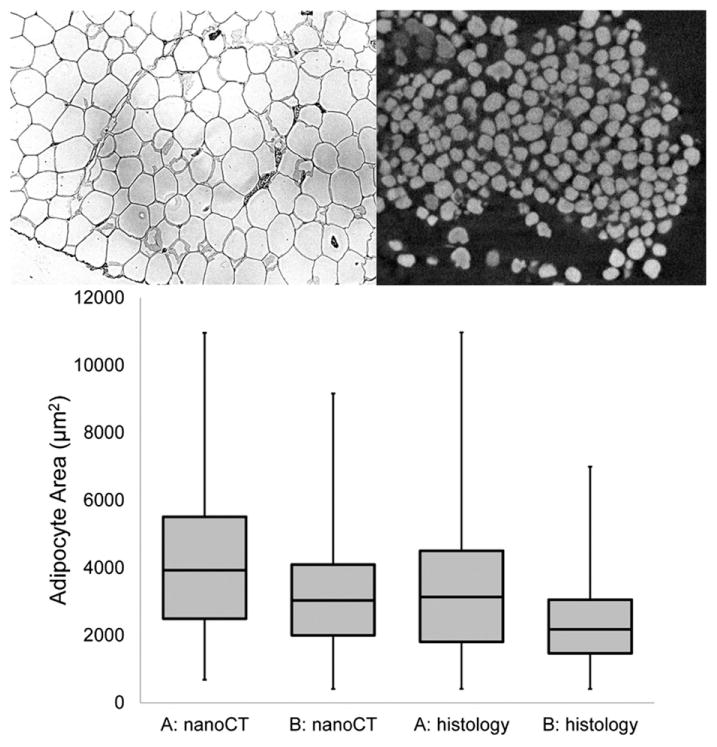
Comparison of adipocyte size distribution using conventional histology (representative 2D section, top left) and contrast-enhanced nanoCT (representative 2D slice, top right). The results from both methods were comparable and demonstrated a shift in the distribution toward smaller adipocytes from the ad lib fed sample (A) to a sample from a rat that had been fasted for 48 h (B). It should be noted that the cell sizes by paraffin-based histology were slightly smaller, likely due to the multiple ethanol processing steps required. Alternatively, the osmium tetroxide may have caused swelling of the cells. However, osmium tetroxide staining at neutral, buffered pH should minimize any tissue distortion.
There is precedence for the use of OsO4-stained adipocytes for cell size quantification (73–75). The OsO4 reaction is highly dependent on the pH of the osmium staining solution (67). At a pH above 8.0 or below 5.0, swelling and vacuolation of the lipid droplets readily occurs (67). The best results are obtained in a buffered staining solution of pH 7.3–7.5 (67). To minimize changes in cell size while allowing for extended storage prior to analysis, we fix isolated adipose tissue or bone in 10% NBF for 72 h. The tissue can then be stored in Sorensen's phosphate buffer (pH 7.4) for at least several weeks prior to OsO4 (Polysciences Inc., Warrington, PA) staining (1% solution, pH 7.4, 48 h). After staining, the sample is stable for at least 30 days in Sorensen's phosphate buffer. The nanoCT scan time for one OsO4-stained adipose tissue sample is 73 min. To increase throughput, multiple adipose tissue samples can be stacked and imaged in one scan. Also, since the samples are stable in the buffer, they can be stacked and a multi-scan can be set up overnight, which can image at least six samples.
In the future, we intend to develop appropriate protocols for accurate 3D image analysis to obtain the volumes of the individual adipocyt lipid droplets, instead of just the cross-sectional area. OsO4-staining, combined with nanoCT, could also be used to measure lipid accumulation in non-adipose tissues, such as liver and muscle. In addition, OsO4 can differentially stain multiple tissues, such as muscle and adipose tissue, and with the combined perfusion of vasculature with another radio-opaque contrast agent, we can image three tissue types simultaneously (Figure 15).
Figure 15.
NanoCT imaging of multiple connective tissues simultaneously using Microfil (Flow-Tech, Inc) (via perfusion) and osmium tetroxide (via immersion) for contrast enhancement. Scanning parameters of 3 μm voxel size, 80 kV, 160 μA, 1500 ms exposure time, and 102 min scan time.
Limitations and software challenges
Although significant advances in hard- and software technologies have facilitated the acquisition of large (human proximal femur) and small (young mouse femur) imaging sets, the ability to quantitatively assess the acquired data sets is still underdeveloped. A standard scan of mouse long bones generates an image-volume that is around 10 GB in size. A single specimen scanned in the nanoCT, using both multi-scan and the virtual detector, can generate image-volumes as large as 200 GB in size. Large amounts of data storage space are needed, even for a single study. Computers require multiple, high-end graphic cards as well as large amounts of memory to reconstruct the generated images into 3D volumes. The recommended system memory should be more than twice the size of the largest data set. The optimal size of memory can be calculated based on the size of the volume, the size of one projection and the number of projections. Analyses of such large data can also be problematic. The software capabilities of analyzing a 3D volume or a 2D stack of more than a few hundred slices are limited, and piecewise analysis of images in small sections is sometimes necessary.
With the use of contrast agents to aid in the imaging of multiple tissues simultaneously, specialized software tools are needed. The ability to segment, for example, individual muscle fascicles, muscle from tendon, or adipose tissue from bone and other connective tissue, can be extremely powerful. Similar tools have already been applied for automatic segmentation of cortical and trabecular bone, which can be optimized for other connective tissue (76). In addition, image processing algorithms have been applied to CT data sets in the medical field (77,78), and can most likely be transferred to other disciplines with little difficulty. While automatic segmentation algorithms are very useful, they generally require experienced programmers to tailor project-specific segmentation schemes.
Future directions
Biomechanical imaging, that is, the combination of time-lapsed CT imaging and concurrent mechanical testing, introduced by Muller et al. (79), enables the study of bone failure initiation and microcrack propagation. This image-guided failure assessment can be applied to soft tissues, namely tendons and ligaments, with the combination of contrast agents. Our ongoing work focuses on coating ligament fibers with a metal-containing contrast agent in large animal and human specimens to image the relative displacement of the individual constituents of the ligament structure in 3D while under mechanical load.
In addition, our future work will focus on fabricating nanoparticles containing heavy metals for the directed targeting and imaging of specific cells. Similar cell-labeling techniques have been applied to synchrotron microCT (80) and can thus be applied to nanoCT imaging. Lastly, we plan to optimize contrast enhancement techniques with nanoCT for the quantification of cartilaginous tissue. Our ongoing work employs a microCT technique developed by Palmer et al. that relies on the equilibrium partitioning of an ionic contrast agent (EPIC-microCT). This contrast enhancement technique relies on the preferential exclusion of a negatively charged contrast agent from the highly negatively charged sulfated glycosaminoglycan (sGAG)-rich tissues, such as articular cartilage. Preferential exclusion results in an increase in tissue attenuation inversely proportional to sGAG concentration. It has been successfully applied to the imaging of articular cartilage in mouse and rat femora (81–87), cartilage in murine xiphoid (88), caprine osteochondral defects of the talus (89), and more recently, in rabbit intervertebral discs (90).
Conclusion
The use of nanoCT imaging is opening new avenues toward precise characterization and quantification of tissue microarchitecture. Developments in imaging capabilities have shifted the way the scientific community structures research questions, and further improvements in imaging quality will continue to shift scientific focus. The combination of nanoCT and contrast agents for contrast enhanced-CT imaging could increase the efficiency of science and provide information complementary to standard histology methods with quick acquisition of data and semi- or fully automatic quantification. The combination of nanoCT and contrast enhancement techniques allow for imaging virtually all connective tissues (Figure 16).
Figure 16.
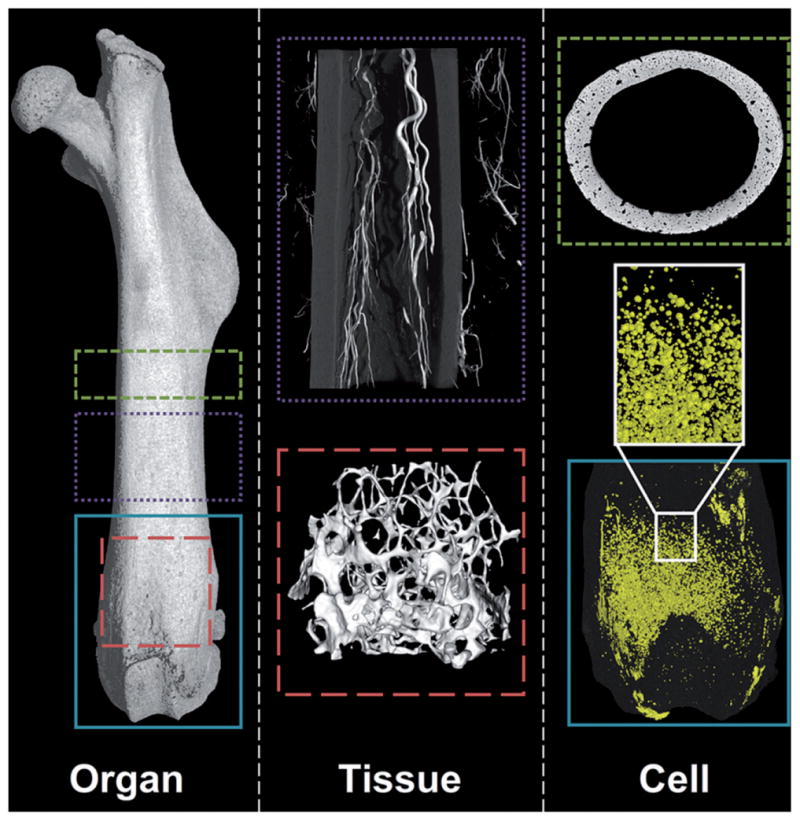
Hierarchical nanoCT imaging enables the measurement of qualitative and quantitative data from organ (femur) to structural (trabeculae), tissue (vascularity) and cellular (lacunae voids and adipocytes) levels at various resolutions, with and without the aid of contrast agents.
Acknowledgments
The authors would like to acknowledge Phillip Nasser (Icahn School of Medicine at Mount Sinai, New York, NY, USA) for his efforts in generating the FEA meshed image of the patellar tendon, and Laura MacLatchy (Department of Anthropology at the University of Michigan, Ann Arbor, MI, USA) for providing the fossilized specimen for imaging.
Research reported in this publication was supported by the National Institutes of Health under award numbers S10RR026336, AR44927, AR065424, R24 DK092759 and K99 DE024178.
Footnotes
Declaration of interest: The authors report no conflicts of interest.
References
- 1.Feldkamp LA, Goldstein SA, Parfitt MA, Jesion G, Kleerekoper M. The direct examination of three-dimensional bone architecture in vitro by computed tomography. J Bone Miner Res. 1989;4:3–11. doi: 10.1002/jbmr.5650040103. [DOI] [PubMed] [Google Scholar]
- 2.Ruegsegger P, Koller B, Muller R. A microtomographic system for the nondestructive evaluation of bone architecture. Calcif Tissue Int. 1996;58:24–9. doi: 10.1007/BF02509542. [DOI] [PubMed] [Google Scholar]
- 3.Flannery BP, Deckman HW, Roberge WG, D'amico KL. Three-dimensional X-ray microtomography. Science. 1987;237:1439–44. doi: 10.1126/science.237.4821.1439. [DOI] [PubMed] [Google Scholar]
- 4.Hildebrand T, Ruegsegger P. A new method for the model-independent assessment of thickness in three-dimensional images. J Microsc. 1997;185:67–75. [Google Scholar]
- 5.Kapadia RD. Applications of micro-CT and MR microscopy to study pre-clinical models of osteoporosis and osteoarthritis. Technol Health Care. 1998;6:361–72. [PubMed] [Google Scholar]
- 6.Bonnet N, Laroche N, Vico L, Dolleans E, Courteix D, Benhamou CL. Assessment of trabecular bone microarchitecture by two different x-ray microcomputed tomographs: a comparative study of the rat distal tibia using Skyscan and Scanco devices. Med Phys. 2004;19:1640–50. doi: 10.1118/1.3096605. [DOI] [PubMed] [Google Scholar]
- 7.Waarsing JH, Day JS, Weinans H. An improved segmentation method for in vivo µCT imaging. J Bone Miner Res. 2004;19:1640–50. doi: 10.1359/JBMR.040705. [DOI] [PubMed] [Google Scholar]
- 8.Alexander JM. Human parathyroid hormone 1-34 reverses bone loss in ovariectomized mice. J Bone Miner Res. 2001;16:1665–73. doi: 10.1359/jbmr.2001.16.9.1665. [DOI] [PubMed] [Google Scholar]
- 9.Barbier A, Martel C, de Vernejoul MC, Tirode F, Nys M, Mocaer G, Morieux C, Murakami H, Lacheretz F. The visualization and evaluation of bone architecture in the rat using three-dimensional X-Ray microcomputed tomography. J Bone Miner Metab. 1999;17:37–44. doi: 10.1007/s007740050061. [DOI] [PubMed] [Google Scholar]
- 10.Kuhn JL, Goldstein SA, Feldkamp LA, Goulet RW, Jesion G. Evaluation of a microcomputed tomography system to study trabecular bone structure. J Orthop Res. 1990;8:833–42. doi: 10.1002/jor.1100080608. [DOI] [PubMed] [Google Scholar]
- 11.Muller R. Morphometric analysis of human bone biopsies: a quantitative structural comparison of histological sections and micro-computed tomography. Bone. 1998;23:59–66. doi: 10.1016/s8756-3282(98)00068-4. [DOI] [PubMed] [Google Scholar]
- 12.Fanuscu MI, Chang TL. Three-dimensional morphometric analysis of human cadaver bone: microstructural data from maxilla and mandible. Clin Oral Implants Res. 2004;15:213–18. doi: 10.1111/j.1600-0501.2004.00969.x. [DOI] [PubMed] [Google Scholar]
- 13.Chappard D, Retailleau-Gaborit N, Legrand E, Basle MF, Audran M. Comparison insight bone measurements by histomorphometry and µCT. J Bone Miner Res. 2005;20:1177–84. doi: 10.1359/JBMR.050205. [DOI] [PubMed] [Google Scholar]
- 14.Akhter MP, Lappe JM, Davies KM, Recker RR. Transmenopausal changes in the trabecular bone structure. Bone. 2007;41:111–16. doi: 10.1016/j.bone.2007.03.019. [DOI] [PubMed] [Google Scholar]
- 15.Turner CH. Genetic regulation of cortical and trabecular bone strength and microstructure in inbred strains of mice. J Bone Miner Res. 2000;15:1126–31. doi: 10.1359/jbmr.2000.15.6.1126. [DOI] [PubMed] [Google Scholar]
- 16.Jepsen KJ, Akkus OJ, Majeska RJ, Nadeau JH. Hierarchical relationship between bone traits and mechanical properties in inbred mice. Mamm Genome. 2003;14:97–104. doi: 10.1007/s00335-002-3045-y. [DOI] [PubMed] [Google Scholar]
- 17.Bouxsein ML, Myers KS, Shultz KL, Donahue LR, Rosen CJ, Beamer WG. Ovariectomy-induced bone loss varies among inbred strains of mice. J Bone Miner Res. 2005;20:1085–92. doi: 10.1359/JBMR.050307. [DOI] [PubMed] [Google Scholar]
- 18.Bonadio J, Jepsen KJ, Mansoura MK, Jaenisch R, Kuhn JL, Goldstein SA. A murine skeletal adaptation that significantly increases cortical bone mechanical properties. Implications for human skeletal fragility. J Clin Invest. 1993;92:1697–705. doi: 10.1172/JCI116756. [DOI] [PMC free article] [PubMed] [Google Scholar]
- 19.Lewis DB, Liggitt HD, Effmann EL, Motley ST, Teitelbaum SL, Jepsen KJ, Goldstein SA, Bonadio J, Carpenter J, Perlmutter RM. Osteoporosis induced in mice by overproduction of interleukin 4. Proc Natl Acad Sci. 1993;90:11618–22. doi: 10.1073/pnas.90.24.11618. [DOI] [PMC free article] [PubMed] [Google Scholar]
- 20.Silva MJ, Brodt MD, Uthgenannt BA. Morphological and mechanical properties of caudal vertebrae in the S AMP6 mouse model of senile osteoporosis. Bone. 2004;35:425–31. doi: 10.1016/j.bone.2004.03.027. [DOI] [PubMed] [Google Scholar]
- 21.Laib A, Kumer JL, Majumdar S, Lane NE. The temporal changes of trabecular architecture in ovariectomized rats assessed by microCT. Osteoporos Int. 2001;12:936–41. doi: 10.1007/s001980170022. [DOI] [PubMed] [Google Scholar]
- 22.Metscher B. MicroCT for comparative morphology: simple staining methods allow high-contrast 3D imaging of diverse non-mineralized animal tissues. BMC Physiol. 2009;9:11. doi: 10.1186/1472-6793-9-11. [DOI] [PMC free article] [PubMed] [Google Scholar]
- 23.Metscher B. MicroCT for developmental biology: a versatile tool for high-contrast 3D imaging at histological resolutions. Dev Dyn. 2009;238:632–40. doi: 10.1002/dvdy.21857. [DOI] [PubMed] [Google Scholar]
- 24.Duvall CL, Taylor WR, Weiss D, Guldberg RE. Quantitative microcomputed tomography analysis of collateral vessel development after ischemic injury. Am J Physiol – Heart Circ Physiol. 2004;287:H302–10. doi: 10.1152/ajpheart.00928.2003. [DOI] [PubMed] [Google Scholar]
- 25.Palmer AW, Guldberg RE, Levenston ME. Analysis of cartilage matrix fixed charge density and three-dimensional morphology via contrast-enhanced microcomputed tomography. Proc Natl Acad Sci USA. 2006;103:19255–60. doi: 10.1073/pnas.0606406103. [DOI] [PMC free article] [PubMed] [Google Scholar]
- 26.Joshi NS, Bansal PN, Stewart RC, Snyder BD, Grinstaff MW. Effect of contrast agent charge on visualization of articular cartilage using computed tomography: exploiting electrostatic interactions for improved sensitivity. J Am Chem Soc. 2009;131:13234–5. doi: 10.1021/ja9053306. [DOI] [PubMed] [Google Scholar]
- 27.Brockdorf K, Brunke O, Neuber D. Nanoct: visualizing of internal 3d-structures with submicrometer resolution. Microsc Microanal. 2007;13:1572–3. [Google Scholar]
- 28.van Rietbergen B, Huiskes R, Eckstein F, Ruegsegger P. Trabecular bone tissue strains in the healthy and osteoporotic human femur. J Bone Miner Res. 2003;18:1781–8. doi: 10.1359/jbmr.2003.18.10.1781. [DOI] [PubMed] [Google Scholar]
- 29.MaClatchy L, Gebo D, Kityo R, Pilbeam D. Postcranial functional morphology of Morotopithecus bishopi, with implications for the evolution of modern ape locomotion. J Human Evol. 2000;39:159–83. doi: 10.1006/jhev.2000.0407. [DOI] [PubMed] [Google Scholar]
- 30.Bouxsein ML, Boyd SK, Christiansen BA, Guldberg RE, Jepsen KJ, Muller R. Guidelines for assessment of bone microstructure in rodents using micro-computed tomography. J Bone Miner Res. 2010;25:1468–86. doi: 10.1002/jbmr.141. [DOI] [PubMed] [Google Scholar]
- 31.Counter WB, Wang IQ, Farncombe TH, Labiris NR. Airway and pulmonary vascular measurements using contrast-enhanced micro-CT in rodents. Am J Physiol Renal Physiol. 2013;304:L831–43. doi: 10.1152/ajplung.00281.2012. [DOI] [PubMed] [Google Scholar]
- 32.Dunmore-Buyze PJ, Tate E, Xiang FL, Detombe SA, Nong Z, Pickering JG, Drangova M. Three-dimensional imaging of the mouse heart and vasculature using micro-CT and whole-body perfusion of iodine or phosphotungstic acid. Contrast Media Mol Imaging. 2014;9:383–90. doi: 10.1002/cmmi.1588. [DOI] [PubMed] [Google Scholar]
- 33.Ehling J, Theek B, Gremse F, Baetke S, Mockel D, Maynard J, Ricketts SA, Grull H, Neeman M, Knuechel R, Lederle W, Kiessling F, Lammers T. Micro-CT imaging of tumor angiogenesis: quantitative measures describing micromorphology and vascularization. Am J Pathol. 2014;184:431–41. doi: 10.1016/j.ajpath.2013.10.014. [DOI] [PMC free article] [PubMed] [Google Scholar]
- 34.Nyman JS, Gorochow LE, Adam Horch R, Uppuganti S, Zein-Sabatto A, Manhard MK, Does MD. Partial removal of pore and loosely bound water by low-energy drying decreases cortical bone toughness in young and old donors. J Mech Behav Biomed. 2013;22:136–45. doi: 10.1016/j.jmbbm.2012.08.013. [DOI] [PMC free article] [PubMed] [Google Scholar]
- 35.Particelli F, Mecozzi L, Beraudi A, Montesi M, Baruffaldi F, Viceconti M. A comparison between micro-CT and histology for the evaluation of cortical bone: effect of polymethylmethacrylate embedding on structural parameters. J Microsc. 2012;245:302–10. doi: 10.1111/j.1365-2818.2011.03573.x. [DOI] [PubMed] [Google Scholar]
- 36.Britz HM, Jokihaara J, Leppanen OV, Jarvinen T, Cooper DM. 3D visualization and quantification of rat cortical bone porosity using a desktop micro-CT system: a case study in the tibia. J Microsc. 2010;240:32–7. doi: 10.1111/j.1365-2818.2010.03381.x. [DOI] [PubMed] [Google Scholar]
- 37.Britz HM, Carter Y, Jokihaara J, Leppanen OV, Jarvinen TL, Belev G, Cooper DM. Prolonged unloading in growing rats reduces cortical osteocyte lacunar density and volume in the distal tibia. Bone. 2012;51:913–19. doi: 10.1016/j.bone.2012.08.112. [DOI] [PubMed] [Google Scholar]
- 38.Jast J, Jasiuk I. Age-related changes in the 3D hierarchical structure of rat tibia cortical bone characterized by high-resolution micro-CT. J Appl Physiol (Bethesda, MD: 1985) 2013;114:923–33. doi: 10.1152/japplphysiol.00948.2011. [DOI] [PubMed] [Google Scholar]
- 39.Palacio-Mancheno PE, Larriera AI, Doty SB, Cardoso L, Fritton SP. 3D assessment of cortical bone porosity and tissue mineral density using high-resolution microCT: effects of resolution and threshold method. J Bone Miner Res. 2014;29:142–50. doi: 10.1002/jbmr.2012. [DOI] [PMC free article] [PubMed] [Google Scholar]
- 40.Miller LM, Little W, Schirmer A, Sheik F, Busa B, Judex S. Accretion of bone quantity and quality in the developing mouse skeleton. J Bone Miner Res. 2007;22:1037–45. doi: 10.1359/jbmr.070402. [DOI] [PubMed] [Google Scholar]
- 41.Mader KS, Schneider P, Muller R, Stampanoni M. A quantitative framework for the 3D characterization of the osteocyte lacunar system. Bone. 2013;57:142–54. doi: 10.1016/j.bone.2013.06.026. [DOI] [PubMed] [Google Scholar]
- 42.Schneider P, Stauber M, Voide R, Stampanoni M, Donahue LR, Muller R. Ultrastructural properties in cortical bone vary greatly in two inbred strains of mice as assessed by synchrotron light based micro- and nano-CT. J Bone Miner Res. 2007;22:1557–70. doi: 10.1359/jbmr.070703. [DOI] [PubMed] [Google Scholar]
- 43.Brookes M. The vascular architecture of tubular bone in the rat. Anat Rec. 1958;132:25–47. doi: 10.1002/ar.1091320103. [DOI] [PubMed] [Google Scholar]
- 44.Brookes M. The vascularization of long bones in the human foetus. J Anat. 1958;92:261–7. [PMC free article] [PubMed] [Google Scholar]
- 45.Brookes M. Cortical vascularization and growth in foetal tubular bones. J Anat. 1963;97:597–609. [PMC free article] [PubMed] [Google Scholar]
- 46.Brookes M, Revell WJ. Blood supply of bone. London: Springer; 1998. [Google Scholar]
- 47.Rhinelander FW, Baragry R. Microangiography in bone healing. I. Undisplaced closed fractures. J Bone Joint Surg Am. 1962;44-a:1273–98. [PubMed] [Google Scholar]
- 48.Rhinelander FW. The normal microcirculation of diaphyseal cortex and its response to fracture. J Bone Joint Surg Am. 1968;50:784–800. doi: 10.2106/00004623-196850040-00016. [DOI] [PubMed] [Google Scholar]
- 49.Rhinelander FW. Circulation in bone. In: Bourne G, editor. The biochemistry and physiology of bone. New York, NY: Academic Press; 1972. pp. 1–77. [Google Scholar]
- 50.Erol OO, Spira M, Levy B. Microangiography: a detailed technique of perfusion. J Surg Res. 1980;29:406–13. doi: 10.1016/0022-4804(80)90053-0. [DOI] [PubMed] [Google Scholar]
- 51.Everett M, Miller W. The role of phosphotungstic and phosphomolybdic acids in connective tissue staining I. Histochemical studies. Histochem J. 1974;6:25–34. doi: 10.1007/BF01011535. [DOI] [PubMed] [Google Scholar]
- 52.Puchtler H, Isler H. The effect of phosphomolybdic acid on the stainability of connective tissues by various dyes. Histochem Cytochem. 1958;6:265–70. doi: 10.1177/6.4.265. [DOI] [PubMed] [Google Scholar]
- 53.Jeffery NS, Stephenson RS, Gallagher JA, Jarvis JC, Cox PG. Micro-computed tomography with iodine staining resolves the arrangement of muscle fibres. J Biomech. 2011;44:189–92. doi: 10.1016/j.jbiomech.2010.08.027. [DOI] [PubMed] [Google Scholar]
- 54.Vickerton P, Jarvis J, Jeffery N. Concentration-dependent specimen shrinkage in iodine-enhanced microCT. J Anatomy. 2013;223:185–93. doi: 10.1111/joa.12068. [DOI] [PMC free article] [PubMed] [Google Scholar]
- 55.Gignac PM, Kley NJ. Iodine-enhanced micro-CT imaging: meth-odological refinements for the study of the soft-tissue anatomy of post-embryonic vertebrates. J Exp Zool B Mol Dev Evol. 2014;322:166–76. doi: 10.1002/jez.b.22561. [DOI] [PubMed] [Google Scholar]
- 56.Stephenson RS, Boyett MR, Hart G, Nikolaidou T, Cai X, Corno AF, Alphonso N, Jeffery N, Jarvis JC. Contrast enhanced micro-computed tomography resolves the 3-dimensional morphology of the cardiac conduction system in mammalian hearts. PLoS One. 2012;7:e35299. doi: 10.1371/journal.pone.0035299. [DOI] [PMC free article] [PubMed] [Google Scholar]
- 57.Cox PG, Jeffery N. Reviewing the morphology of the jaw-closing musculature in squirrels, rats, and guinea pigs with contrast-enhanced MicroCt. Anat Record. 2011;294:915–28. doi: 10.1002/ar.21381. [DOI] [PubMed] [Google Scholar]
- 58.Baverstock H, Jeffery NS, Cobb SN. The morphology of the mouse masticatory musculature. J Anat. 2013;223:46–60. doi: 10.1111/joa.12059. [DOI] [PMC free article] [PubMed] [Google Scholar]
- 59.Hautier L, Lebrun R, Cox PG. Patterns of covariation in the masticatory apparatus of hystricognathous rodents: implications for evolution and diversification. J Morphol. 2012;273:1319–37. doi: 10.1002/jmor.20061. [DOI] [PubMed] [Google Scholar]
- 60.Tsai HP, Holliday CM. Ontogeny of the alligator cartilage transiliens and its significance for sauropsid jaw muscle evolution. PLoS One. 2011;6:e24935. doi: 10.1371/journal.pone.0024935. [DOI] [PMC free article] [PubMed] [Google Scholar]
- 61.Aslanidi OV, Nikolaidou T, Jichao Z, Smaill BH, Gilbert SH, Holden AV, Lowe T, Withers PJ, Stephenson RS, Jarvis JC, Hancox JC, Boyett MR, Henggui Z. Application of micro-computed tomography with iodine staining to cardiac imaging, segmentation, and computational model development. Med Imag IEEE Trans. 2013;32:8–17. doi: 10.1109/TMI.2012.2209183. [DOI] [PMC free article] [PubMed] [Google Scholar]
- 62.During D, Ziegler A, Thompson C, Ziegler A, Faber C, Muller J, Scharff C, Elemans C. The songbird syrinx morphome: a three-dimensional, high-resolution, interactive morphological map of the zebra finch vocal organ. BMC Biol. 2013;11:1. doi: 10.1186/1741-7007-11-1. [DOI] [PMC free article] [PubMed] [Google Scholar]
- 63.Lautenschlager S, Bright JA, Rayfield EJ. Digital dissection – using contrast-enhanced computed tomography scanning to elucidate hard- and soft-tissue anatomy in the Common Buzzard Buteo buteo. J Anat. 2014;224:412–31. doi: 10.1111/joa.12153. [DOI] [PMC free article] [PubMed] [Google Scholar]
- 64.Pauwels E, Van Loo D, Cornillie P, Brabant L, Van Hoorebeke L. An exploratory study of contrast agents for soft tissue visualization by means of high resolution X-ray computed tomography imaging. J Microsc. 2013;250:21–31. doi: 10.1111/jmi.12013. [DOI] [PubMed] [Google Scholar]
- 65.Golding R, Jones A. Micro-CT as a novel technique for 3D reconstruction of molluscan anatomy. Molluscan Res. 2007;27:123–8. [Google Scholar]
- 66.Golding R, Ponder W, Byrne M. Three-dimensional reconstruction of the odontophoral cartilages of Caenogastropoda (Mollusca: Gastropoda) using micro-CT: morphology and phylogenetic significance. J Morphol. 2008;270:558–87. doi: 10.1002/jmor.10699. [DOI] [PubMed] [Google Scholar]
- 67.Palade GE. A study of fixation for electron microscopy. J Exp Med. 1952;95:285–98. doi: 10.1084/jem.95.3.285. [DOI] [PMC free article] [PubMed] [Google Scholar]
- 68.Belazi D, Sole-Domenech S, Johansson B, Schalling M, Sjovall P. Chemical analysis of osmium tetroxide staining in adipose tissue using imaging ToF-SIMS. Histochem Cell Biol. 2009;132:105–15. doi: 10.1007/s00418-009-0587-z. [DOI] [PubMed] [Google Scholar]
- 69.Collin RJ, Griffith WP. Letter: mechanism of tissue component staining by osmium tetroxide. J Histochem Cytochem. 1974;22:992–3. doi: 10.1177/22.10.992. [DOI] [PubMed] [Google Scholar]
- 70.Scheller EL, Troiano N, Vanhoutan JN, Bouxsein MA, Fretz JA, Xi Y, Nelson T, Katz G, Berry R, Church CD, Doucette CR, Rodeheffer MS, Macdougald OA, Rosen CJ, Horowitz MC. Use of osmium tetroxide staining with microcomputerized tomography to visualize and quantify bone marrow adipose tissue in vivo. Methods Enzymol. 2014;537:123–39. doi: 10.1016/B978-0-12-411619-1.00007-0. [DOI] [PMC free article] [PubMed] [Google Scholar]
- 71.Cawthorn WP, Scheller EL, Learman BS, Parlee SD, Simon BR, Mori H, Ning X, Bree AJ, Schell B, Broome DT, Soliman SS, DelProposto JL, Lumeng CN, Mitra A, Pandit SV, Gallagher KA, Miller JD, Krishnan V, Hui SK, Bredella MA, Fazeli PK, Klibanski A, Horowitz MC, Rosen CJ, MacDougald OA. Bone marrow adipose tissue is an endocrine organ that contributes to increased circulating adiponectin during caloric restriction. Cell Metab. 2014;20:368–75. doi: 10.1016/j.cmet.2014.06.003. [DOI] [PMC free article] [PubMed] [Google Scholar]
- 72.Parlee SD, Lentz SI, Mori H, MacDougald OA. Quantifying size and number of adipocytes in adipose tissue. Methods Enzymol. 2014;537:93–122. doi: 10.1016/B978-0-12-411619-1.00006-9. [DOI] [PMC free article] [PubMed] [Google Scholar]
- 73.Etherton TD, Thompson EH, Allen CE. Improved techniques for studies of adipocyte cellularity and metabolism. J Lipid Res. 1977;18:552–7. [PubMed] [Google Scholar]
- 74.Fakler T, O'Brian Smith E, McNeel RL, Mersmann HJ. Evaluation of alternative methods to prepare porcine adipocytes for measurement with an electronic particle number and size determination apparatus. J Anim Sci. 1996;74:2385–93. doi: 10.2527/1996.74102385x. [DOI] [PubMed] [Google Scholar]
- 75.Hirsch J, Gallian E. Methods for the determination of adipose cell size in man and animals. J Lipid Res. 1968;9:110–19. [PubMed] [Google Scholar]
- 76.Buie HR, Campbell GM, Klinck RJ, MacNeil JA, Boyd SK. Automatic segmentation of cortical and trabecular compartments based on a dual threshold technique for in vivo micro-CT bone analysis. Bone. 2007;41:505–15. doi: 10.1016/j.bone.2007.07.007. [DOI] [PubMed] [Google Scholar]
- 77.Campadelli P, Casiraghi E, Esposito A. Liver segmentation from computed tomography scans: a survey and a new algorithm. Artif Intell Med. 2009;45:185–96. doi: 10.1016/j.artmed.2008.07.020. [DOI] [PubMed] [Google Scholar]
- 78.Passera K, Selvaggi S, Scaramuzza D, Garbagnati F, Vergnaghi D, Mainardi L. Radiofrequency ablation of liver tumors: quantitative assessment of tumor coverage through CT image processing. BMC Med Imaging. 2013;13:3. doi: 10.1186/1471-2342-13-3. [DOI] [PMC free article] [PubMed] [Google Scholar]
- 79.Muller R, Gerber SC, Hayes WC. Micro-compression: a novel technique for the nondestructive assessment of local bone failure. Technol Health Care. 1998;6:433–44. [PubMed] [Google Scholar]
- 80.Thimm BW, Hofmann S, Schneider P, Carretta R, Muller R. Imaging of cellular spread on a three-dimensional scaffold by means of a novel cell-labeling technique for high-resolution computed tomography. Tissue Eng Part C Methods. 2012;18:167–75. doi: 10.1089/ten.TEC.2011.0262. [DOI] [PubMed] [Google Scholar]
- 81.Palmer AW, Guldberg RE, Levenston ME. Analysis of cartilage matrix fixed charge density and three-dimensional morphology via contrast-enhanced microcomputed tomography. Proc Natl Acad Sci USA. 2006;103:19255–60. doi: 10.1073/pnas.0606406103. [DOI] [PMC free article] [PubMed] [Google Scholar]
- 82.Xie L, Lin ASP, Levenston ME, Guldberg RE. Quantitative assessment of articular cartilage morphology via EPIC-μCT. Osteoarthr Cartilage. 2009;17:313–20. doi: 10.1016/j.joca.2008.07.015. [DOI] [PMC free article] [PubMed] [Google Scholar]
- 83.Xie L, Lin ASP, Guldberg RE, Levenston ME. Nondestructive assessment of sGAG content and distribution in normal and degraded rat articular cartilage via EPIC-µCT. Osteoarthr Cartilage. 2010;18:65–72. doi: 10.1016/j.joca.2009.07.014. [DOI] [PMC free article] [PubMed] [Google Scholar]
- 84.Xie L, Lin ASP, Kundu K, Levenston ME, Murthy N, Guldberg RE. Quantitative imaging of cartilage and bone morphology, reactive oxygen species, and vascularization in a rodent model of osteoarthritis. Arthritis Rheum. 2012;64:1899–908. doi: 10.1002/art.34370. [DOI] [PMC free article] [PubMed] [Google Scholar]
- 85.Benders KEM, Malda J, Saris DBF, Dhert WJA, Steck R, Hutmacher DW, Klein TJ. Formalin fixation affects equilibrium partitioning of an ionic contrast agent-microcomputed tomography (EPIC-µCT) imaging of osteochondral samples. Osteoarthr Cartilage. 2010;18:1586–91. doi: 10.1016/j.joca.2010.10.005. [DOI] [PubMed] [Google Scholar]
- 86.Kotwal N, Li J, Sandy J, Plaas A, Sumner DR. Initial application of EPIC-µCT to assess mouse articular cartilage morphology and composition: effects of aging and treadmill running. Osteoarthr Cartilage. 2012;20:887–95. doi: 10.1016/j.joca.2012.04.012. [DOI] [PMC free article] [PubMed] [Google Scholar]
- 87.Thote T, Lin ASP, Raji Y, Moran S, Stevens HY, Hart M, Kamath RV, Guldberg RE, Willett NJ. Localized 3D analysis of cartilage composition and morphology in small animal models of joint degeneration. Osteoarthr Cartilage. 2013;21:1132–41. doi: 10.1016/j.joca.2013.05.018. [DOI] [PubMed] [Google Scholar]
- 88.Wang Y, Huang YC, Gertzman AA, Xie L, Nizkorodov A, Hyzy SL, Truncale K, Guldberg RE, Schwartz Z, Boyan BD. Endogenous regeneration of critical-size chondral defects in immunocompromised rat xiphoid cartilage using decellularized human bone matrix scaffolds. Tissue Eng Part A. 2012;18:2332–42. doi: 10.1089/ten.TEA.2011.0688. [DOI] [PubMed] [Google Scholar]
- 89.Kok AC, Tuijthof GJM, Den Dunnen S, Van Tiel J, Siebelt M, Everts V, van Dijk CN, Kerkhoffs GM. No effect of hole geometry in microfracture for talar osteochondral defects. Clin Orthop Relat Res. 2013;471:3653–62. doi: 10.1007/s11999-013-3189-y. [DOI] [PMC free article] [PubMed] [Google Scholar]
- 90.Maerz T, Newton MD, Kristof K, Motovylyak O, Fischgrund JS, Park DK, Baker KC. Three-dimensional characterization of in vivo intervertebral disc degeneration using EPIC-μCT. Osteoarthr Cartilage. 2014;22:1918–25. doi: 10.1016/j.joca.2014.08.006. [DOI] [PubMed] [Google Scholar]


