

Abstract
Background
We investigated the association between 8 single-nucleotide polymorphisms (SNPs) at 3 genetic loci (CDKAL1, CDKN2A/2B and FTO) with type 2 diabetes (T2D) in a Uyghur population.
Material/Methods
A case-control study of 879 Uyghur patients with T2D and 895 non-diabetic Uyghur controls was conducted at the Hospital of Xinjiang Medical University between 2010 and 2013. Eight SNPs in CDKAL1, CDKN2A/2B and FTO were analyzed using Sequenom MassARRAY®SNP genotyping. Factors associated with T2D were assessed by logistic regression analyses. Gene-gene and gene-environment interactions were analyzed by generalized multifactor dimensionality reduction.
Results
Genotype distributions of rs10811661 (CDKN2A/2B), rs7195539, rs8050136, and rs9939609 (FTO) and allele frequencies of rs8050136 and rs9939609 differed significantly between diabetes and control groups (all P<0.05). While rs10811661, rs8050136, and rs9939609 were eliminated after adjusting for covariates (P>0.05), rs7195539 distribution differed significantly in co-dominant and dominant models (P<0.05). In gene-gene interaction analysis, after adjusting for covariates the two-locus rs10811661-rs7195539 interaction model had a cross-validation consistency of 10/10 and the highest balanced accuracy of 0.5483 (P=0.014). In gene-environment interaction analysis, the 3-locus interaction model TG-HDL-family history of diabetes had a cross-validation consistency of 10/10 and the highest balanced accuracy of 0.7072 (P<0.001). The 4-locus interaction model, rs7195539-TG-HDL-family history of diabetes had a cross-validation consistency of 8/10 (P<0.001).
Conclusions
Polymorphisms in CDKN2A/2B and FTO, but not CDKAL1, may be associated with T2D, and alleles rs8050136 and rs9939609 are likely risk alleles for T2D in this population. There were potential interactions among CDKN2A/2B (rs10811661) – FTO (rs7195539) or FTO (rs7195539)-TG-HDL-family history of diabetes in the pathogenesis of T2D in a Uyghur population.
MeSH Keywords: Diabetes Mellitus, Type 2; Genes, p16; Multifactor Dimensionality Reduction; Polymorphism, Genetic
Background
The International Diabetes Federation (IDF) has reported that there were 382 million people living with diabetes worldwide in 2013, and this number is expected to rise to 592 million by 2035 [1]. Most people with diabetes live in low- and middle-income countries, where rapid changes in lifestyle have increased the prevalence of diabetes, cardiovascular diseases, and cancer, and these countries are expected to experience the greatest increase in cases of diabetes in the next 20 years. In 2010, the Chinese Center for Disease Control and Prevention (CDC) and the Endocrinology Branch of the Chinese Medical Association conducted a cross-sectional survey in a nationally representative sample of 98,658 Chinese adults with diabetes. The prevalence of diabetes in Chinese adults was estimated to be 9.7% using the 1999 World Health Organization criteria. However, when glycosylated hemoglobin (HbA1c) ≥6.5% was included in the diagnostic criteria, the prevalence of diabetes in China was estimated to be approximately 11.6%, of which only one-quarter (25.8%) received treatment for diabetes, and only roughly one-third of those receiving treatment (39.7%) achieved adequate glycemic control [2].
Xinjiang is located in the middle of the Eurasian continent occupying one sixth of the mainland. It is a multi-ethnic region where the Uyghur nationality comprises about 46% of the total population. In 2012, Yang et al. screened an Uyghur population of 4620 adults aged over 35 years and found that 6.23% had type 2 diabetes (T2D) [3]. Only 35% of these participants were aware of their diabetes, 7.3% were taking hypoglycemic agents, and 3.13% achieved blood glucose control. These data demonstrate an urgent need to develop effective strategies to improve prevention, detection, and treatment of diabetes in the Uyghur population.
Development of T2D can be attributed to the combined effect of genetic and environmental factors. Establishment of single-nucleotide polymorphism (SNP) databases, development and improvement of cost-effective high-throughput genotyping technology, and multi-center consortium large-scale genome-wide association studies (GWAS) is an effective method to investigate genetic susceptibility to T2D. By searching susceptibility variants across the entire genome in an unbiased, hypothesis-free manner, GWAS have successfully identified genetic loci robustly associated with T2D, the number of which has risen from just three in 2006 to approximately 70 today [4]. The first GWAS analysis for T2D was conducted in a European cohort in 2007. The study was initially conducted in 600 T2D patients and 600 control patients, and was followed by a related study of nearly 3,000 T2D patients and 3000 controls from an independent European cohort [5]. This study identified 3 novel susceptibility genes associated with T2D including TCF7L2, HHEX/IDE and SLC30A8. Subsequently, a large number of T2D associated susceptibility genes have been characterized by GWAS, including the cyclin-dependent kinase inhibitor 2A/2B (CDKN2A/2B) gene [6], the CDK5 regulatory subunit associated protein 1-like 1 (CDKAL1) gene [6], and the fat mass and obesity-associated (FTO) gene [7].
The HapMap Project has provided data for genome-wide SNPs in diverse populations such as Han Chinese and European residents. Nevertheless, the association between CDKN2A/2B [6], CDKAL1 [6] and FTO [7] and T2D has not been verified in an Uyghur population. This study aims to investigate the genotype distribution of SNPs and to assess the association between gene polymorphisms and T2D in Uyghur adults. Furthermore, using multifactor dimensionality reduction (MDR), a nonparametric and genetic model-free method for detecting and characterizing nonlinear interactions between discrete genetic and environmental attributes [8], the capacity of gene-gene and gene-environment interactions to predict T2D will be investigated. MDR has been successfully applied in studies investigating the etiology of diseases such as multiple sclerosis and T2D [9]. Lou et al. proposed a modified Generalized MDR (GMDR) method applicable to both dichotomous and continuous variables in population-based study designs, which improves predictive ability [10]. We will apply GMDR to provide information about the molecular pathogenesis of T2D in the Uyghur population.
Material and Methods
Study design
A case-controlled study of Uyghur patients with T2D and non-diabetic controls was conducted at the First Affiliated Hospital of Xinjiang Medical University between March 2012 and September 2013. Written informed consent was obtained from each participant prior to the study, and the protocol was approved by the Ethics Committee of the First Affiliated Hospital of Xinjiang Medical University.
Patients with T2D were recruited according to the following inclusion criteria: newly diagnosed T2D according to WHO criteria [11], fasting plasma glucose (FPG) ≥7.0 mmol/L, and/or oral glucose tolerance test 2 hour sample (OGTT-2h) ≥11.0 mmol/L, or previously diagnosed T2D treated with hypoglycemic drugs where FPG and OGTT-2h levels were below the diagnostic levels. The exclusion criteria for the patient group included: patients with type 1 diabetes, or any wasting diseases such as viral infections, tuberculosis, cancer, mental illness, epilepsy, or acute inflammation.
Non-diabetic control patients were enrolled during health examination at the hospital during according to the following inclusion criteria: fasting plasma glucose <7.0 mmol/L, and/or OGTT-2h <11.1 mmol/L, and without a history of treatment with hypoglycemic agents. The exclusion criteria included: any wasting diseases such as viral infections, tuberculosis, cancer, mental illness, epilepsy, and acute inflammation.
Subject clinical characteristics
Any previous diagnoses, current clinical characteristics and family medical history of all diabetic and non-diabetic control patients were recorded. Clinical characteristics included height, weight, body mass index (BMI), waist circumference at the midpoint between the lateral iliac crest and the lower edge of the ribs in the midaxillary line, and systolic and diastolic blood pressures. Peripheral blood samples were drawn from all subjects after fasting for 8 hours, with 4 ml of blood mixed with or without anticoagulants. The blood samples were centrifuged at 3500 r/min for 10 min within 2 hours of collection. Serum creatinine (Scr), uric acid (UA), fasting plasma glucose (FPG), triglycerides (TG), total cholesterol (TC), high density lipoproteins (HDL), low density lipoproteins (LDL), aspartate aminotransferase (AST), and alanine aminotransferase (ALT) were measured with qualified controls using a Hitachi 7600 automatic biochemical analyzer in the Clinical Laboratory of the First Affiliated Hospital of Xinjiang Medical University.
Hypertension was diagnosed according to the 2010 Guidelines for prevention and treatment of hypertension in China [12]. Coronary heart disease (CHD) was diagnosed by a cardiology specialist according to the 1979 WHO diagnostic criteria [13], or according to a previous medical history of angina or myocardial infarction previously confirmed as CHD. Non-alcoholic fatty liver disease (NAFLD) was diagnosed according to the nonalcoholic fatty liver disease diagnostic criteria established in 2010 by the Chinese Society of Hepatology [14]. Dyslipidemia was diagnosed according to the Guidelines on Prevention and Treatment of Blood Lipid Abnormality in Chinese Adults established in 2007 [15], or previous diagnosis of dyslipidemia and treatment with a lipid-lowering drug. Stroke was diagnosed according to the criteria established by the Fourth National Conference on cerebrovascular diseases in 1995 [16].
Detection of SNPs within CDKAL1, CDKN2A/2B, and FTO
Anticoagulated blood samples were stored at −80°C for DNA extraction using the iAUTOMAG DNA extraction system (BioTeke Corp., Beijing, China) following the manufacturer’s instructions. The concentration and quality of extracted DNA was assessed by 1% agarose gel electrophoresis. Samples containing greater than 50 ng/μl DNA, an A260/A280 ratio (OD) between 1.8–2.0, and a clear band in gel electrophoresis were used for further analysis and transferred to 96-well plates and stored at −20ºC for later use.
Eight hotspot SNPs within the CDKAL1, CDKN2A/2B, and FTO genes were selected, including loci rs10946398, rs7754840 (CDKAL1), rs10811661, rs3088440, rs11515 (CDKN2A/2B), rs7195539, rs8050136, and rs9939609 (FTO). SNPs were detected by CapitalBio Corporation (Beijing, China) using the Sequenom MassARRAY®SNP technology with a genotyping success rate and accuracy >98%.
Sequenom MassARRAY®SNP detection
PCR reactions were carried out in 5 μl per well of a 384-well plate using 4 μl of PCR master mix, 20–50 ng template DNA, 0.5 U of Hotstar Taq, 0.5 pmol of each primer, and 0.1 μl of 25 mM dNTPs incubated at 94°C for 4 min; 94°C for 20 sec; 56°C for 30 sec; 72°C for 1 min; for 45 cycles and 72°C for 3 min. PCR products were treated with shrimp alkaline phosphatase (SAP) to remove free dNTPs and PCR was performed with 2 μl of SAP mix (SAP 0.5 U, buffer 0.17 μl) and 5 μl of PCR product at 37°C for 40 min and 85°C for 5 min. After SAP treatment, a single-base extension reaction was carried out with 7 μl of SAP-treated PCR product and 2 μl of EXTEND Mix (primer mix 0.94 μl, iPLEX enzyme 0.041 μl, and extending mixture 0.2 μl) at 94°C for 30 sec; 94°C for 5 sec; 52°C for 5 sec; 80°C for 5 sec; GOTO III, 4 more times; GOTO II, 39 more times; and 72°C for 3 min.
Purified extension products were loaded onto the 384 SpectroCHIP (Sequenom) chip using a MassARRAY Nanodispenser RS1000 spotter. The spotted SpectroCHIP chips were analyzed using matrix-assisted laser desorption/ionization-time of flight (MALDI-TOF) mass spectrometry. All results were obtained using TYPER 4.0 software (Sequenom) genotyping.
Statistical analysis
All statistical analyses were performed using IBM SPSS 21.0 software (IBM Corp., Armonk, NY, USA). The Hardy-Weinberg equilibrium (HWE) of the control group was calculated to evaluate whether our samples were representative of a population. All normally distributed qualitative data are expressed as mean ± standard deviation, and comparisons between two groups were carried out using the t test. Abnormally distributed data are presented as median and quartiles, and group-group comparisons were conducted using the Wilcoxon rank test. Differences in qualitative data, SNP genotype or allele frequency were analyzed using the χ2 test. Logistic regression analysis was applied to evaluate risk factors associated with T2D, using co-dominant, dominant, recessive, additive, and over-dominant models for each SNP.
For gene-environment interaction analysis, clinical characteristics were categorized accordingly. According to the Guidelines for prevention and control of overweight and obesity in Chinese adults established in 2004 [17], patients were categorized as underweight if BMI <18.5 kg/m2 (value=0); normal weight if 18.5 kg/m2 ≤BMI <24 kg/m2 (value=1); overweight if 24 kg/m2 ≤BMI <28 kg/m2 (value=2); or obese if BMI ≥28 kg/m2 (value=3). The waistline (WL) values were categorized as 0 where male WL <85 cm or female WL <80 cm, and 1 where male WL ≥85 cm or female WL ≥80 cm. According the Guidelines on Prevention and Treatment of Blood Lipid Abnormality in Chinese Adults established in 2007 [15], the scores associated with TG, TC, HDL, and LDL levels were categorized as 0 where TG <1.7 mmol/L, TC <5.18 mmol/L, HDL ≥1.04 mmol/L, and LDL <3.37 mmol/L, and 1 where TG ≥1.7 mmol/L, TC ≥5.18 mmol/L, HDL <1.04 mmol/L, and LDL ≥3.37 mmol/L.
Gene-gene interactions within each SNP were analyzed using Generalized MDR (GMDR) 0.9 software (http://www.ssg.uab.edu/gmdr/) using the best model with a relatively high cross-validation count and balanced testing accuracy. Statistical significance was considered at P<0.05.
Results
General characteristics of the study population
In total 879 Uyghur patients with T2D hospitalized in the First Affiliated Hospital of Xinjiang Medical University were enrolled between March 2012 and September 2013, including 543 males and 336 females aged 21–83 years. 895 non-diabetic, unrelated Uyghur adults were included as controls, including 571 males and 324 females aged 21–79 years.
There were no significant differences in age or sex between the diabetes and control groups (P=0.302, and 0.378, respectively; Table 1). The levels of BMI, WL, SBP, FPG, and ALT in the diabetes group were higher than those in the control group (P<0.05), whereas the UA, SCR, HDL, and LDL levels were lower in diabetic patients than in controls (P<0.05). The proportion of patients with a family history of diabetes, or hypertension, CHD, NAFLD, dyslipidemia, stroke, smoking, alcohol abuse or high pressure work environment was higher in the diabetes group than in the control group (P<0.05). However, the levels of DBP, TG, TC, and AST did not differ significantly between these groups (P>0.05) (Table 1).
Table 1.
A comparison of clinical characteristics between the diabetes and control groups.
| Control | T2DM | P | ||||
|---|---|---|---|---|---|---|
| Age (years) | 20–29 | 15 | (1.7%) | 14 | (1.6%) | 0.302 |
| 30–39 | 83 | (9.3%) | 69 | (7.8%) | ||
| 40–49 | 324 | (36.2%) | 293 | (33.3%) | ||
| 50–59 | 329 | (36.8%) | 357 | (40.6%) | ||
| 60–69 | 106 | (11.8%) | 118 | (13.4%) | ||
| 70–79 | 38 | (4.2%) | 28 | (3.2%) | ||
| Sex | Male | 571 | (63.8%) | 543 | (61.8%) | 0.378 |
| Female | 324 | (36.2%) | 336 | (38.2%) | ||
| BMI | 26.73 | (24.67–29.41) | 28.09 | (25.34–31.10) | <0.001 | |
| WL | 96.00 | (90.00–102.00) | 98.00 | (93.00–106.00) | <0.001 | |
| UA | 288.00 | (237.26–335.69) | 265.00 | (213.00–317.62) | <0.001 | |
| SBP | 122.00 | (110.00–132.00) | 125.00 | (113.00–140.00) | <0.001 | |
| DBP | 76.00 | (69.00–84.00) | 80.00 | (70.00–83.00) | 0.052 | |
| SCR | 69.00 | (58.64–78.55) | 62.00 | (51.00–73.00) | <0.001 | |
| FPG | 4.83 | (4.53–5.20) | 8.28 | (6.67–11.1) | <0.001 | |
| TG | 1.40 | (0.98–2.00) | 1.83 | (1.25–2.72) | 0.272 | |
| TC | 4.98 | (4.42–5.53) | 4.53 | (3.81–5.3) | 0.404 | |
| HDL | 1.21 | (1.00–1.40) | 0.90 | (0.74–1.09) | <0.001 | |
| LDL | 2.92 | (2.46–3.40) | 2.74 | (2.19–3.38) | <0.001 | |
| AST | 19.50 | (16.20–24.50) | 18.5 | (14.6–25.2) | 0.146 | |
| ALT | 22.40 | (16.9–32.3) | 24.2 | (17.20–38.3) | 0.009 | |
| Diabetes family-history | 106 | (11.8%) | 294 | (33.4%) | <0.001 | |
| Hypertension | 215 | (24.0%) | 470 | (53.5%) | <0.001 | |
| CHD | 42 | (4.7%) | 250 | (28.4%) | <0.001 | |
| NAFLD | 336 | (37.5%) | 480 | (54.6%) | <0.001 | |
| Dyslipidemia | 668 | (74.6%) | 756 | (86.0%) | <0.001 | |
| Stroke | 0 | 31 | (3.5%) | <0.001 | ||
| Gout | 4 | (0.4%) | 18 | (2.0%) | 0.002 | |
| Smoking | 217 | (24.2%) | 317 | (36.1%) | <0.001 | |
| Drinking | 193 | (21.6%) | 265 | (30.1%) | <0.001 | |
| Work stress | 456 | (50.9%) | 509 | (57.9%) | 0.003 | |
ALT – alanine aminotransferase; AST – aspartate aminotransferase; BMI – body mass index; CHD – coronary heart disease; DBP – diastolic pressure; FPG – fasting plasma glucose; HDL – high density lipoprotein; LDL – low density lipoprotein; NAFLD – non-alcoholic fatty liver disease; SBP – systolic pressure; SCR – serum creatinine; T2DM – type 2 diabetes mellitus; TC – total cholesterol; TG – triglyceride; UA – uric acid; WL – waistline.
Analysis of risk factors associated with type 2 diabetes in the Uyghur population
Univariate logistic regression analyses were conducted to analyze the variables associated with T2D, and multivariate logistic regression analyses were conducted to analyze the variables showing statistically significant differences in the univariate logistic regression analyses (Table 2). Hypertension, CHD, family history of diabetes, FPG, TC, and HDL were independent risk factors for T2D (P<0.001).
Table 2.
Multiple-factor logistic regression analysis of risk factors correlated with type 2 diabetes.
| Variable | P | OR | 95%CI |
|---|---|---|---|
| Hypertension | <0.001 | 3.769 | 2.462–5.770 |
| CHD | <0.001 | 7.606 | 4.157–13.915 |
| Diabetes family-history | <0.001 | 4.149 | 2.470–6.967 |
| FPG | <0.001 | 5.570 | 4.414–7.029 |
| TC | <0.001 | 0.669 | 0.555–0.806 |
| HDL | <0.001 | 0.133 | 0.065–0.275 |
CHD – coronary heart disease; CI – confidence interval; FPG – fasting plasma glucose; HDL – high density lipoprotein; TC – total cholesterol.
Distribution of SNP genotypes in the Uyghur population
The Hardy-Weinberg equilibrium (HWE) test was performed to assess the genotype distributions of SNPs in the control group. The genotype distributions of 7 of the 8 sites in the control group were within HWE (P>0.05), indicating that these samples were representative of the Uyghur nationality. However, the genotype distribution of rs11515 did not fit the HWE in the control group (P=0.041), and was thus excluded from further analysis. Logistic regression analyses of genetic models of SNP genotype and allele frequency revealed statistically significant differences in the genotype distributions and allele frequencies between the diabetes and control groups within loci rs10811661 (CDKN2A/2B), rs7195539 (FTO), rs8050136 (FTO), and rs9939609 (FTO) (P<0.05), but not in loci rs10946398 (CDKAL1), rs7754840 (CDKAL1), or rs3088440 (CDKN2A/2B), (P>0.05; Table 3). The allele distributions in loci rs8050136 (FTO) and rs9939609 (FTO) exhibited significant divergence between the diabetes and control groups (P<0.05), and allele A was a common risk allele for both loci. The odds ratio (OR) values were 1.198 (95% confidence interval [CI]: 1.037–1.384) for rs8050136 (FTO) and 1.238 (95% CI: 1.075–14.427) for rs9939609 (FTO).
Table 3.
Logistic regression analysis of distributions and genetic models of each SNP’s genotype and allele frequency.
| Gene | SNP | Control n (%) | Case n (%) | P value | OR (95%CI) | P value* | OR (95%CI)* | ||
|---|---|---|---|---|---|---|---|---|---|
| CDKAL1 | rs10946398 | Genotype | AA/CA/CC | 384/403/ 108 | 362/393/ 124 | 0.419 | |||
| Allele | A/C | 1171/619 | 1117/641 | 0.242 | 1.086 (0.946–1.246) | ||||
| Co-dominant model | AA | 384 (42.9) | 362 (41.2) | 1 | 1 | ||||
| CA | 403 (45.0) | 393 (44.7) | 0.740 | 1.034 (0.847–1.263) | 0.901 | 1.025 (0.691–1.521) | |||
| CC | 108 (12.1) | 124 (14.1) | 0.191 | 1.218 (0.907–1.636) | 0.606 | 0.852 (0.463–1.566) | |||
| Additive model | 0.247 | 1.084 (0.946–1.242) | 0.736 | 0.954 (0.725–1.255) | |||||
| Dominant model | AA | 384 (42.9) | 362 (41.2) | 1 | 1 | ||||
| CA+CC | 511 (57.1) | 517 (58.8) | 0.463 | 1.073 (0.889–1.296) | 0.814 | 1.045 (0.724–1.508) | |||
| Recessive model | AA+CA | 787 (87.9) | 755 (85.9) | 1 | 1 | ||||
| CC | 108 (12.1) | 124 (14.1) | 0.203 | 1.197 (0.908–1.578) | 0.577 | 0.855 (0.493–1.483) | |||
| Over-dominant model | AA+CC | 592 (55.0) | 486 (55.3) | 1 | 1 | ||||
| CA | 403 (45.0) | 393 (44.7) | 0.893 | 0.987 (0.819–1.190) | 0.544 | 1.120 (0.778–1.612) | |||
| rs7754840 | Genotype | GG/GC/CC | 383/403/ 109 | 362/393/ 124 | 0.460 | ||||
| Allele | G/C | 1169/621 | 1117/641 | 0.271 | 1.080 (0.941–1.239) | ||||
| Co-dominant model | GG | 383 (42.8) | 362 (41.2) | 1 | 1 | ||||
| GC | 403 (45.0) | 393 (44.7) | 0.759 | 1.032 (0.845–1.260) | 0.895 | 1.027 (0.692–1.523) | |||
| CC | 109 (12.2) | 124 (14.1) | 0.218 | 1.204 (0.896–1.616) | 0.592 | 0.847 (0.461–1.556) | |||
| Additive model | 0.276 | 1.079 (0.941–1.236) | 0.726 | 0.952 (0.724–1.253) | |||||
| Dominant model | GG | 383 (42.8) | 362 (41.2) | 1 | 1 | ||||
| GC+CC | 512 (57.2) | 517 (58.8) | 0.492 | 1.068 (0.885–1.290) | 0.815 | 1.045 (0.724–1.507) | |||
| Recessive model | GG+GC | 786 (87.8) | 755 (85.9) | 1 | 1 | ||||
| CC | 109 (12.2) | 124 (14.1) | 0.230 | 1.184 (0.899–1.561) | 0.555 | 0.847 (0.489–1.468) | |||
| Over-dominant model | GG+CC | 492 (55.0) | 486 (55.3) | 1 | 1 | ||||
| GC | 403 (45.0) | 393 (44.7) | 0.893 | 0.987 (0.819–1.190) | 0.529 | 1.124 (0.781–1.619) | |||
| CDKN2A/ 2B | rs10811661 | Genotype | TT/CT/CC | 481/346/ 68 | 525/304 /50 | 0.026 | |||
| Allele | T/C | 1308/482 | 1354/404 | 0.246 | 0.912 (0.780–1.066) | ||||
| Co-dominant model | CC | 68 (7.6) | 50 (5.7) | 1 | 1 | ||||
| CT | 346 (38.7) | 304 (34.6) | 0.378 | 1.195 (0.804–1.776) | 0.301 | 0.668 (0.311–1.436) | |||
| TT | 481 (53.7) | 525 (59.7) | 0.045 | 1.484 (1.010–2.183) | 0.930 | 0.967 (0.461–2.029) | |||
| Additive model | 0.007 | 1.230 (1.057–1.431) | 0.280 | 1.182 (0.873–1.599) | |||||
| Dominant model | CC | 68 (7.6) | 50 (5.7) | 1 | 1 | ||||
| CT+TT | 827 (92.4) | 829 (94.3) | 0.108 | 1.363 (0.935–1.989) | 0.648 | 0.850 (0.422–1.710) | |||
| Recessive model | CC+CT | 414 (46.3) | 354 (40.3) | 1 | 1 | ||||
| TT | 481 (53.7) | 525 (59.7) | 0.011 | 1.276 (1.057–1.541) | 0.095 | 1.371 (0.947–1.985) | |||
| Over-dominant model | CC+TT | 549 (61.3) | 575 (65.4) | 1 | 1 | ||||
| CT | 346 (38.7) | 304 (34.6) | 0.075 | 0.839 (0.691–1.018) | 0.051 | 0.683 (0.465–1.002) | |||
| rs3088440 | Genotype | GG/GA/AA | 749/136 /10 | 710/164 /5 | 0.079 | ||||
| Allele | G/A | 1634/156 | 1584/174 | 0.225 | 1.151 (0.917–1.444) | ||||
| Co-dominant model | GG | 749 (83.7) | 710 (80.8) | 1 | 1 | ||||
| GA | 136 (15.2) | 164 (18.7) | 0.059 | 1.272 (0.991–1.632) | 0.354 | 1.260 (0.773–2.054) | |||
| AA | 10 (1.1) | 5 (0.6) | 0.245 | 0.527 (0.179–1.551) | 0.436 | 0.450 (0.061–3.345) | |||
| Additive model | 0.225 | 1.151 (0.917–1.445 | 0.661 | 1.102 (0.714–1.703) | |||||
| Dominant model | GG | 749 (83.7) | 710 (80.8) | 1 | 1 | ||||
| GA+AA | 146 (16.3) | 169 (19.2) | 0.109 | 1.221 (0.957–1.559) | 0.539 | 1.158 (0.725–1.849) | |||
| Recessive model | GG+GA | 885 (98.9) | 874 (99.4) | 1 | 1 | ||||
| AA | 10 (1.1) | 5 (0.6) | 0.216 | 0.506 (0.172–1.487) | 0.379 | 0.414 (0.058–2.955) | |||
| Over-dominant model | GG+AA | 758 (84.8) | 715 (81.3) | 1 | 1 | ||||
| GA | 136 (15.2) | 164 (18.7) | 0.052 | 1.280 (0.998–1.642) | 0.373 | 1.243 (0.770–2.005) | |||
| FTO | rs7195539 | Genotype | AA/AG/GG | 809/85/ 1 | 811/62/ 6 | 0.032 | |||
| Allele | A/G | 1703/87 | 1684/74 | 0.352 | 0.860 (0.626–1.181) | ||||
| Co-dominant model | GG | 1 (0.1) | 6 (0.7) | 1 | 1 | ||||
| AG | 85 (9.5) | 62 (7.1) | 0.054 | 0.122 (0.014–1.036) | 0.009 | 0.013 (0.001–0.334) | |||
| AA | 809 (90.4) | 811 (92.3) | 0.098 | 0.167 (0.020–1.391) | 0.012 | 0.017 (0.001–0.405) | |||
| Additive model | 0.362 | 1.155 (0.847–1.576) | 0.935 | 1.027 (0.540–1.952) | |||||
| Dominant model | GG | 1(0.1) | 6 (0.7) | 1 | 1 | ||||
| AG+AA | 894 (99.9) | 873 (99.3) | 0.093 | 0.163 (0.020–1.355) | 0.031 | 0.026 (0.001–0.713) | |||
| Recessive model | GG+AG | 86 (9.6) | 68 (7.7) | 1 | 1 | ||||
| AA | 809 (90.4) | 811 (92.3) | 0.162 | 1.268 (0.909–1.768) | 0.475 | 1.272 (0.657–2.464) | |||
| Over-dominant model | GG+AA | 810 (90.5) | 817 (92.9) | 1 | 1 | ||||
| AG | 85 (9.5) | 62 (7.1) | 0.063 | 0.723 (0.514–1.017) | 0.302 | 0.702 (0.358–1.374) | |||
| rs8050136 | Genotype | CC/CA/AA | 470/357/ 68 | 418/372/89 | 0.049 | ||||
| Allele | C/A | 1297/493 | 1208/550 | 0.014 | 1.198 (1.037–1.384) | ||||
| Co-dominant model | CC | 470 (52.5) | 418 (47.6) | 1 | 1 | ||||
| CA | 357 (39.9) | 372 (42.3) | 0.113 | 1.172 (0.963–1.425) | 0.582 | 0.896 (0.607–1.323) | |||
| AA | 68 (7.6) | 89 (10.1) | 0.027 | 1.472 (1.045–2.072) | 0.536 | 1.235 (0.633–2.411) | |||
| Additive model | 0.015 | 1.196 (1.035–1.382) | 0.897 | 1.019 (0.766–1.355) | |||||
| Dominant model | CC | 470 (52.5) | 418 (47.6) | 1 | 1 | ||||
| CA+AA | 425 (47.5) | 461 (52.4) | 0.037 | 1.220 (1.012–1.470) | 0.927 | 0.983 (0.674–1.432) | |||
| Recessive model | CC+CA | 827 (92.4) | 790 (89.9) | 1 | 1 | ||||
| AA | 68 (7.6) | 89 (10.1) | 0.062 | 1.370 (0.985–1.907) | 0.306 | 1.398 (0.736–2.655) | |||
| Over-dominant model | CC+AA | 538 (60.1) | 507 (57.7) | 1 | 1 | ||||
| CA | 357 (39.9) | 372 (42.3) | 0.298 | 1.106 (0.915–1.336) | 0.494 | 0.876 (0.599–1.280) | |||
| rs9939609 | Genotype | TT/TA/AA | 452/358/ 85 | 390/378/ 111 | 0.015 | ||||
| Allele | T/A | 1262/528 | 1158/600 | 0.003 | 1.238 (1.075–1.427) | ||||
| Co-dominant model | TT | 452 (50.5) | 390 (44.4) | 1 | 1 | ||||
| TA | 358 (40.0) | 378 (43.0) | 0.046 | 1.224 (1.004–1.492) | 0.854 | 0.964 (0.651–1.427) | |||
| AA | 85 (9.5) | 111 (12.6) | 0.010 | 1.513 (1.106–2.070) | 0.650 | 1.153 (0.623–2.135) | |||
| Additive model | 0.004 | 1.228 (1.069–1.411) | 0.803 | 1.036 (0.787–1.362) | |||||
| Dominant model | TT | 452 (50.5) | 390 (44.4) | 1 | 1 | ||||
| TA+AA | 443 (49.5) | 489 (55.6) | 0.010 | 1.279 (1.061–1.542) | 0.826 | 1.043 (0.715–1.522) | |||
| Recessive model | TT+TA | 810 (90.5) | 768 (87.4) | 1 | 1 | ||||
| AA | 85 (9.5) | 111 (12.6) | 0.036 | 1.377 (1.021–1,858) | 0.440 | 1.262 (0.699–2.275) | |||
| Over-dominant model | TT+AA | 537 (60.0) | 501 (57.0) | 1 | 1 | ||||
| TA | 358 (40.0) | 378 (43.0) | 0.199 | 1.132 (0.937–1.367) | 0.789 | 0.950 (0.653–1.383) |
Bold text indicates risk alleles.
Indicates a value after adjusting for age, sex, BMI, hypertension, coronary heart disease, family history of diabetes, fasting blood glucose, total cholesterol, and high density lipoprotein.
CI – confidence interval; OR – odds ratio; SNP – single nucleotide polymorphism.
The genotype distribution of rs10811661 (CDKN2A/2B) differed between the diabetes and control groups in co-dominant, additive and recessive models, with P values of 0.045, 0.007, and 0.011, respectively, and OR values of 1.484 (95% CI: 1.010–2.183), 1.230 (95% CI: 1.057–1.431), and 1.276 (95% CI: 1.057–1.541), respectively. Similarly, the rs8050136 (FTO) genotype distributions differed significantly between the two groups in co-dominant, additive and recessive models with P values of 0.027, 0.015, and 0.037, respectively, and OR values of 1.472 (95% CI: 1.045–2.072), 1.196 (95% CI: 1.035–1.382), and 1.220 (95% CI: 1.012–1.470), respectively. In addition, the genotype distributions of rs9939609 (FTO) in co-dominant, additive, dominant, and recessive models differed significantly between the two groups (P=0.046, 0.010, 0.004, 0.010, and 0.036, respectively), with OR values of 1.224 (95% CI: 1.004–1.492), 1.513 (95% CI: 1.106–2.070), 1.228 (95% CI: 1.069–1.411), 1.279 (95% CI: 1.061–1.542), and 1.377 (95% CI: 1.021–1.858), respectively.
However, all the differences discussed above were eliminated after adjusting for sex, age, BMI, hypertension, CHD, family history of diabetes, FPG, TC, and HDL (P>0.05). Nonetheless, the variation in rs7195539 (FTO) genotype distribution between the diabetes and control groups remained significant in co-dominant and dominant models after adjusting for covariates, with P values of 0.009, 0.012, and 0.031, respectively, and OR values of 0.013 (95%CI: 0.001–0.334), 0.017 (95% CI: 0.001–0.404), and 0.026 (95% CI: 0.001–0.713).
Gene-gene and gene-environment interactions between SNPs and environmental factors
The SNP loci were assigned according to co-dominant markers and gene-gene interactions were evaluated by GMDR software (Table 4). After adjusting for covariates including age, sex, BMI, hypertension, CHD, family history of diabetes, FPG, TC, and HDL, the two-locus interaction model rs10811661–rs7195539 appeared to be the best model, with a cross-validation consistency of 10/10, the highest balanced testing accuracy of 0.5483, and a P value of 0.011, which increased to only 0.014 after 1000 permutation tests. The gene-gene interactions in the best model are shown in Figure 1.
Table 4.
GMDR analysis of gene-gene interactions between SNPs.
| Model | Training balance accuracy | Testing balance accuracy | CV consistency | P | P* |
|---|---|---|---|---|---|
| rs10811661 | 0.5305 | 0.4945 | 9/10 | 0.828 | 0.303 |
| rs10811661 rs7195539 | 0.5528 | 0.5483 | 10/10 | 0.011 | 0.014 |
| rs10946398 rs10811661 rs8050136 | 0.5680 | 0.4446 | 5/10 | 0.999 | 0.755 |
| rs10946398, rs10811661, rs3088440, rs8050136 | 0.5892 | 0.4690 | 4/10 | 0.989 | 0.907 |
| rs7754840, rs10811661, rs3088440, rs7195539, rs9939609 | 0.6058 | 0.4542 | 6/10 | 0.989 | 0.955 |
Bold text indicates the best model. P – adjusting for sex, age, body mass index, hypertension, coronary heart disease, family history of diabetes, fasting blood glucose, total cholesterol, and high density lipoprotein.
Indicates 1000 permutation tests.
CV – cross-validation.
Figure 1.
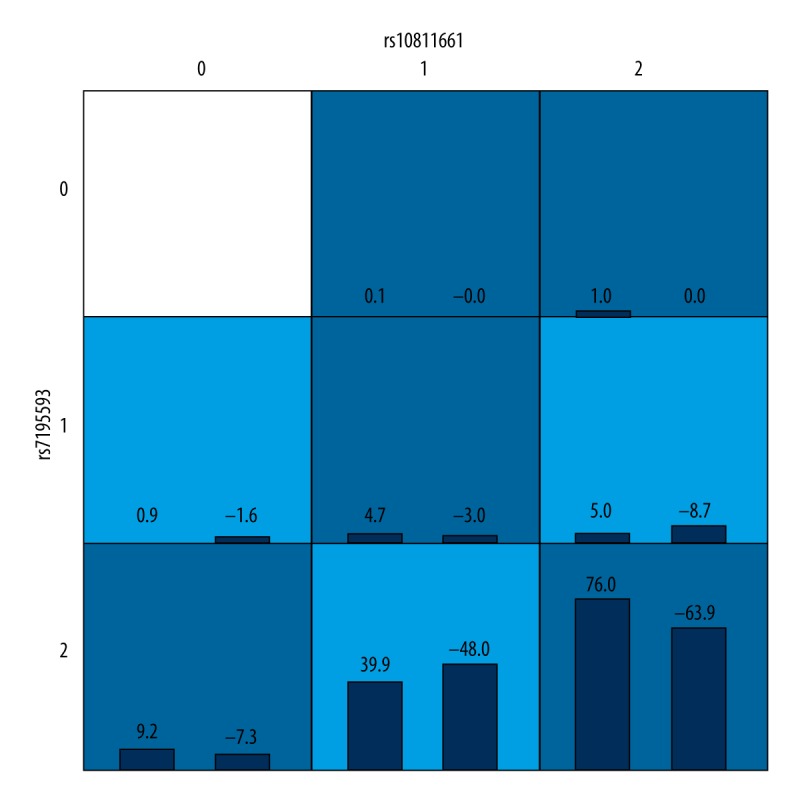
Gene-gene interactions.
Candidate variables for gene-environment interaction analyses were set as each SNP, family history of diabetes, smoking history, alcohol history and work pressure, whereas covariates were set as age, gender, FPG, hypertension, and CHD (Table 5, Figure 2). The three-locus interaction model TG-HDL-family history of diabetes appeared to be the best model with a cross-validation consistency of 10/10, the highest balanced testing accuracy of 0.7072, and a P value of 0.001, which was reduced to <0.001 after 1000 permutation tests. The second-best model was the four-locus interaction model of rs7195539-TG-HDL-family history of diabetes, with a cross-validation consistency of 8/10, the highest balanced testing accuracy of 0.7002, and a P value of 0.001, which was reduced to <0.001 after 1000 permutation tests.
Table 5.
GMDR analysis of gene-environment interactions between SNPs and environmental attributes.
| Model | Training balance accuracy | Testing balance accuracy | CV consistency | P | P* |
|---|---|---|---|---|---|
| HDL | 0.6821 | 0.6808 | 10/10 | 0.001 | <0.001 |
| HDL-family history of T2D | 0.6922 | 0.6923 | 10/10 | 0.001 | <0.001 |
| TG-HDL-family history of T2D | 0.7071 | 0.7072 | 10/10 | 0.001 | <0.001 |
| rs7195539-TG-HDL-family history of T2D | 0.7134 | 0.7001 | 8/10 | 0.001 | <0.001 |
| rs10946398-BMI-TG-HDL-family history of T2D | 0.7294 | 0.6424 | 3/10 | 0.001 | <0.001 |
Bold text indicates the best model. P – adjusting for sex, age, hypertension, coronary heart disease, and fasting blood glucose.
Indicates 1000 permutation tests.
BMI – body mass index; CV – cross-validation; HDL – high density lipoprotein; T2D – type 2 diabetes; TG – triglycerides.
Figure 2.

Gene-environment interactions.
Discussion
Identifying individuals at risk for T2D is extremely important, as this allows the implementation of appropriate strategies to potentially prevent the occurrence of T2D and its systemic complications, including atherosclerotic cardiovascular diseases. It is notable that prediabetes and a family history of diabetes are both associated with impairments of the cardiovascular system and increased cardiovascular risk in the absence of overt T2D, highlighting the importance of identifying susceptible individuals before the disease develops [18]. It has been suggested that systemic inflammation and elevated blood glucose levels in prediabetes lead to microvascular and macrovascular disease that manifest as increased intima-media thickness of the common carotid artery, reduced flow-mediated dilatation, increased arterial stiffness and impaired coronary endothelial function [18]. The insulin resistance associated with a family history of diabetes is though to cause endothelial dysfunction through activation of the Ras/Raf/MAPK pathway, up-regulation of endothelin and its receptors, and reduction of NO levels, as well as increased intima-media thickness of the common carotid artery [18,19]. Although several risk factors for T2D have already been determined, the discovery of new genetic markers will improve the identification of individuals predisposed to the development of this disease. This might help to reduce the burden of T2D on individuals and society through the use of screening and appropriate interventions in those at risk of developing the T2D.
Novel susceptibility genes that have been reported to be associated with T2D include TCF7L2, HHEX/IDE and SLC30A8 [5], CDKN2A/2B [6], CDKAL1 [6] and FTO [7]. This study aimed to analyze the association of CDKN2A/2B, CDKAL1 and FTO with T2D in a Uyghur population.
In a case-control study of 879 Uyghur patients with T2D and 895 age- and sex-matched healthy controls, we found that the genotype distributions of the SNPs rs10811661 (CDKN2A/2B) and rs7195539, rs8050136 and rs9939609 (FTO) differed significantly between the T2D and control groups. The allele frequencies of rs8050136 and rs9939609 also differed significantly between the two groups, and allele A appeared to be a risk allele for both SNPs. Genotype distributions of rs10811661, rs7195539, rs8050136, and rs9939609 differed significantly between genetic models, but rs10811661, rs8050136, and rs9939609 were eliminated after adjusting for covariates, and only rs7195539 differed significantly in both co-dominant and dominant models.
The physiological role of CDKAL1 remains unknown. The amino acid sequence of CDKAL1 is similar to that of CDK5-associated protein 1, which inhibits CDK5 by interacting with its p35 and p39 subunits [20]. Due to the regulatory effects of CDK5 on insulin secretion [21,22], CDKAL1 is suspected to influence insulin secretion by regulating the activity of CDK5. Currently, five non-coding SNPs within the CDKAL1 gene (rs4712523, rs10946398, rs7754840, rs7756992, and rs9465871) have been found to associate with T2D; rs7754840 and rs10946398 exhibited the strongest association with T2D, with complete linkage disequilibrium (LD) between the two loci (r2=1.0) [23]. European carriers of the GC and CC genotypes of rs7754840 had lower first-phase insulin release than carriers of the GG genotype [24]. On the other hand, a study of Finnish men demonstrated that rs7754840 was significantly associated with T2D; hence CDKAL1 is thought to increase the risk of T2D by impairing insulin secretion. CDKAL1 locus rs10946398 was also found to be associated with T2D in a British population [25], and rs10946398 was associated with T2D in a Han population in China [26]. Nevertheless, we did not detect a significant difference in these genotype and allele frequencies between T2D and control groups in a Uyghur population (P>0.05), indicating that the common susceptibility loci rs10946398 and rs7754840 in CDKAL1 were not associated with T2D in Uyghurs.
CDKN2A/2B is located on chromosome 9p21. Both are highly expressed in islet and fat cells, and CDKN2A is also expressed in brain cells. CDKN2A and B are tumor suppressor genes involved in cell proliferation, apoptosis and tumorigenesis, and encode CDK inhibitors p16INK4a and p15INK4b, respectively, which inhibit CDK4 and CDK6 [27]. In a murine model, CDK4 influenced proliferation and quality of β cells, yet its activity was reduced by overexpression of CDKN2A, which in turn caused islet hypoplasia and diabetes [28]. CDKN2A/2B has been reported to be associated with the risk of T2D in a GWAS [6]. However, additional studies in Europe and Asia have both confirmed [26,29–36] and failed to detect [32,37–39] an association between the rs10811661 polymorphism upstream of the CDKN2A/2B gene and T2D. In our study, the genotype distribution of rs10811661 differed significantly between patients in the diabetes group and those in the control group, suggesting that rs1088661 polymorphism may be associated with T2D risk in Uyghurs. The distribution of the rs1088661 genotype also differed significantly in co-dominant, additive and recessive models, indicating an increased risk of T2D in TT genotype carriers. Nevertheless, after adjusting for covariates, such as age, sex, BMI, hypertension, CHD, family history of diabetes, FPG, TC, and HDL, these differences were eliminated suggesting that the locus polymorphism might act via one of the covariates to impact the pathogenesis of T2D in Uyghurs. Several studies have found a correlation between the rs3088440 polymorphism in the CDKN2A/2B gene and the pathogenesis of malignant tumors, including elevated risk of salivary gland carcinoma [40] and melanoma [41], but not the onset of cervical cancer [42] or differentiated thyroid cancer [43]. We found no significant difference between the genotype distributions and allele frequencies of locus rs3088440 between diabetic patients and controls in Uyghurs, suggesting that in this population rs3088440 is not associated with T2D.
The nucleic acid demethylation activity of FTO was hypothesized to regulate the expression of genes involved in metabolism, and dysregulation of this process may cause obesity [44,45]; however, the precise molecular mechanism responsible for this activity remains unclear. Loss of FTO function appeared to reduce appetite control, ultimately leading to obesity. FTO mRNA was found to be abundantly expressed in the brain tissue of wild-type mice, particularly in hypothalamic nuclei governing energy balance [46]. Thus, it is conceivable that the FTO gene may regulate the pathogenesis and development of obesity primarily through its impact on the energy center in the hypothalamus. Few studies have investigated the rs7195539 locus in FTO. Loci rs8050136 and rs9939609 have been reported to associate with T2D in multiple studies, yet there is some inconsistency. This association has been reported to be both mediated by BMI [25,44,47–49] and independent of BMI [50–53]. In this study, the genotype distributions of loci rs7195539, rs8050136, and rs9939609 in the FTO gene differed significantly between the diabetes and control groups, implying that these polymorphisms are associated with T2D in Uyghurs. In addition, the allele frequencies of loci rs8050136 and rs9939609 differed significantly between the two groups with a common allele A. This indicates that Uyghurs with loci rs8050136 and rs9939609 containing allele A have an escalated risk of T2D. The rs8050136 genotype distributions in co-dominant, additive and recessive models also differed significantly, and the genotype distributions of rs9939609 in co-dominant, additive, dominant, and recessive models differed significantly between the two groups. These results suggest that the risk of T2D is higher in Uyghurs carrying CA or AA genotypes at rs8050136 and/or TA or AA genotypes at rs9939609 than in those carrying the CC or TT genotype, respectively. Nevertheless, these variations were eliminated after adjusting for sex, age, BMI, hypertension, CHD, family history of diabetes, FPG, TC, and HDL, indicating that these SNPs are likely to influence the risk of T2D in Uyghurs by affecting BMI.
To date, few GMDR analyses of gene-gene and gene-environment interactions between the CDKAL1, CDKN2A/2B, and FTO genes and T2D have been reported. We found that, after adjusting for demographic and environmental factors, the success of the two-locus model rs10811661–rs7195539 indicated a potential association between these two loci and T2D in Uyghurs. The three-locus interaction model TG-HDL-family history of diabetes appeared to be the best model for analyzing gene-environment interactions after assigning SNPs, biochemical characteristics, family history of diabetes, smoking and alcohol history and work pressure as candidate variables, and age, gender, FPG, hypertension, and CHD as covariates. No gene-environment interactions were observed. The next best model was the four-locus interaction model of rs7195539-TG-HDL-family history of diabetes, suggesting that interactions among these factors may be associated with T2D in Uyghurs.
Conclusions
Our conclusions are somewhat limited by the relatively small sample size included in this study. We observed that rs11515 did not fit the HWE, which may indicate sampling error, and suggests that the control sample was not large enough to adequately represent the genetic diversity of the Uyghur population. We also did not employ a 1:1 matching strategy, so the T2D and control group were not precisely matched. Nevertheless, we observed that CDKAL1 gene polymorphism is unlikely to be associated with a risk of T2D in the Uyghur population. In contrast, CDKN2A/2B (rs10811661) and FTO (rs7195539, rs8050136, rs9939609) polymorphisms may be associated with T2D in this population. rs8050136 allele A and rs9939609 allele A were risk alleles for T2D in the Uyghur population. Furthermore, our analysis suggests that a CDKN2A/2B (rs10811661)-FTO (rs7195539) interaction, or an FTO (rs7195539)-TG-HDL-family history of diabetes interaction is relevant in determining T2D risk.
Footnotes
Conflict of interest
The authors declare that they have no conflict of interest.
Source of support: This work was supported by the National 937 Science and Technology Project (No. 2012CB722403)
References
- 1.Guariguata L, Whiting DR, Hambleton I, et al. Global estimates of diabetes prevalence for 2013 and projections for 2035. Diabetes Res Clin Pract. 2014;103:137–49. doi: 10.1016/j.diabres.2013.11.002. [DOI] [PubMed] [Google Scholar]
- 2.Xu Y, Wang L, He J, et al. Prevalence and control of diabetes in Chinese adults. JAMA. 2013;310:948–59. doi: 10.1001/jama.2013.168118. [DOI] [PubMed] [Google Scholar]
- 3.Yang YN, Xie X, Ma YT, et al. Type 2 diabetes in Xinjiang Uygur autonomous region, China. PLoS One. 2012;7:e35270. doi: 10.1371/journal.pone.0035270. [DOI] [PMC free article] [PubMed] [Google Scholar]
- 4.Kato N. Insights into the genetic basis of type 2 diabetes. J Diabetes Investig. 2013;4:233–44. doi: 10.1111/jdi.12067. [DOI] [PMC free article] [PubMed] [Google Scholar]
- 5.Sladek R, Rocheleau G, Rung J, et al. A genome-wide association study identifies novel risk loci for type 2 diabetes. Nature. 2007;445:881–85. doi: 10.1038/nature05616. [DOI] [PubMed] [Google Scholar]
- 6.Diabetes Genetics Initiative of Broad Institute of Harvard Mit LU, Novartis Institutes of BioMedical Research. Saxena R, Voight BF, et al. Genome-wide association analysis identifies loci for type 2 diabetes and triglyceride levels. Science. 2007;316:1331–36. doi: 10.1126/science.1142358. [DOI] [PubMed] [Google Scholar]
- 7.Frayling TM. Genome-wide association studies provide new insights into type 2 diabetes aetiology. Nat Rev Genet. 2007;8:657–62. doi: 10.1038/nrg2178. [DOI] [PubMed] [Google Scholar]
- 8.Ritchie MD, Hahn LW, Roodi N, et al. Multifactor-dimensionality reduction reveals high-order interactions among estrogen-metabolism genes in sporadic breast cancer. Am J Hum Genet. 2001;69:138–47. doi: 10.1086/321276. [DOI] [PMC free article] [PubMed] [Google Scholar]
- 9.Tang X, Li N, Chen DF, Hu YH. [Recent advances in applications of multifactor dimensionality reduction for detecting gene-gene interactions]. Chinese Journal of Epidemiology. 2007;28:918–21. [in Chinese] [Google Scholar]
- 10.Lou XY, Chen GB, Yan L, et al. A generalized combinatorial approach for detecting gene-by-gene and gene-by-environment interactions with application to nicotine dependence. Am J Hum Genet. 2007;80:1125–37. doi: 10.1086/518312. [DOI] [PMC free article] [PubMed] [Google Scholar]
- 11.Puavilai G, Chanprasertyotin S, Sriphrapradaeng A. Diagnostic criteria for diabetes mellitus and other categories of glucose intolerance: 1997 criteria by the Expert Committee on the Diagnosis and Classification of Diabetes Mellitus (ADA), 1998 WHO consultation criteria, and 1985 WHO criteria. World Health Organization. Diabetes Res Clin Pract. 1999;44:21–26. doi: 10.1016/s0168-8227(99)00008-x. [DOI] [PubMed] [Google Scholar]
- 12.Writing Group of Chinese Guidelines for the Management of Hypertension. [2010 Chinese guidelines for the management of hypertension]. Chinese Journal of Cardiology. 2011;39:579–616. [in Chinese] [Google Scholar]
- 13.Nomenclature and criteria for diagnosis of ischemic heart disease. Report of the Joint International Society and Federation of Cardiology/World Health Organization task force on standardization of clinical nomenclature. Circulation. 1979;59:607–9. doi: 10.1161/01.cir.59.3.607. [DOI] [PubMed] [Google Scholar]
- 14.Fatty Liver and Alcoholic Liver Disease Study Group of the Chinese Liver Disease Association. [Diagnostic criteria of non-alcoholic fatty liver disease]. Chinese Journal of Hepatology. 2003;11:71. [in Chinese] [PubMed] [Google Scholar]
- 15.Joint committee for developing Chinese guidelines on prevention and treatment of dyslipidemia in adults. [Chinese guidelines on prevention and treatment of dyslipidemia in adults]. Chinese Journal of Cardiology. 2007;35:390–419. [in Chinese] [PubMed] [Google Scholar]
- 16.Chinese Neuroscience Society. 4th National Cerebrovascular Conference, Key points for diagnosis of cerebrovascular diseases; 1996. p. 378. [Google Scholar]
- 17.Working group of obesity in China. Guidelines for prevention and control of overweight and obesity in Chinese adults. Acta Nutrimenta Sinica. 2004;26:1–4. [Google Scholar]
- 18.Ciccone MM, Scicchitano P, Cameli M, et al. Endothelial function in pre-diabetes, diabetes and diabetic cardiomyopathy: a review. J Diabetes Metab. 2014;5:4. [Google Scholar]
- 19.Pannacciulli N, De Pergola G, Ciccone M, et al. Effect of family history of type 2 diabetes on the intima-media thickness of the common carotid artery in normal-weight, overweight, and obese glucose-tolerant young adults. Diabetes Care. 2003;26:1230–34. doi: 10.2337/diacare.26.4.1230. [DOI] [PubMed] [Google Scholar]
- 20.Ching YP, Pang AS, Lam WH, et al. Identification of a neuronal Cdk5 activator-binding protein as Cdk5 inhibitor. J Biol Chem. 2002;277:15237–40. doi: 10.1074/jbc.C200032200. [DOI] [PubMed] [Google Scholar]
- 21.Wei FY, Nagashima K, Ohshima T, et al. Cdk5-dependent regulation of glucose-stimulated insulin secretion. Nat Med. 2005;11:1104–8. doi: 10.1038/nm1299. [DOI] [PubMed] [Google Scholar]
- 22.Ubeda M, Rukstalis JM, Habener JF. Inhibition of cyclin-dependent kinase 5 activity protects pancreatic beta cells from glucotoxicity. J Biol Chem. 2006;281:28858–64. doi: 10.1074/jbc.M604690200. [DOI] [PubMed] [Google Scholar]
- 23.Wei FY, Tomizawa K. Functional loss of Cdkal1, a novel tRNA modification enzyme, causes the development of type 2 diabetes. Endocr J. 2011;58:819–25. doi: 10.1507/endocrj.ej11-0099. [DOI] [PubMed] [Google Scholar]
- 24.Stancakova A, Pihlajamaki J, Kuusisto J, et al. Single-nucleotide polymorphism rs7754840 of CDKAL1 is associated with impaired insulin secretion in nondiabetic offspring of type 2 diabetic subjects and in a large sample of men with normal glucose tolerance. J Clin Endocrinol Metab. 2008;93:1924–30. doi: 10.1210/jc.2007-2218. [DOI] [PubMed] [Google Scholar]
- 25.Zeggini E, Weedon MN, Lindgren CM, et al. Replication of genome-wide association signals in UK samples reveals risk loci for type 2 diabetes. Science. 2007;316:1336–41. doi: 10.1126/science.1142364. [DOI] [PMC free article] [PubMed] [Google Scholar]
- 26.Han X, Luo Y, Ren Q, et al. Implication of genetic variants near SLC30A8, HHEX, CDKAL1, CDKN2A/B, IGF2BP2, FTO, TCF2, KCNQ1, and WFS1 in type 2 diabetes in a Chinese population. BMC Med Genet. 2010;11:81. doi: 10.1186/1471-2350-11-81. [DOI] [PMC free article] [PubMed] [Google Scholar]
- 27.Moritani M, Yamasaki S, Kagami M, et al. Hypoplasia of endocrine and exocrine pancreas in homozygous transgenic TGF-beta1. Mol Cell Endocrinol. 2005;229:175–84. doi: 10.1016/j.mce.2004.08.007. [DOI] [PubMed] [Google Scholar]
- 28.Krishnamurthy J, Ramsey MR, Ligon KL, et al. p16INK4a induces an age-dependent decline in islet regenerative potential. Nature. 2006;443:453–57. doi: 10.1038/nature05092. [DOI] [PubMed] [Google Scholar]
- 29.Qian Y, Lu F, Dong M, et al. Cumulative effect and predictive value of genetic variants associated with type 2 diabetes in Han Chinese: a case-control study. PLoS One. 2015;10:e0116537. doi: 10.1371/journal.pone.0116537. [DOI] [PMC free article] [PubMed] [Google Scholar]
- 30.Chen G, Xu Y, Lin Y, et al. Association study of genetic variants of 17 diabetes-related genes/loci and cardiovascular risk and diabetic nephropathy in the Chinese She population. J Diabetes. 2013;5:136–45. doi: 10.1111/1753-0407.12025. [DOI] [PubMed] [Google Scholar]
- 31.Gamboa-Melendez MA, Huerta-Chagoya A, Moreno-Macias H, et al. Contribution of common genetic variation to the risk of type 2 diabetes in the Mexican Mestizo population. Diabetes. 2012;61:3314–21. doi: 10.2337/db11-0550. [DOI] [PMC free article] [PubMed] [Google Scholar]
- 32.Wen J, Ronn T, Olsson A, et al. Investigation of type 2 diabetes risk alleles support CDKN2A/B, CDKAL1, and TCF7L2 as susceptibility genes in a Han Chinese cohort. PLoS One. 2010;5:e9153. doi: 10.1371/journal.pone.0009153. [DOI] [PMC free article] [PubMed] [Google Scholar]
- 33.Hu C, Zhang R, Wang C, et al. PPARG, KCNJ11, CDKAL1, CDKN2A-CDKN2B, IDE-KIF11-HHEX, IGF2BP2 and SLC30A8 are associated with type 2 diabetes in a Chinese population. PLoS One. 2009;4:e7643. doi: 10.1371/journal.pone.0007643. [DOI] [PMC free article] [PubMed] [Google Scholar]
- 34.Takeuchi F, Serizawa M, Yamamoto K, et al. Confirmation of multiple risk loci and genetic impacts by a genome-wide association study of type 2 diabetes in the Japanese population. Diabetes. 2009;58:1690–99. doi: 10.2337/db08-1494. [DOI] [PMC free article] [PubMed] [Google Scholar]
- 35.Lee YH, Kang ES, Kim SH, et al. Association between polymorphisms in SLC30A8, HHEX, CDKN2A/B, IGF2BP2, FTO, WFS1, CDKAL1, KCNQ1 and type 2 diabetes in the Korean population. J Hum Genet. 2008;53:991–98. doi: 10.1007/s10038-008-0341-8. [DOI] [PubMed] [Google Scholar]
- 36.Cauchi S, Meyre D, Durand E, et al. Post genome-wide association studies of novel genes associated with type 2 diabetes show gene-gene interaction and high predictive value. PLoS One. 2008;3:e2031. doi: 10.1371/journal.pone.0002031. [DOI] [PMC free article] [PubMed] [Google Scholar]
- 37.Herder C, Rathmann W, Strassburger K, et al. Variants of the PPARG, IGF2BP2, CDKAL1, HHEX, and TCF7L2 genes confer risk of type 2 diabetes independently of BMI in the German KORA studies. Horm Metab Res. 2008;40:722–26. doi: 10.1055/s-2008-1078730. [DOI] [PubMed] [Google Scholar]
- 38.Hubáček JA, Neškudla T, Klementová M, et al. Tagging rs10811661 variant at CDKN2A/2B locus is not associated with type 2 diabetes mellitus in Czech population. Folia Biol (Praha) 2013;59:168–71. [PubMed] [Google Scholar]
- 39.Nemr R, Almawi AW, Echtay A, et al. Replication study of common variants in CDKAL1 and CDKN2A/2B genes associated with type 2 diabetes in Lebanese Arab population. Diabetes Res Clin Pract. 2012;95:e37–40. doi: 10.1016/j.diabres.2011.11.002. [DOI] [PubMed] [Google Scholar]
- 40.Jin L, Xu L, Song X, Wei Q, et al. Genetic variation in MDM2 and p14ARF and susceptibility to salivary gland carcinoma. PLoS One. 2012;7:e49361. doi: 10.1371/journal.pone.0049361. [DOI] [PMC free article] [PubMed] [Google Scholar]
- 41.Maccioni L, Rachakonda PS, Bermejo JL, et al. Variants at the 9p21 locus and melanoma risk. BMC Cancer. 2013;13:325. doi: 10.1186/1471-2407-13-325. [DOI] [PMC free article] [PubMed] [Google Scholar]
- 42.Chansaenroj J, Theamboonlers A, Junyangdikul P, et al. Polymorphisms in TP53 (rs1042522), p16 (rs11515 and rs3088440) and NQO1 (rs1800566) genes in Thai cervical cancer patients with HPV 16 infection. Asian Pac J Cancer Prev. 2013;14:341–46. doi: 10.7314/apjcp.2013.14.1.341. [DOI] [PubMed] [Google Scholar]
- 43.Zhang F, Xu L, Wei Q, et al. Significance of MDM2 and P14 ARF polymorphisms in susceptibility to differentiated thyroid carcinoma. Surgery. 2013;153:711–17. doi: 10.1016/j.surg.2012.11.009. [DOI] [PMC free article] [PubMed] [Google Scholar]
- 44.Frayling TM, Timpson NJ, Weedon MN, et al. A common variant in the FTO gene is associated with body mass index and predisposes to childhood and adult obesity. Science. 2007;316:889–94. doi: 10.1126/science.1141634. [DOI] [PMC free article] [PubMed] [Google Scholar]
- 45.Fawcett KA, Barroso I. The genetics of obesity: FTO leads the way. Trends Genet. 2010;26:266–74. doi: 10.1016/j.tig.2010.02.006. [DOI] [PMC free article] [PubMed] [Google Scholar]
- 46.Gerken T, Girard CA, Tung YC, et al. The obesity-associated FTO gene encodes a 2-oxoglutarate-dependent nucleic acid demethylase. Science. 2007;318:1469–72. doi: 10.1126/science.1151710. [DOI] [PMC free article] [PubMed] [Google Scholar]
- 47.Andreasen CH, Stender-Petersen KL, Mogensen MS, et al. Low physical activity accentuates the effect of the FTO rs9939609 polymorphism on body fat accumulation. Diabetes. 2008;57:95–101. doi: 10.2337/db07-0910. [DOI] [PubMed] [Google Scholar]
- 48.Scott LJ, Mohlke KL, Bonnycastle LL, et al. A genome-wide association study of type 2 diabetes in Finns detects multiple susceptibility variants. Science. 2007;316:1341–45. doi: 10.1126/science.1142382. [DOI] [PMC free article] [PubMed] [Google Scholar]
- 49.Tan JT, Dorajoo R, Seielstad M, et al. FTO variants are associated with obesity in the Chinese and Malay populations in Singapore. Diabetes. 2008;57:2851–57. doi: 10.2337/db08-0214. [DOI] [PMC free article] [PubMed] [Google Scholar]
- 50.Yajnik CS, Janipalli CS, Bhaskar S, et al. FTO gene variants are strongly associated with type 2 diabetes in South Asian Indians. Diabetologia. 2009;52:247–52. doi: 10.1007/s00125-008-1186-6. [DOI] [PMC free article] [PubMed] [Google Scholar]
- 51.Hertel JK, Johansson S, Sonestedt E, et al. FTO, type 2 diabetes, and weight gain throughout adult life: a meta-analysis of 41,504 subjects from the Scandinavian HUNT, MDC, and MPP studies. Diabetes. 2011;60:1637–44. doi: 10.2337/db10-1340. [DOI] [PMC free article] [PubMed] [Google Scholar]
- 52.Horikoshi M, Hara K, Ito C, et al. Variations in the HHEX gene are associated with increased risk of type 2 diabetes in the Japanese population. Diabetologia. 2007;50:2461–66. doi: 10.1007/s00125-007-0827-5. [DOI] [PubMed] [Google Scholar]
- 53.Qian Y, Liu S, Lu F, et al. Genetic variant in fat mass and obesity-associated gene associated with type 2 diabetes risk in Han Chinese. BMC Genet. 2013;14:86. doi: 10.1186/1471-2156-14-86. [DOI] [PMC free article] [PubMed] [Google Scholar]