SUMMARY
The extent to which low-frequency (minor allele frequency [MAF] between 1–5%) and rare (MAF ≤ 1%) variants contribute to complex traits and disease in the general population is largely unknown. Bone mineral density (BMD) is highly heritable, is a major predictor of osteoporotic fractures and has been previously associated with common genetic variants1–8, and rare, population-specific, coding variants9. Here we identify novel non-coding genetic variants with large effects on BMD (ntotal = 53,236) and fracture (ntotal = 508,253) in individuals of European ancestry from the general population. Associations for BMD were derived from whole-genome sequencing (n=2,882 from UK10K), whole-exome sequencing (n= 3,549), deep imputation of genotyped samples using a combined UK10K/1000Genomes reference panel (n=26,534), and de-novo replication genotyping (n= 20,271). We identified a low-frequency non-coding variant near a novel locus, EN1, with an effect size 4-fold larger than the mean of previously reported common variants for lumbar spine BMD8 (rs11692564[T], MAF = 1.7%, replication effect size = +0.20 standard deviations [SD], Pmeta = 2×10⁻¹⁴), which was also associated with a decreased risk of fracture (OR = 0.85; P = 2×10⁻¹¹; ncases = 98,742 and ncontrols = 409,511). Using an En1Cre/flox mouse model, we observed that conditional loss of En1 results in low bone mass, likely as a consequence of high bone turn-over. We also identified a novel low-frequency non-coding variant with large effects on BMD near WNT16 (rs148771817[T], MAF = 1.1%, replication effect size = +0.39 SD, Pmeta = 1×10⁻¹¹). In general, there was an excess of association signals arising from deleterious coding and conserved non-coding variants. These findings provide evidence that low-frequency non-coding variants have large effects on BMD and fracture, thereby providing rationale for whole-genome sequencing and improved imputation reference panels to study the genetic architecture of complex traits and disease in the general population.
Recently, genetic discoveries have generally focused on common variants of small effect and rare coding variants identified through GWAS and whole-exome sequencing initiatives, respectively10,11. The effect of low-frequency and rare non-coding variants upon common diseases, and their underlying traits has been recently explored in an isolated population12,13, but has not been well-studied to date in the general population. The UK10K has generated a large whole-genome sequence-based resource to address this question in a general European-ancestry population, which is 10-fold larger than the European subset of the 1000 Genomes Project reference14.
Osteoporosis, diagnosed largely through measurement of bone mineral density (BMD), is a common systemic skeletal disease characterized by an increased propensity to fracture15. The narrow-sense heritability of BMD has been estimated to be ~85%, and genome-wide association studies (GWAS) have successfully identified numerous loci associated with BMD which in total explain ~5% of the genetic variance for this trait16. However, these studies have been largely unable to assess the role of low frequency (MAF 1–5%) and rare (MAF ≤ 1%) genetic variation, since their methods relied on testing common variants (MAF ≥ 5%). A recent sequencing-based study identified a rare nonsense variant associated with BMD using 4,931 Icelandic subjects with low BMD and 69,034 population-based controls9. This coding variant, which disrupts the function of LGR4, appears to be confined to the Icelandic population.
To investigate the role of rare and low-frequency genetic variation on BMD the general population of European descent, we first undertook whole genome sequencing in 2,882 subjects from two cohorts in the UK10K project and whole-exome sequencing in 3,549 subjects from five cohorts (Supplementary Table 1) with BMD phenotypes. We then used a novel imputation reference panel generated by the UK10K and 1000Genomes consortia to impute variants that were missing, or poorly captured, from previous GWAS studies in 26,534 subjects (Supplementary Table 1 and Extended Data Fig. 1a). The UK10K and 1000Genomes reference panel, which in total contained 3,781 and 379 European individuals with whole genome sequences from UK10K and 1000Genomes Projects, respectively, enabled improved imputation, particularly of low frequency variants, when compared to the 1000Genomes reference panel alone17. We then undertook de-novo replication genotyping of lead variants in 13 cohorts for BMD, comprising 20,271 individuals of European descent.
We meta-analyzed association results from all discovery cohorts (ntotal = 32,965, Supplementary Table 1) for BMD measured at the forearm, femoral neck and lumbar spine, the sites where osteoporotic fractures are most prevalent. We tested bi-allelic single-nucleotide variants (SNVs) with MAF ≥ 0.5% for association, declaring genome-wide statistical significance at P ≤ 1.2 × 10⁻⁸ (accounting for all independent SNVs above this MAF threshold; Supplementary Methods)18. The sequence kernel association test (SKAT) was used to assess association of regions containing SNVs with MAF ≤ 5% and ≤ 1%. All summary-level meta-analytic results are available for unrestricted download (www.gefos.org). Novel genome-wide significant loci were then tested for their relationship with fracture in up to 508,253 individuals. Finally, functional genomics as well as cellular and animal models were utilized to investigate the relevance of these novel genetic associations to bone physiology.
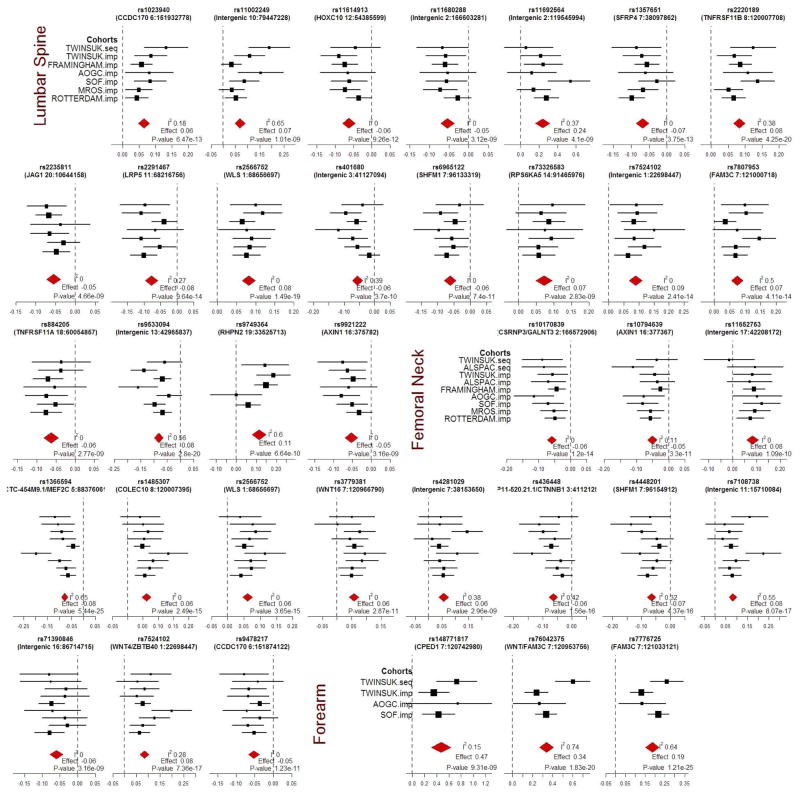
Through meta-analysis of sequenced and imputed single-SNV association tests from the discovery cohorts (Supplementary Table 1), we identified a novel locus at 2q14.2 harboring variants associated with lumbar spine BMD (lead low-frequency SNV rs11692564[T], MAF = 1.7%, effect size = +0.24 SD, P = 4×10⁻⁹, Fig. 1 and Table 1). The direction of effect was consistent across all discovery cohorts (Extended Data Fig. 2) and the mean imputation information score for the imputed cohorts was 0.71 (Supplementary Table 3). This variant is located 53 kilobase pairs downstream from engrailed homeobox-1 (EN1), which, to our knowledge, has not previously been associated with any osteoporosis-related traits in humans. The rs11692564 variant was not present on HapMap imputation panels, nor on genotyping chips, underlining the importance of developing more comprehensive imputation reference panels.
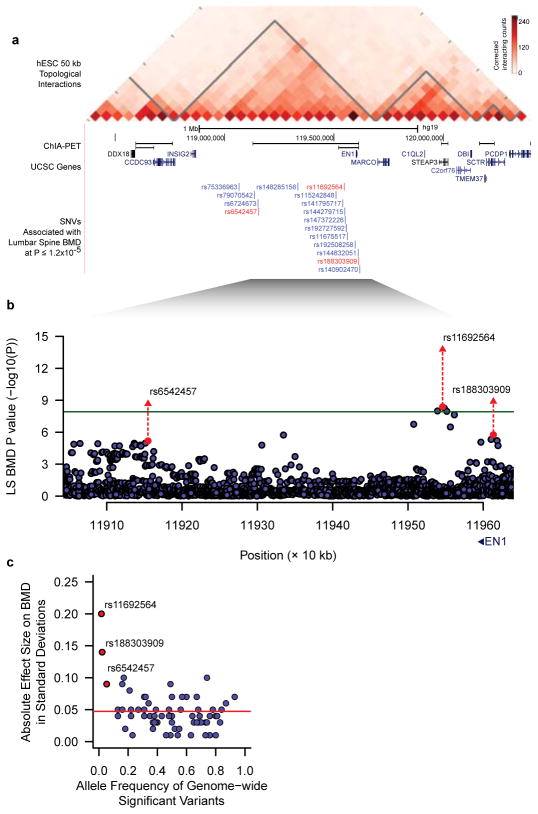
Figure 1. Association signals near Engrailed-1 for lumbar spine BMD.
a, A topological domain includes associated variants and EN1, and chromatin interaction analysis with paired-end tag sequencing (ChIA-PET for CTCF in MCF-7 cell line) suggests a smaller interacting region containing EN1, and three genome-wide significant variants for lumbar spine BMD (in red).
b, Association signals at the EN1 locus (green line at P = 1.2×10⁻⁸) for lumbar spine BMD. Red circles and triangles represent results from discovery and combined discovery and replication using fixed-effects meta-analysis (see Supplementary Information), respectively.
c, Allele frequency versus absolute effect size for lumbar spine BMD for previously identified variants (blue)8 and the three EN1 novel variants (red). The blue line denotes the mean of previously reported effect sizes.
Table 1.
Novel Variants from Single-SNV Association Tests
| Locus | BMD Phenotype | SNP | Effect Allele | Discovery Meta-Analysis
|
Replication Meta-Analysis
|
Combined Meta-analysis
|
||||||||||
|---|---|---|---|---|---|---|---|---|---|---|---|---|---|---|---|---|
| N | β | P | I2 | N | β | P | I2 | Freq. | N | β | P | I2 | ||||
| EN1 | Lumbar Spine | rs11692564 | T | 25,225 | 0.24 | 4.1×10⁻⁹ | 0.37 | 15,291 | 0.20 | 2.8×10⁻⁶ | 0.46 | 0.016 | 40,516 | 0.22 | 1.7×10⁻¹⁴ | 0.40 |
| Lumbar Spine | rs188303909 | T | 25,225 | 0.18 | 1.7×10⁻⁶ | 0.36 | 15,228 | 0.14 | 3.3×10⁻⁴ | 0.13 | 0.019 | 40,453 | 0.16 | 1.3×10⁻⁹ | 0.21 | |
| Lumbar Spine | rs6542457 | C | 25,225 | 0.08 | 6.5×10⁻⁶ | 0.00 | 15,240 | 0.09 | 1.5×10⁻⁴ | 0.00 | 0.058 | 40,465 | 0.09 | 2.2×10⁻⁹ | 0.00 | |
| Femoral Neck | rs55983207 | C | 29,188 | 0.10 | 2.5×10⁻⁷ | 0.19 | 16,248 | 0.17 | 9.8×10⁻¹⁰ | 0.03 | 0.042 | 45,436 | 0.12 | 7.2×10⁻¹⁵ | 0.23 | |
| SOX6 | Femoral Neck | rs11024028 | G | 29,188 | 0.06 | 2.2×10⁻⁸ | 0.00 | 15,397 | 0.03 | 2.6×10⁻² | 0.30 | 0.198 | 44,585 | 0.05 | 1.3×10⁻⁹ | 0.04 |
| WNT16 | Forearm | rs148771817 | T | 7,848 | 0.47 | 9.3×10⁻⁹ | 0.15 | 2,539 | 0.41 | 5.5×10⁻⁴ | - | 0.012 | 10,387 | 0.46 | 1.1×10⁻¹¹ | 0.00 |
β is the additive effect of the Effect Allele and is measured in standard deviations of bone mineral density
To validate whole-genome sequencing genotypes at rs11692564, we genotyped 1,853 whole-genome sequenced subjects, and found all genotypes to be perfectly concordant (Supplementary Table 4). We validated imputation of rs11692564 in 3,601 imputed subjects through direct genotyping and observed that the association strengthened, and its statistical significance improved, as compared to imputed results (lumbar spine: imputed effect size = 0.22 SD; P = 0.05, genotyped effect size = 0.31 SD; P = 0.004) (Supplementary Table 6). We next sought additional evidence for the association at rs11692564 by performing additional de novo genotyping in 16,233 independent individuals and found a similarly large effect size in this population (effect size = +0.20 SD; P = 3×10⁻⁶). Meta-analysis of the discovery and replication cohorts provided strong evidence for association (Pcombined-meta = 2×10⁻¹⁴) (Table 1).
We also identified an additional association signal, arising from rs55983207 (MAF = 4%), 17 kb downstream of rs11692564 (r2 = 0.001) to be associated with femoral neck BMD from the combined meta-analysis (Pmeta = 7.2 × 10⁻¹⁵ Table 1). A haplotype containing both effect alleles was not observed from within the UK10K whole genome-sequenced cohort (total number of haplotypes = 7,562).
In addition to rs11692564, we also observed two additional novel genome-wide significant variants for lumbar spine BMD near EN1, rs6542457 (MAF = 6.7%) and rs188303909 (MAF = 1.9%), which are 391kb downstream and 67kb upstream from rs11692564, respectively (Fig. 1b and Table 1). Variant rs188303909 was in moderate LD with rs11692564 (r2 = 0.47), and conditional analysis demonstrated that these two association signals were not independent (Supplementary Table 7). On the other hand, rs6542457 was in low LD with rs11692564 (r2 = 0.002), and remained independent in conditional analyses (Supplementary Table 7). Overall, the EN1 locus harbors multiple non-coding variants associated with lumbar spine and a single variant associated with femoral neck BMD. All three genome-wide significant variants for lumbar spine BMD (Table 1) co-localize solely with EN1 in a sub-region of high interaction frequency within a single topologically-associated domain19 (Fig. 1a).
The mean effect size of previously reported genome-wide significant SNPs (MAF ≥ 5%) from the largest GWAS meta-analysis to date for lumbar spine and femoral BMD was 0.048 SD and the largest effect size was 0.1 SD8. Hence, the observed effect size at rs11692564 is 4-fold larger than this mean and twice that of the largest previously reported effect (Figure 1c)8. For all genome-wide significant variants, we observed larger effect sizes across decreasing MAF bins (Fig. 2a).
Figure 2. Genome-wide features of association signals.
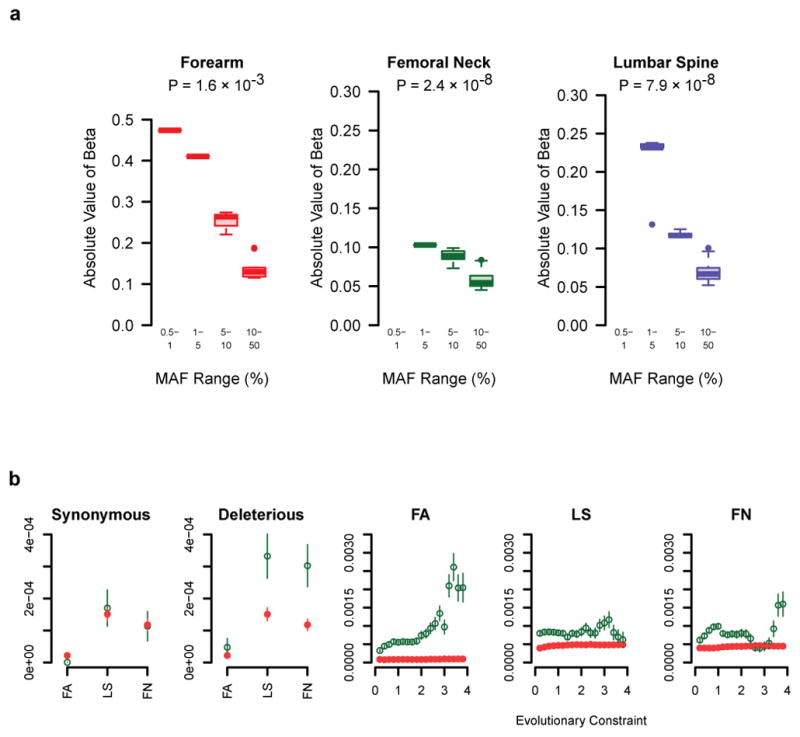
a, Box plots of the effect sizes of genome-wide significant SNVs (P < 1.2×10⁻⁸), pruned for LD (r2 < 0.2) by MAF bin for discovery cohorts. Grey bars represent the values of beta not observed and for which we lack statistical power to observe (at α ≤ 1.2×10⁻⁸ and power ≥ 0.8). P-values per phenotype are from the non-parametric trend test across MAF bins (see Supplementary Information).
b, Proportion of SNVs passing an FDR q-value 0.05 across different annotation features in discovery cohorts (green) vs. matched control variants (red). The rightmost three panels show enrichment across a range of evolutionary constraint scores, where green denotes SNVs above the threshold and red denotes variants below the threshold. Bars represent standard error (for methods refer to Supplementary Information).
An increase in BMD is associated with a decrease in risk of bone fracture. We therefore tested the association of rs11692564[T] (the low-frequency allele at EN1 associated with the largest increase in BMD) in 18 cohorts comprising 508,253 individuals (98,742 cases and 409,511 controls, Supplementary Table 8). rs11692564[T] was strongly associated with a decreased risk of fracture (OR = 0.85 [95% CI: 0.80–0.89]; P = 2.0×10⁻¹¹; I2 = 0.00) (Table 2 and Supplementary Table 9). Table 2 also shows clear associations between other variants near EN1 and risk of fracture. The fracture association at rs11692564 was 2.9-fold larger than the mean of fracture associations detected in the largest GWAS to date, and 2.0-fold larger than the largest previously identified fracture association8.
Table 2.
Fracture meta-analysis of EN1 variants
| Locus | SNP | Effect Allele | Effect Allele Freq. | OR [95% CI] | P | N Cases | N Controls | I2 |
|---|---|---|---|---|---|---|---|---|
| EN1 | rs11692564 | T | 0.02 | 0.85 [080–0.89] | 2.0 × 10⁻¹¹ | 98,742 | 409,511 | 0.00 |
| rs188303909 | T | 0.03 | 0.89 [0.85–0.93] | 9.8 × 10⁻⁷ | 95,669 | 405,697 | 0.00 | |
| rs55983207 | C | 0.05 | 0.93 [0.90–0.96] | 5.4 × 10⁻⁶ | 97,651 | 407,487 | 0.20 | |
| rs6542457 | C | 0.06 | 0.98 [0.95–1] | 1.2 × 10⁻¹ | 95,669 | 405,697 | 0.17 |
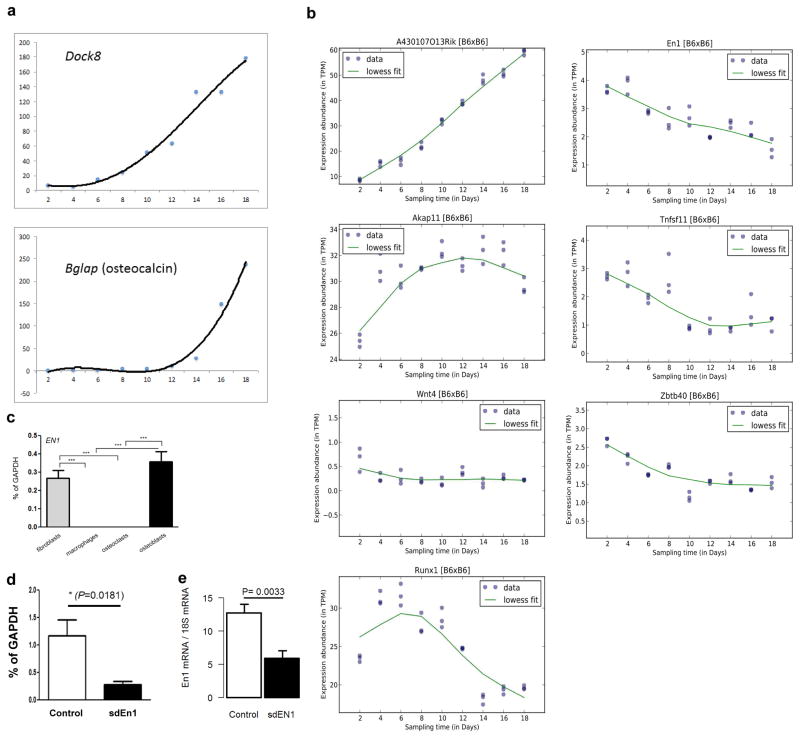
EN1 encodes a homeobox gene central to mouse limb development20, which has been shown to be involved in Wnt signaling interaction with Dkk121. Studies of calvarial bone development and fracture healing of long bones in mice have shown that perinatal En1−/− mutants display osteopenia and enhanced skull bone resorption22, whereas in normal adult mice En1 is up-regulated in the bone callus post fracture22. Investigating the functional role of EN1, we detected En1 expression during osteoblastogenesis in developing and mature cultured murine calvarial osteoblasts, but not in marrow-derived osteoclasts, or in human primary osteoclast cultures (Figure 3a and Extended Data Fig. 3). To determine where En1 is active in adult bones, we analyzed vertebrae from En1lacZ/+ knock-in mice23 and detected LacZ expression in proliferative and hypertrophic chondrocytes, osteogenic cells in the periosteum and trabecular bone surface, and in osteocytes of cortical and trabecular bone (Fig. 3b and Extended Data Fig. 4).
Figure 3. Mouse En1 Functional Experiments.
a, Left: Quantitative expression of En1 and its temporal pattern (RNA-seq) in cultured calvarial murine osteoblasts (n=3 per time point). Right: Confirmation of the expression of En1 in a separate RT-PCR experiment of cultured calvarial murine osteoblasts and lack of expression in osteoclasts matured from bone marrow derived precursor cells (Positive controls for osteoblasts (osteocalcin) and osteoclast (RANK) are also shown).
b, Representative sections from lumbar vertebra 2 show the growth plate and bone marrow (GP and BM, left), cortical bone (CB, middle), and trabecular bone (TB, right) at 40x magnification from En1lacZ/+ adult mice (n = 2) stained for β-gal activity (LacZ blue, En1+ cells) and alkaline phosphatase (AP, red late chondrocytes and actively calcifying tissues). In the periosteum (PO), all the LacZ+ cells were AP+; some AP- BM cells expressed LacZ. Some AP- proliferative chondrocytes in the GP expressed lacZ+, whereas most AP+ hypertrophic chondrocytes expressed LacZ. Some AP- osteocytes (Ocy) in CB and TB were LacZ+.
c, Left: Histomorphometry images of lumbar vertebrae 5 show decreased trabecular bone volume and increased bone surface area occupied by osteoclast cells when comparing En1Cre/flox (self-deleted En1, sdEn1) mutants and En1flox/+ control mice. Right: Reconstructed μCT images show the mineral density in a control and an sdEn1 animal (right panels).
d, Micro-CT (μCT) and histomorphometry measures within sdEn1 (n = 5) and controls (En1lox/+, n = 6). By μCT, sdEn1 mutants exhibit decreased L5 trabecular number (Tb.N) and thickness (Tb.Th), as well as deceased bone volume fraction (BV/TV). Using histomorphometry, sdEn1 mutants exhibit increased osteoclastic area (TRAP/BS). Average for each measure denoted by solid horizontal line. P-value computed using paired t-test.
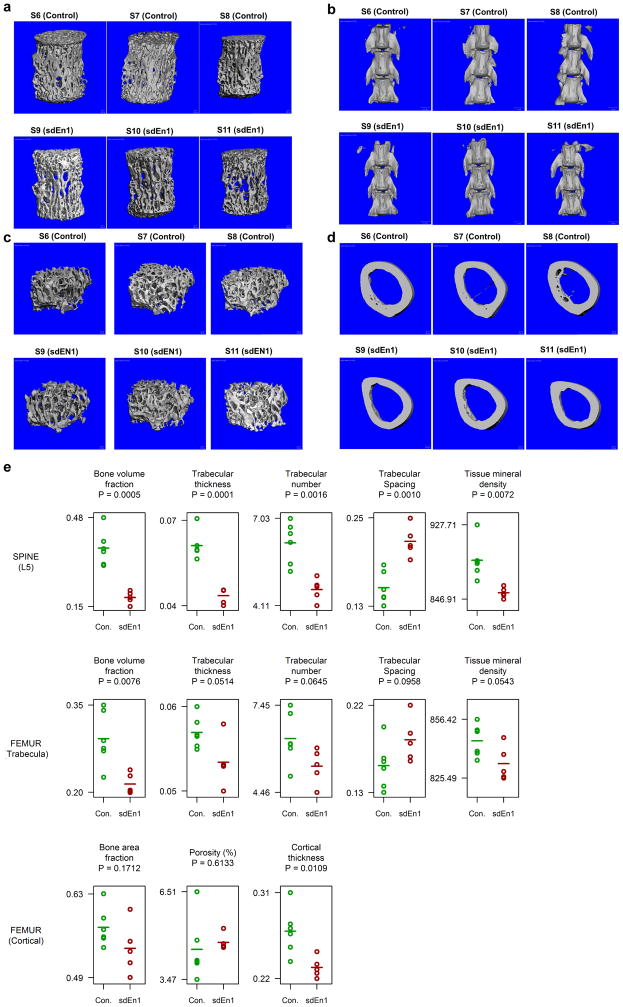
Using En1Cre/+; R26lox-STOP-lox--EYFP reporter mice to genetically tag cells for which the En1 promoter was active at any point within a cell lineage, we confirmed that En1 expression was only observed in osteogenic lineages (Extended Data Fig. 4). Since most En1−/− animals die soon after birth, we generated En1Cre/flox self-deleted En1 (sdEn1) conditional mutants24 (n = 5) and demonstrated by μCT that mutants have lower trabecular bone volume fraction (BV/TV), trabecular number, and trabecular thickness in both the lumbar L5 vertebrae (Fig. 3c and 3d and Extended Data Fig. 5) and the femur (Extended Fig. 5) as compared to littermate controls (n = 6). A decrease in femoral cortical thickness was also observed (Extended Fig. 5). By histomorphometry (Fig. 3c), we observed that the sdEn1 mice had a statistically higher proportion of osteogenic and osteoclastic cells compared to littermate controls (Fig. 3d and Supplementary Table 10). The driving force for the low bone mass would appear to be an increase in osteoclastic activity induced by En1 null osteogenic cells. This in turn initiates the expected coupled increase in mineralizing bone formation (Fig. 3b & 3d) mediated by an increased number of osteogenic cells and thus conforms to a high turnover osteoporosis-like phenotype, although dynamic histomorphometry and evidence from bone turn-over markers would be required to confirm an increased rate of bone formation (Extended Data Fig. 4). Lastly, genetic evidence from homologous regions in mice also supported a role for En1 in bone, as the homologous region contained a QTL peak for femur BMD (Supplementary Table 11)25. These findings, together with an earlier study focusing on En1 function in calvarial bone development22 implicate this gene as an important mediator in skeletal biology.
Taken together, these findings suggest that EN1 plays an important role in bone physiology and that low-frequency non-coding variants mapping near EN1 have large effects on BMD and risk of fracture in the general European population.
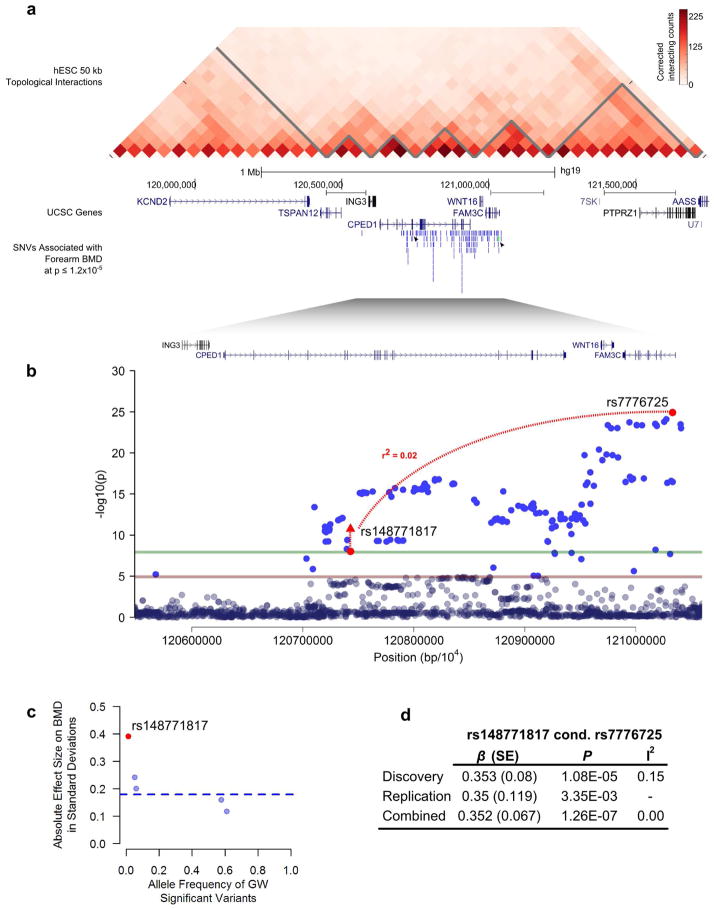
We also identified a novel SNV at 7q31.31 within the intron of CPED1 (rs148771817[T], MAF = 1.2%, effect size = +0.47 SD, Pdiscovery= 9.31 × 10⁻⁹) associated with forearm BMD (Table 1, Supplementary Table 12, and Extended Data Fig. 6). We replicated the association at rs148771817 in 2,539 independent individuals and found a similar effect size (effect size = +0.41 SD, P = 6×10⁻⁴), and combined meta-analysis of the discovery and replication cohorts further improved statistical evidence for association (+0.46 SD, P = 1×10⁻¹¹) (Table 1). This variant had an effect size 2.2-fold larger than the mean of previously reported effects for common variants associated with forearm BMD (Extended Data Fig. 6)26.
We previously identified rs7776725 to be associated with BMD at WNT16, a gene neighboring CPED1, (Extended Data Fig. 6) and demonstrated that knock-out of Wnt16 in mice confers a 50% decrease in bone strength (P = 7×10⁻¹³)26,27. We have recently shown that osteoblast-derived Wnt16 represses osteoclastogenesis28. As a result, we undertook conditional analysis of rs148771817 upon rs7776725. The rs148771817 variant remained associated after conditioning, albeit with lower statistical significance (effect size =0.35 SD; Pmeta=1×10⁻⁷; Extended Data Fig. 6d). Similarly, conditional analysis of the common variant upon rs148771817 revealed little change in the effect size or the statistical significance (Supplementary Table 7). While we acknowledge that both variants may be causal, our data does not permit us to distinguish if one or both of these variants have distinct biologic effects.
While rs148771817 is intronic in CPED1, we found that DNA accessibility at this region, as measured by DNase I hypersensitivity data from ENCODE, was moderately correlated with DNA accessibility at the WNT16 promoter in 305 cell types24 (maximum r2= 0.4, P= 2.2 × 10⁻¹⁵, Supplementary Table 13), whereas correlation to the promoter of CPED1 was lower (maximum r2 = 0.1, P = 0.06). Moreover, analysis of chromosome conformation capture Hi-C interaction frequencies from human H1 embryonic stem cells shows elevated interaction frequency between rs148771817 and WNT16 (Extended Data Fig. 6), though we also observed stronger interactions between these loci and their immediate neighboring regions.
We assessed whether association signals were enriched for deleterious coding SNVs or SNVs with increased evolutionary constraint (see Supplementary Methods). These two groups of SNVs were matched to control SNVs by MAF and distance to gene (Supplementary Methods and Supplementary Table 14), followed by LD pruning (r2 < 0.2). We observed enrichment of association signal across the spectrum of positive evolutionary constraint thresholds, which was comparable to deleterious coding variants (Fig. 2b).
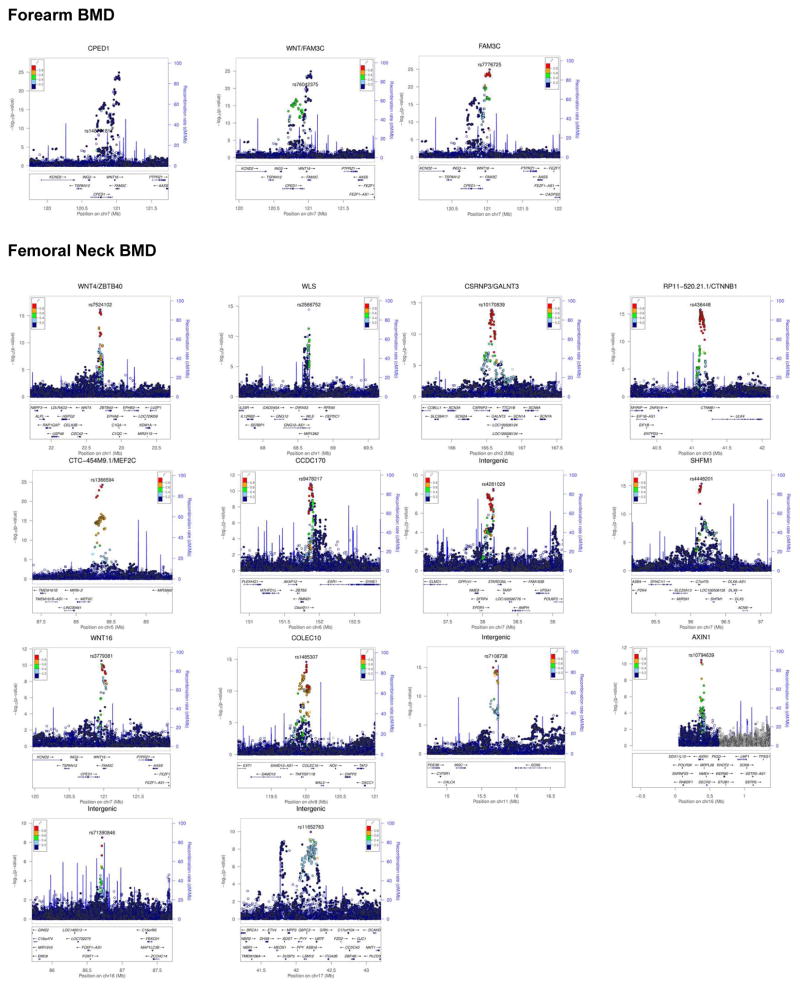
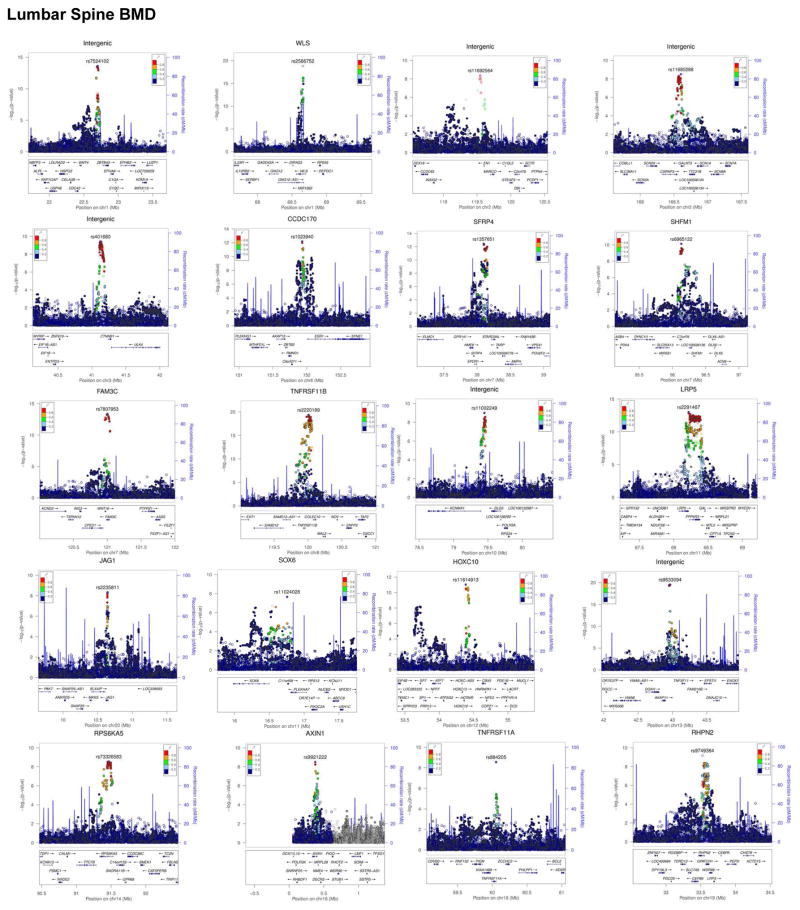
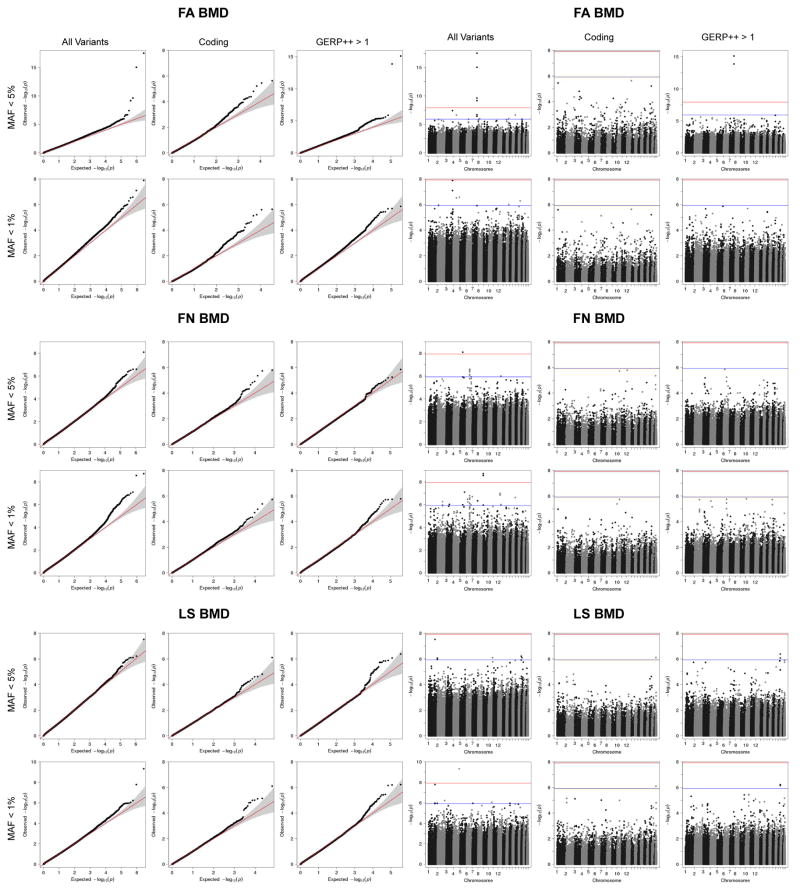
In total, we have identified multiple variants associated with BMD, including 3 genome-wide significant loci for forearm BMD, 14 for femoral neck and 19 for lumbar spine (Supplementary Tables 12 and 16–18, and Extended Data Figures 7 and 8). A common variant not on previous HapMap imputation panels, near the SOX6 gene was also identified (rs11024028, MAF = 19%) (Table 1), and was found to be an independent signal from a previously reported signal at this locus (rs7108738, r2 = 0.002)8. Consistent with recent experience29,30, region-based collapsing methods did not identify any convincing novel associations that were not already identified as genome-wide significant through single SNV associations. This included collapsing variants below 1% and 5% MAF thresholds, including all variants, only variants with increased GERP++ scores or those from protein-coding regions (Supplementary Table 19 and Extended Data Figures 9 & 10).
We have identified low-frequency, non-coding genetic variants of large effect that are present in the general population and associate with BMD and fracture. These variants have effect sizes up to four-fold larger than the mean effect described for common variants associated with BMD and approximately three-fold larger than those for fracture. Our study illustrates that larger reference panels, covering relevant ethnicities, will facilitate the discovery of low frequency and rare variants. This was enabled here by a large imputation reference panel (UK10K and 1000 Genomes) which offers 10-fold more European samples than the 1000 Genomes reference panel alone. Although we did not identify coding low-frequency or rare variants associated with BMD at a genome-wide significant level, we did observe that deleterious coding variants were enriched for association as a group. This suggests the existence of as yet undiscovered coding variants influencing BMD. Importantly, we have also generated new functional evidence for a central role of the engrailed homeobox-1 gene in regulation of BMD and outlined En1 as a critical protein in bone biology. In summary, our findings demonstrate the utility of whole-genome sequencing-based discovery and deep imputation to enable the identification of novel genetic associations. These discoveries provide an improved understanding of the pathophysiology of osteoporosis and suggest that more comprehensive sets of whole-genome sequenced individuals, covering relevant ethnicities, will enable accurate imputation and thus facilitate discovery of low frequency and rare variants influencing complex traits and common disease.
METHODS
More details for Methods can be found in the Supplementary Information. All human studies were approved by their institutional ethics review committees, and all participants provided written informed consent.
Whole-Genome Sequencing
ALSPAC and TwinsUK cohorts were sequenced at an average read depth of 6.7x through the UK10K program (www.UK10K.org) using the Illumina HiSeq platform, and aligned to the GRCh37 human reference using BWA31. SNV calls were completed using samtools/bcftools and VQSR and GATK were used to recall these calls.
Whole-Exome Sequencing
The AOGC, FHS, RS-I, ESP and ERF cohorts were whole-exome sequenced as described in the Supplementary Information.
Whole-Genome Genotyping
All remaining discovery cohorts were genome-wide genotyped and imputed to the UK10K/1000 Genomes reference panel, as described in the Supplementary Information.
Association testing for BMD
Single variants with a MAF >0.5% were tested for an additive effect on lumbar spine, femoral neck and forearm BMD, adjusting for sex, age, age2, weight and standardized to have a mean of zero and a standard deviation of one. Meta-analysis of cohort-level summary statistics was undertaken using GWAMA32. Conditional analyses for significant SNVs was performed using GCTA33. Region-based collapsing tests were performed using skatMeta34, an implementation of the SKAT method35 that enables the meta-analysis of multiple cohorts. For each cohort, variants with MAF ≤5% or ≤1% were collected and meta-analysis using skatMeta was conducted for windows of 30 SNVs within each region, overlapping by 10 SNVs.
Replication Genotyping
Lead SNVs were selected for replication genotyping, which was performed at LGC Genomics, using KASP genotyping. Association testing for replication genotyping was undertaken using the same additive model, using the same covariates for BMD, as above.
Fracture Association Testing
Fractures were defined as those occurring at any site, except fingers, toes and skull, after age 18. Both incident and prevalent fractures were included and were verified by either radiographic, casting, physician, or subject reporting. Fractures resulting from any type of trauma were considered. Covariates included in the additive model were age, age2, sex, height, weight, estogen/menopause status (when available), ancestral genetic background and cohort-specific covariates (such as clinical centre). Association testing was done in two phases. The first involved all 1,482 genome-wide significant SNVs for BMD. In the second phase of fracture association testing, variants at EN1 were assessed in 18 cohorts, comprising 98,467 cases and 409,736 controls. Meta-analysis of cohort-level summary statistics was performed using GWAMA32.
Functional Genomics
We tested whether variants with increasing GERP++ scores36 were more strongly associated with BMD than SNVs matched for distance to gene and MAF, after LD pruning using PLINK37 at an r2 of <0.2, using windows of 100kb and step of 20kb. Coding variants were partitioned as deleterious using Variant Effect Predictor 38 LD pruned (r2 <0.2). The proportion of variants passing an FDR q-value of ≤0.05 were reported.
En1 Murine Expression Experiments
Pre-osteoblast-like cell were differentiated to osteoblasts from calvaria of C57BL/6J mice and expression levels of each gene was quantified using RNAseq. The temporal expression of En1 in cell culture experiments of these osteoblasts and bone marrow derived osteoclasts (isolated from long bones of six week old mice) was measured by PCR, with Bglap (osteocalcin) and Tnfrsf11a (RANK), serving as controls. Further, total mRNA for En1 in osteoblasts was quantified using real-time PCR.
Murine Histology
Two month old En1 old En1lacZ/+ mice 39 were sectioned at bone sites and stained for X-gal and/or alkaline phosphatase and imaged at 400x.
Micro-CT and histomorphometry
Bone characteristics of self-deleted conditional En1(sdEn1) mutants were compared to En1+/flox littermates using Micro-CT. The same animals were assessed for histomorphometry (and labs performing Micro-CT and histomorphometry were blinded to each other’s results). After tissue sectioning, samples were stained for calcification (calcein blue), tartrate acid (TRAP) to assess for osteoclasts and alkaline phosphatase to assess for osteoblasts.
Extended Data
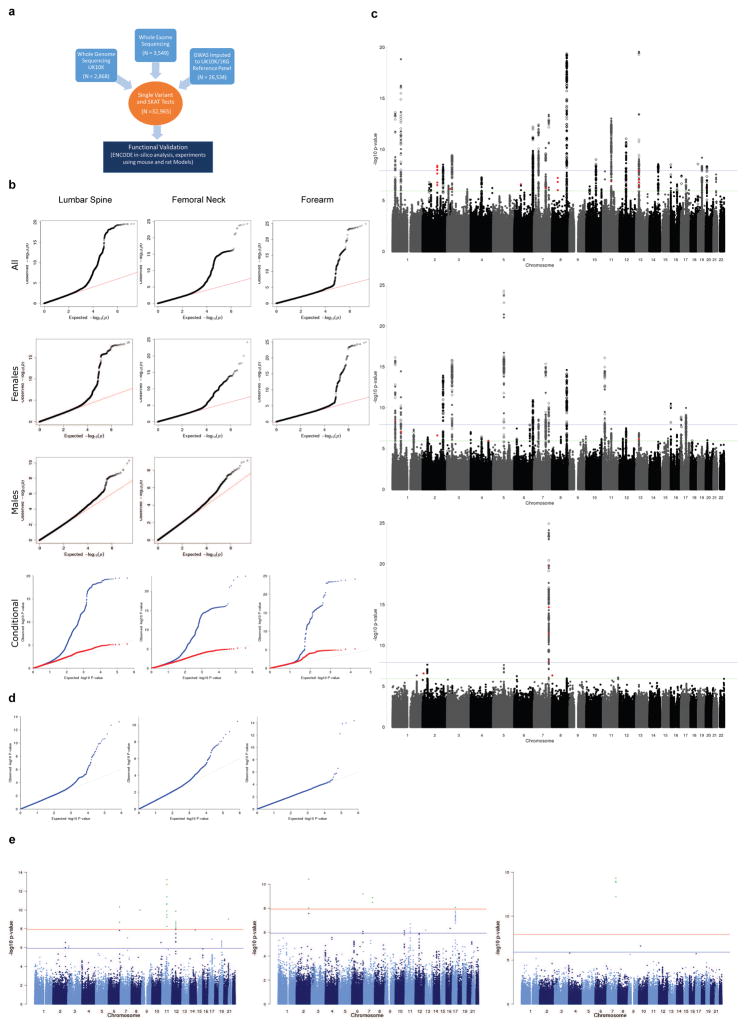
Extended Data Figure 1. Discovery single variant meta-analysis.
a. Overall study design b. From top to bottom, quantile-quantile plots for the sex-combined single SNV meta-analysis, sex-stratified single SNV meta-analysis (forearm phenotype consists solely of female-only cohorts), and sex-combined single SNV conditional meta-analysis. Plots depicts p-values prior (blue) and after conditional analysis (red). c. From top to bottom, Manhattan plots for sex-combined meta-analysis for lumbar spine BMD, femoral neck BMD, and forearm BMD. Each plot depicts variants from the UK10K/1KG reference panel with MAF > 0.5% across the 22 autosomes (odd=grey, even=black) against the –log10 p-value from the meta-analysis of 7 cohorts (dots). Also depicted is the subset variants from the reference panel that are also present in Estrada et al. (2012) with p value < 5e-6 (diamonds). Variants with MAF < 5% and p < 1.2e-6 are also depicted (red). d. Quantile-Quantile plots for the sex-combined meta-analysis of lumbar spine, femoral neck, and forearm BMD for SNVs present across both exome-sequenced and genome-wide cohorts i.e. SNV absent from all exome-sequenced cohort are not shown. e. Manhattan plot for the Meta-Analysis of Sex-Combined results for Lumbar Spine BMD for SNVs present in exome-sequenced and genome-wide cohorts i.e. SNV absent from all exome-sequenced cohort are not shown (from top to bottom: lumbar spine, forearm and femoral neck BMD).
Extended Data Figure 2. Forest Plots by Cohort for Genome-wide Significant Loci from Discovery Meta-analysis.
Forest plots for three BMD phenotypes are shown. Title of each plot includes gene overlapping the SNV and its genomic position on build hg19. P-values are from fixed-effect meta-analysis (see Supplemental Information).
Extended Data Figure 3. Gene Expression in Human and Mouse.
a. Quantification of Dock8 expression and its temporal pattern through RNA-seq in cultured calvarial murine osteoblasts across day 2 through to day 18 of osteoblast development. Bglap is shown for comparison, which encodes osteocalcin a critical protein in osteoblasts. b. Quantification of expression of genome-wide significant genes and their temporal pattern through RNA-seq in cultured calvarial murine osteoblasts across day 2 through to day 18 of osteoblast development. c. Expression of EN1 mRNA in human cells presented as percent of GAPDH mRNA. d. Expression of En1 in control and sdEn1 mice in purified osteoblast culture. For osteoblast marker gene expression, total mRNAs were purified from osteoblast cultures at day 10 and measured using quantitative real-time PCR. mRNA levels were normalized relative to GAPDH mRNA. e. Real-time PCR expression of control and sdEn1 as compared to 18S mRNA in whole vertebral bone extract. All data are shown as mean± SEM. Significance computed by student unpaired t-test.
Extended Data Figure 4. Histological Assessment of En1Cre–expressing cells in in skeletal cells of the vertebra.
a. Lineage history of En1Cre–expressing cells in skeletal cells of the vertebra. The En1Cre allele was combined with the R26LSL-YFP reporter allele and examined using frozen fluorescent immunohistochemistry and alkaline phosphatase (AP) staining. Cell nuclei were detected with DAPI. YFP-expressing cells have expressed CRE (En1) at some time in their history. A. Control animals lacking the R26LSL-YFP reporter show low background YFP signal (green). B. In En1Cre/+; R26LSL-YFP/+ mice YFP-expressing cells are detected in the growth plate chondrocytes of the vertebra (*), trabecular bone lining cells (arrow) and osteocytes (arrow head). Note, high fluorescent background staining in the marrow space. C. The same section is shown stained for AP activity using the fast red substrate. Strong activity is present in the hypertrophic chondrocytes of the growth plate and trabecular bone lining cells (arrow). D. Alignment of the AP and YFP images shows that the trabecular lining cells co-express AP and YFP. b. Colocalization of En1 and Alkaline Phosphatase expression. Images of lumbar vertebrae sections (growth plate and trabecular bone regions, 40x) from two-month old En1lacZ/+ mice. (see Figure 3b), stained for LacZ and Alkaline phosphatase (AP), false-coloured as indicated. Double-positive cells are indicated by arrows, while single-positive cells are indicated by arrowheads (LacZ+) or asterisks (AP+). Except for some chondrocytes, most AP+ cells are also LacZ+, i.e. express En1. The bone marrow was digitally removed, as it contains no AP+ cells.
Extended Data Figure 5. MicroCT Results for control (En1flox/+) and self-deleting En1 knockout (sdEn1, En1Cre/flox) animals.
a. Trabecular Bone MicroCT images from Lumbar Vertebra 5. b. Morphological characteristics at lumbar vertebra 4,5, and 6 (from bottom to top). c. Morphological characteristics of left femur trabecular bone and d. left femur cortical bone. e. MicroCT parameter results for the comparison of control type and sdEn1 animals at lumbar vertebra 5, femur trabecula, and femur cortical bone. Horizontal lines denote mean of observations. Significance between control and sdEn1 is calculated using an unpaired t-test.
Extended Data Figure 6. Novel association from 7q31.3.
a. Chromatin interaction data from Hi-C performed in H1 ES cells23 of a 2 Mb region encompassing rs148771817 (red and identified by arrow) and WNT16. b. The left axis denotes the association P-value (red and green lines at P = 1.2 × 10⁻⁵ and 1.2 × 10⁻⁸, respectively). The novel genome-wide significant SNV, rs148771817, within an intron of CPED1, and the lead genome wide-significant SNV rs7776725 upstream to WNT16 (within FAM3C) are in low LD with each other. c. Allele frequency versus absolute effect size (in standard deviations) for forearm BMD of all previously identified genome-wide significant variants (blue)8 and the novel variant within CPED1 (red), rs148771817 from replication meta-analysis. The blue line denotes the mean of effect sizes for previously reported forearm BMD variants. d. Meta-analysis summary statistics of rs148771817 conditioned on rs7776725.
Extended Data Figure 7. Regional Plots of Genome-Wide Significant Loci from Single-SNV Association Tests for forearm and femoral neck BMD.
Each regional plot depicts SNVs within 1 Mb of a locus’ lead SNV (x-axis) and their associated meta-analysis p value (-log10). SNVs are color coded according to r2 with the lead SNV (labelled, r2 calculated from UK10K whole genome sequencing dataset). Recombination rate (blue line), and the position of genes, their exons and the direction of transcription are also displayed (below plot).
Extended Data Figure 8. Regional Plots of Genome-Wide Significant Loci from Single-SNV Association Tests from Lumbar Spine BMD.
Each regional plot depicts SNVs within 1 Mb of a locus’ lead SNV (x-axis) and their associated meta-analysis p value (-log10). SNVs are color coded according to r2 with the lead SNV (labelled, r2 calculated from UK10K whole genome sequencing dataset). Recombination rate (blue line), and the position of genes, their exons and the direction of transcription are also displayed (below plot).
Extended Data Figure 9. Region-based association tests using skatMeta for windows of 30 SNVs and window step of 20 SNVs.
a. From top to bottom, quantile-quantile plots for forearm BMD (FA), femoral neck BMD (FN), and lumbar spine (LS) BMD. For each MAF range considered (<5% or <1%), analysis was conducted across all variants, variant overlapping coding exons, and variants with GERP++ score > 1. b. From top to bottom, Manhattan plots forearm BMD, femoral neck BMD, and lumbar spine BMD. For each MAF range considered (<5% or <1%), analysis was conducted across all variants, variant overlapping coding exons, and variants with GERP++ score > 1. Blue and red lines at genome-wide suggestive [P = 1.2 × 10⁻⁶] and genome-wide significant [P = 1.2 × 10⁻⁸] thresholds, respectively.
Extended Data Figure 10. Single Variant Analysis of Signals from Region-based Tests.
a. Drop-one SNV and drop-one cohort for genome-wide significant 30 SNV windows for forearm BMD from skatMeta analysis. (A, B) For given 30 SNV window, the –log10(p) of skatMeta test for 29 SNVs, excluding (i.e. dropping) the SNV at position labeled on x-axis. (C, D) For given 30 SNV window, the –log10(p) of skatMeta test for 4 cohorts, excluding (i.e. dropping) cohort labeled on x-axis. b. Drop-one SNV and drop-one cohort for genome-wide significant 30 SNV windows for femoral neck BMD for skatMeta analysis. (A) For given 30 SNV window, the –log10(p) of skatMeta test for 29 SNVs, excluding (i.e. dropping) the SNV at position labeled on x-axis. (B) For given 30 SNV window, the –log10(p) of skatMeta test for 4 cohorts, excluding (i.e. dropping) cohort labeled on x-axis. c. Regional view of CPED1/WNT16 locus for forearm BMD. In top panel, significant SNVs from single variant meta-analysis (rs148771817 and rs79162867, in blue) overlap significant regions found using region-based test (red bars).
Supplementary Material
Acknowledgments
Full acknowledgements are listed in Supplementary Information.
Footnotes
Author Contribution
Principal Investigators: AH, AJ, AU, AX-A, BL, CA-B, ChC, CL, ClC, CLD, CO, DanE, DGa, DGo, DGr, DH, DKi, DM, ED, EO, FRi, FRo, GDS, J BR, JD, JRe, JRi, J-TK, JTu, KA, LAC, LL, LPGMdG, MB, NS, NvdV, NvS, PR, RD, RDJ, RL P, ScW, SHR, TH, TP, TS, UP-K, VG, XN, Y-HH.
Genotyping: AOGC-Consortium, AU, AX-A, BM, BW, CL, CN, CO, CW, DC, DGr, ED, E O, FRi, GG, GTr, JEr, JJvM, JRe, JRi, J-TK, JvR, MB, MCF, MJ, MZ, NA, NG-G, NS, PAr, PD, PR, RK, SHR, SM, SR, UP-K, XN, Y-HH.
Phenotyping:AE, AH, AL, AOGC-Consortium, APH, AU, AX-A, BM, CG, CK, CL, CLD, CO, DGo, DKa, DKi, DM, ED, EN, EO, FEM, FK, FRi, FRo, GH, JB, JC, JEi, JO, JRe, JRi, J-T K, JTo, KE, KS, KT, LO, LR, LV, MB, MCF, MCZ, MK, MZ, NA, NS, OL, OS, RLP, ScW, SG, SHR, SK, TN, TS, UP-K.
Functional-Experiments:AJ, AR-D, Bge, CA-B, CH, CL, CLD, CO, CU, DGa, DP, EG, H YP-M, JD, JF, KCh, MaM, MH, NS, OS, SB, SC, S-HC, StW, TK, TP, UP-K, WC, XJ.
Data-analysis:AE, AK, AS, AVS, BM, CA-B, ChC, C-HC, CK, CL, CLD, CM-G, CMTG, C O, CTL, CW, DanE, DaveE, DC, DKa, DM, DP, ED, EG, EN, FG, FRi, GH, GTh, H-FZ, JBR, J D, JEr, JF, JHa, JHu, JK, JvR, KCh, KE, KW, LAC, LH, LM, LO, LR, LV, MB, MC, MH, MK, N A, NS, OL, PAu, PD, PL, RL, SB, SC, ScW, SK, UP, UP-K, VF, W-CC, Y-HH, YM, YZ.
Meta-analysis: H-FZ, VF, Y-HH.
Lead Analyst: H-FZ, VF.
Wrote first draft: JBR.
Author Information BMD discovery meta-analysis results are available from www.gefos.org. Information pertaining to UK10K can be obtained from www.uk10k.org. Reprints and permissions information is available at www.nature.com/reprints. Authors from deCODE Genetics are employees of deCODE Genetics. Authors from 23andMe are employees of 23andMe. Remaining authors declare no competing financial interests. Readers are welcome to comment on the online version of the paper.
Code Availability: Source code used in preparation of results is available at https://github.com/richardslab/gefos.seq/.
Supplementary Information is linked to the online version of the paper at www.nature.com/nature.
References
- 1.Richards JB, Rivadeneira F, Inouye M, et al. Bone mineral density, osteoporosis, and osteoporotic fractures: a genome-wide association study. Lancet. 2008;371(9623):1505–1512. doi: 10.1016/S0140-6736(08)60599-1. [DOI] [PMC free article] [PubMed] [Google Scholar]
- 2.Styrkarsdottir U, Halldorsson BV, Gretarsdottir S, et al. Multiple genetic loci for bone mineral density and fractures. N Engl J Med. 2008;358(22):2355–2365. doi: 10.1056/NEJMoa0801197. NEJMoa0801197 [pii]\r. [DOI] [PubMed] [Google Scholar]
- 3.Styrkarsdottir U, Halldorsson BV, Gretarsdottir S, et al. New sequence variants associated with bone mineral density. Nat Genet. 2008;41(1):15–17. doi: 10.1038/ng.284. [DOI] [PubMed] [Google Scholar]
- 4.Rivadeneira F, Styrkársdottir U, Estrada K, et al. Twenty bone-mineral-density loci identified by large-scale meta-analysis of genome-wide association studies. Nat Genet. 2009;41(11):1199–1206. doi: 10.1038/ng.446. [DOI] [PMC free article] [PubMed] [Google Scholar]
- 5.Duncan EL, Danoy P, Kemp JP, et al. Genome-wide association study using extreme truncate selection identifies novel genes affecting bone mineral density and fracture risk. PLoS Genet. 2011;7(4):e1001372. doi: 10.1371/journal.pgen.1001372. [DOI] [PMC free article] [PubMed] [Google Scholar]
- 6.Koller DL, Ichikawa S, Lai D, et al. Genome-wide association study of bone mineral density in premenopausal European-American women and replication in African-American women. J Clin Endocrinol Metab. 2010;95(4):1802–1809. doi: 10.1210/jc.2009-1903. [DOI] [PMC free article] [PubMed] [Google Scholar]
- 7.Xiong D-HH, Liu X-GG, Guo Y-FF, et al. Genome-wide Association and Follow-Up Replication Studies Identified ADAMTS18 and TGFBR3 as Bone Mass Candidate Genes in Different Ethnic Groups. Am J Hum Genet. 2009;84(3):388–398. doi: 10.1016/j.ajhg.2009.01.025. [DOI] [PMC free article] [PubMed] [Google Scholar]
- 8.Estrada K, Styrkarsdottir U, Evangelou E, et al. Genome-wide meta-analysis identifies 56 bone mineral density loci and reveals 14 loci associated with risk of fracture. 2012 doi: 10.1038/ng.2249. [DOI] [PMC free article] [PubMed] [Google Scholar]
- 9.Styrkarsdottir U, Thorleifsson G, Sulem P, et al. Nonsense mutation in the LGR4 gene is associated with several human diseases and other traits. Nature. 2013;497(7450):517–520. doi: 10.1038/nature12124. [DOI] [PubMed] [Google Scholar]
- 10.Hindorff La, Sethupathy P, Junkins Ha, et al. Potential etiologic and functional implications of genome-wide association loci for human diseases and traits. Proc Natl Acad Sci U S A. 2009;106(23):9362–9367. doi: 10.1073/pnas.0903103106. [DOI] [PMC free article] [PubMed] [Google Scholar]
- 11.Kiezun A, Garimella K, Do R, et al. Exome sequencing and the genetic basis of complex traits. Nat Genet. 2012;44(6):623–630. doi: 10.1038/ng.2303. [DOI] [PMC free article] [PubMed] [Google Scholar]
- 12.Gudbjartsson DF, Helgason H, Gudjonsson Sa, et al. Large-scale whole-genome sequencing of the Icelandic population. 2015 doi: 10.1038/ng.3247. [DOI] [PubMed] [Google Scholar]
- 13.Sulem P, Helgason H, Oddson A, et al. Identification of a large set of rare complete human knockouts. 2015 Apr; doi: 10.1038/ng.3243. 2014. [DOI] [PubMed] [Google Scholar]
- 14.Abecasis GR, Auton A, Brooks LD, et al. An integrated map of genetic variation from 1,092 human genomes. Nature. 2012;491(7422):56–65. doi: 10.1038/nature11632. [DOI] [PMC free article] [PubMed] [Google Scholar]
- 15.Kanis JA. Diagnosis of osteoporosis. Osteoporos Int. 1997;7(Suppl 3):S108–16. doi: 10.1007/BF03194355. [DOI] [PubMed] [Google Scholar]
- 16.Richards JB, Zheng H-F, Spector TD. Genetics of osteoporosis from genome-wide association studies: advances and challenges. Nat Rev Genet. 2012;13(AUGUST):672–672. doi: 10.1038/nrg3315. [DOI] [PubMed] [Google Scholar]
- 17.Huang J, Howie B, Marchini J. Imputation Performance of 4,000 genomes from the UK10K Project. American Society of Human Genetics Annual Meeting; 2013. [Google Scholar]
- 18.Xu C, Tachmazidou I, Walter K, Ciampi A, Zeggini E, Greenwood CMT. Estimating Genome-Wide Significance for Whole-Genome Sequencing Studies. Genet Epidemiol. 2014 doi: 10.1002/gepi.21797. n/a-n/a. [DOI] [PMC free article] [PubMed] [Google Scholar]
- 19.Dixon JR, Selvaraj S, Yue F, et al. Topological domains in mammalian genomes identified by analysis of chromatin interactions. Nature. 2012;485(7398):376–80. doi: 10.1038/nature11082. [DOI] [PMC free article] [PubMed] [Google Scholar]
- 20.Loomis CA, Harris E, Michaud J, Wurst W, Hanks M, Joyner AL. The mouse Engrailed-1 gene and ventral limb patterning. Nature. 1996;382(6589):360–363. doi: 10.1038/382360a0. [DOI] [PubMed] [Google Scholar]
- 21.Adamska M, MacDonald BT, Sarmast ZH, Oliver ER, Meisler MH. En1 and Wnt7a interact with Dkk1 during limb development in the mouse. Dev Biol. 2004;272(1):134–144. doi: 10.1016/j.ydbio.2004.04.026. [DOI] [PubMed] [Google Scholar]
- 22.Deckelbaum Ra, Majithia A, Booker T, Henderson JE, Loomis Ca. The homeoprotein engrailed 1 has pleiotropic functions in calvarial intramembranous bone formation and remodeling. Development. 2006;133(1):63–74. doi: 10.1242/dev.02171. [DOI] [PubMed] [Google Scholar]
- 23.Matise MP, Joynera L. Expression patterns of developmental control genes in normal and Engrailed-1 mutant mouse spinal cord reveal early diversity in developing interneurons. J Neurosci. 1997;17(20):7805–7816. doi: 10.1523/JNEUROSCI.17-20-07805.1997. [DOI] [PMC free article] [PubMed] [Google Scholar]
- 24.Sgaier SK, Lao Z, Villanueva MP, et al. Genetic subdivision of the tectum and cerebellum into functionally related regions based on differential sensitivity to engrailed proteins. Development. 2007;134(12):2325–35. doi: 10.1242/dev.000620. [DOI] [PMC free article] [PubMed] [Google Scholar]
- 25.Ackert-Bicknell CL, Karasik D, Li Q, et al. Mouse BMD quantitative trait loci show improved concordance with human genome-wide association loci when recalculated on a new, common mouse genetic map. J Bone Miner Res. 2010;25(8):1808–1820. doi: 10.1002/jbmr.72. [DOI] [PMC free article] [PubMed] [Google Scholar]
- 26.Zheng H-FF, Tobias JH, Duncan E, et al. WNT16 Influences Bone Mineral Density, Cortical Bone Thickness, Bone Strength, and Osteoporotic Fracture Risk. PLoS Genet. 2012;8(7):e1002745. doi: 10.1371/journal.pgen.1002745. [DOI] [PMC free article] [PubMed] [Google Scholar]
- 27.Medina-Gomez C, Kemp JP, Estrada K, et al. Meta-Analysis of Genome-Wide Scans for Total Body BMD in Children and Adults Reveals Allelic Heterogeneity and Age-Specific Effects at the WNT16 Locus. PLoS Genet. 2012;8(7):e1002718. doi: 10.1371/journal.pgen.1002718. [DOI] [PMC free article] [PubMed] [Google Scholar]
- 28.Movérare-Skrtic S, Henning P, Liu X, et al. Osteoblast-derived WNT16 represses osteoclastogenesis and prevents cortical bone fragility fractures. Nat Med. 2014;20(11):1279–1288. doi: 10.1038/nm.3654. [DOI] [PMC free article] [PubMed] [Google Scholar]
- 29.Ladouceur M, Dastani Z, Aulchenko YS, Greenwood CMT, Richards JB. The Empirical Power of Rare Variant Association Methods: Results from Sanger Sequencing in 1,998 Individuals. PLoS Genet. 2012;8(2):e1002496. doi: 10.1371/journal.pgen.1002496. [DOI] [PMC free article] [PubMed] [Google Scholar]
- 30.Tang H, Jin X, Li Y, et al. A large-scale screen for coding variants predisposing to psoriasis. Nat Genet. 2014;46(1):45–50. doi: 10.1038/ng.2827. [DOI] [PubMed] [Google Scholar]
- 31.Li H, Durbin R. Fast and accurate short read alignment with Burrows-Wheeler transform. Bioinformatics. 2009;25(14):1754–1760. doi: 10.1093/bioinformatics/btp324. [DOI] [PMC free article] [PubMed] [Google Scholar]
- 32.Mägi R, Morris AP. GWAMA: software for genome-wide association meta-analysis. BMC Bioinformatics. 2010;11(ii):288. doi: 10.1186/1471-2105-11-288. [DOI] [PMC free article] [PubMed] [Google Scholar]
- 33.Yang J, Ferreira T, Morris AP, et al. Conditional and joint multiple-SNP analysis of GWAS summary statistics identifies additional variants influencing complex traits. Nat Genet. 2012;44(4):369–75. S1–3. doi: 10.1038/ng.2213. [DOI] [PMC free article] [PubMed] [Google Scholar]
- 34.Voorman AA, Brody J, Lumley T. Package “skatMeta”. 2013. [Google Scholar]
- 35.Wu MC, Lee S, Cai T, Li Y, Boehnke M, Lin X. Rare-variant association testing for sequencing data with the sequence kernel association test. Am J Hum Genet. 2011;89(1):82–93. doi: 10.1016/j.ajhg.2011.05.029. [DOI] [PMC free article] [PubMed] [Google Scholar]
- 36.Davydov EV, Goode DL, Sirota M, Cooper GM, Sidow A, Batzoglou S. Identifying a high fraction of the human genome to be under selective constraint using GERP++ PLoS Comput Biol. 2010;6(12):e1001025. doi: 10.1371/journal.pcbi.1001025. [DOI] [PMC free article] [PubMed] [Google Scholar]
- 37.Chang CC, Chow CC, Tellier LC, Vattikuti S, Purcell SM, Lee JJ. Second-generation PLINK: rising to the challenge of larger and richer datasets. Gigascience. 2015;4(1):7. doi: 10.1186/s13742-015-0047-8. [DOI] [PMC free article] [PubMed] [Google Scholar]
- 38.McLaren W, Pritchard B, Rios D, Chen Y, Flicek P, Cunningham F. Deriving the consequences of genomic variants with the Ensembl API and SNP Effect Predictor. Bioinformatics. 2010;26(16):2069–2070. doi: 10.1093/bioinformatics/btq330. [DOI] [PMC free article] [PubMed] [Google Scholar]
- 39.Hanks M, Wurst W, Anson-Cartwright L, Auerbacha B, Joynera L. Rescue of the En-1 mutant phenotype by replacement of En-1 with En-2. Science. 1995;269(5224):679–682. doi: 10.1126/science.7624797. [DOI] [PubMed] [Google Scholar]
Associated Data
This section collects any data citations, data availability statements, or supplementary materials included in this article.


