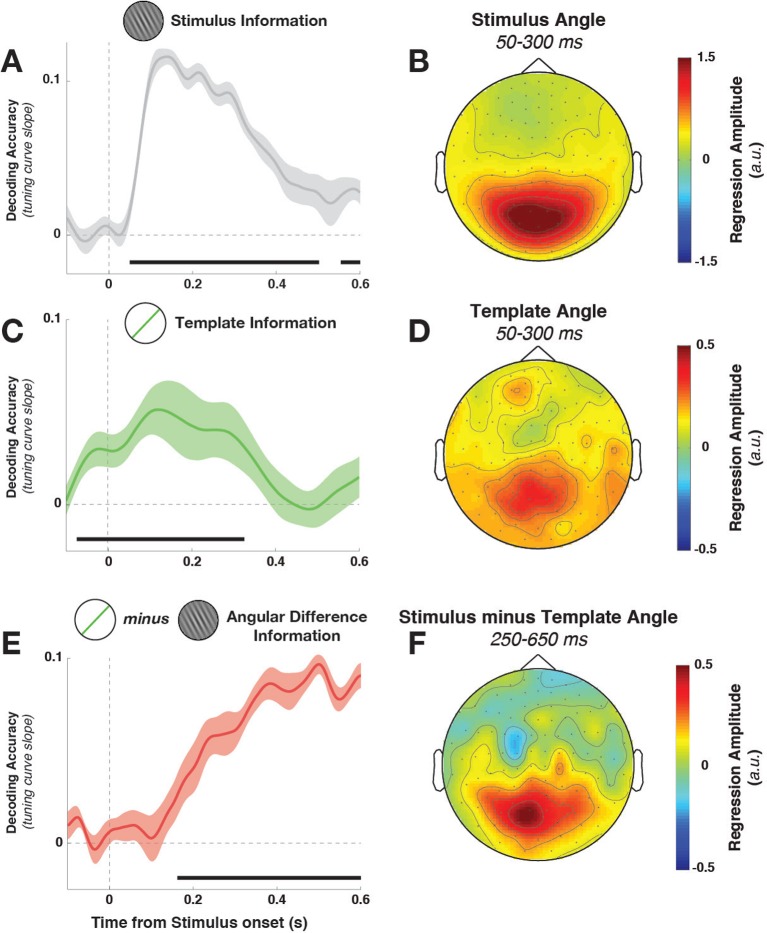
Figure 3. Task variable representation using population tuning curves (see Figure 2).
(A) Stimulus orientation was represented in the early visual response. We fit weights (using linear regression of stimulus orientation on the neural response) using all trials in all training blocks and estimated virtual channel responses in the test block. Orientation-specific coding was estimated by calculating the linear slope of the tuning curve (between 0° and 90°). Consistent positive slopes indicate orientation selectivity at a given time point. Shading indicates between-subject standard error of the mean. Black bars denote significant time points (cluster-corrected). (B) Univariate sensitivity for stimulus orientation, calculated at each sensor and time point. Topography shows the shuffle-corrected orientation sensitivity (z-scored against a distribution generated from permuting stimulus orientations 1000 times), averaged across sensor triplets (two orthogonal planar gradiometers and one magnetometer) and across the stimulus-decoding window. Color coding denotes the z-score, averaged across observers. (C) Tuning curve slope and topography (D) for template orientation sensitivity. E and F show the same analyses, sorting trials by the angular distance between template and stimulus (i.e., the decision value).

