. 2015 Dec 16;4:e11620. doi: 10.7554/eLife.11620

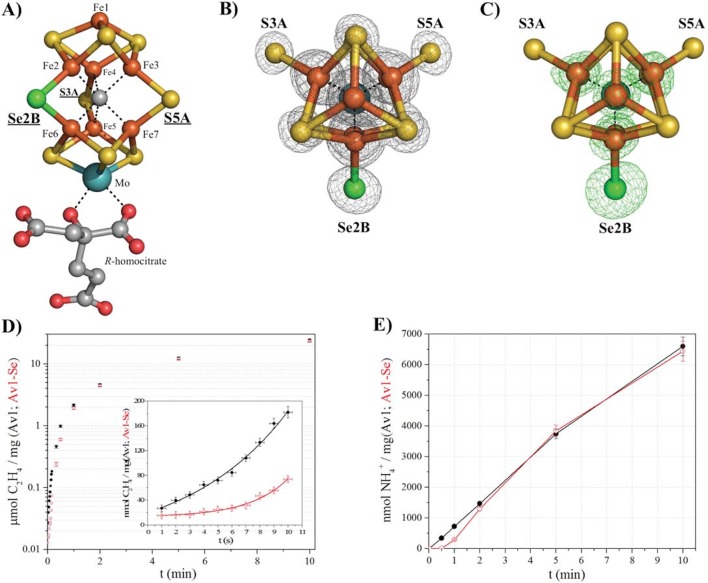
Figure 1. Selective Se-incorporation into the active site of the MoFe-protein.

(A) Side view of FeMoSe-cofactor ([7Fe:8S:1Se:Mo:C]-R-homocitrate) in Av1-Se2B at a resolution of 1.60 Å, highlighting the S2B replacement by Se. (B) View along the Fe1-C-Mo axis. The electron density (2Fo-Fc) map is contoured at 5.0 σ and represented as grey mesh. The 2Fo-Fc density at the Se2B site is significantly increased compared to the S5A and S3A sites. (C) Same orientation as B) superimposed with the anomalous difference Fourier map calculated at 12,662 eV (green) at a resolution of 1.60 Å contoured at 5.0 σ showing the presence of anomalous electron density arising from Se. Fe atoms are shown in orange, S in yellow, Se in green, Mo in turquoise, C in grey, and O in red. (D) Acetylene reduction activity of Av1 (black) compared to Av-Se (red). (E) Ammonia formation from reduction of the natural substrate, N2, was determined for Av1 (black) and Av1-Se (red). Error bars represent standard deviations from three measurements.

DOI: http://dx.doi.org/10.7554/eLife.11620.003

Figure 1—source data 1. Numerical data for the graphs depicted in Figure 1D and 1E.
DOI: 10.7554/eLife.11620.004
Figure 1—source data 2. Numerical data for the graphs depicted in Figure 1—figure supplement 1.
DOI: 10.7554/eLife.11620.005
Figure 1—source data 3. Numerical data for the graphs depicted in Figure 1—figure supplement 2.
DOI: 10.7554/eLife.11620.006
Figure 1—source data 4. Numerical data for the graphs depicted in Figure 1—figure supplement 3.
DOI: 10.7554/eLife.11620.007

Figure 1.

Figure 1—figure supplement 1. CH4 production based on KSeCN and KSCN as substrates.
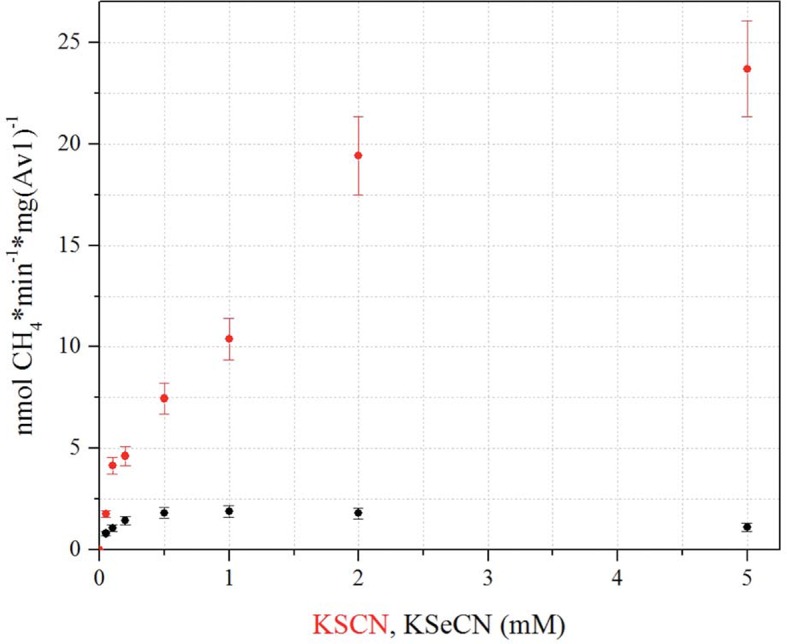
Figure 1—figure supplement 1.

Methane production was determined based on 0.05, 0.1, 0.2, 0.5, 1, 2, 5 mM KSCN (red) or KSeCN (black) as substrates. Maximum CH4 production from KSeCN was obtained at a concentration of 1 mM, whereas CH4 production from KSCN does not reach maximum within the tested range. Error bars represent standard deviations from three measurements.

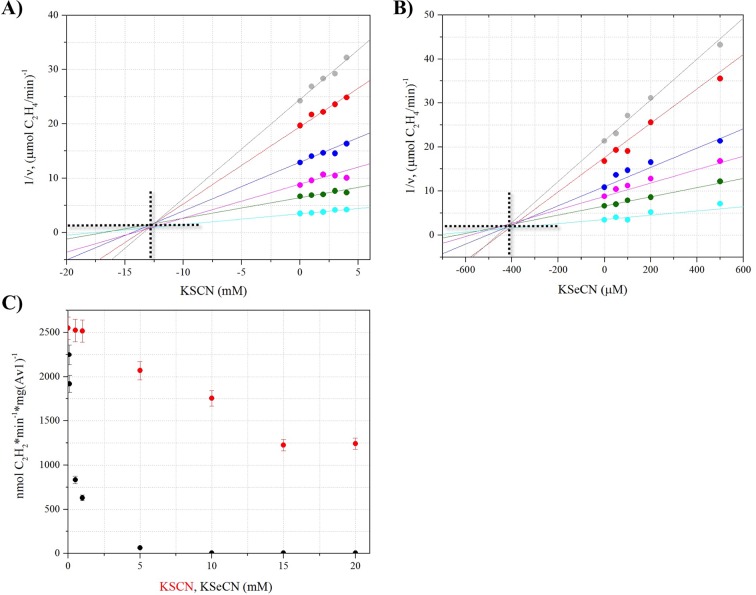
Figure 1—figure supplement 2. Inhibition of acetylene reduction by KSeCN and KSCN.

Figure 1—figure supplement 2.

Inhibitory properties of KSeCN and KSCN were determined using a modified acetylene reduction assay. Concentrations for substrate (C2H2) were below saturation and concentrations for inhibitors (KSCN, KSeCN) were at low inhibition to allow for analysis. Dixon plots were prepared by plotting 1/v versus inhibitor concentration. Ki was determined from the intersection point derived from unrestrained linear fits of data points. (A) Dixon plot for KSCN, showing a Ki of 12.7 ± 1.2 mM KSCN. Concentrations of C2H2 were varied as follows: 20 (grey), 30 (red), 40 (blue), 60 (magenta), 100 (green), 500 (teal) μL per 9 mL total headspace volume. Concentrations of KSCN were: 0, 1, 2, 3, 4 mM. (B) Dixon plot for KSeCN, showing a Ki of 410 ± 30 uM KSeCN. Concentrations of C2H2 were varied as follows: 20 (grey), 30 (red), 40 (blue), 60 (magenta), 100 (green), 500 (teal) μL per 9 mL total headspace volume. Concentrations of KSeCN were: 0, 50, 100, 200, 500 μM. (C) Acetylene reduction activity in the presence of KSeCN (black) or KSCN (red) at varied concentrations: 50 μM, 75 μM, 100 μM, 500 μM, 1 mM, 5 mM, 10 mM, 15 mM and 20 mM. Error bars represent standard deviations from three measurements.

Figure 1—figure supplement 3. Influence of KSeCN and KSCN on proton reduction.
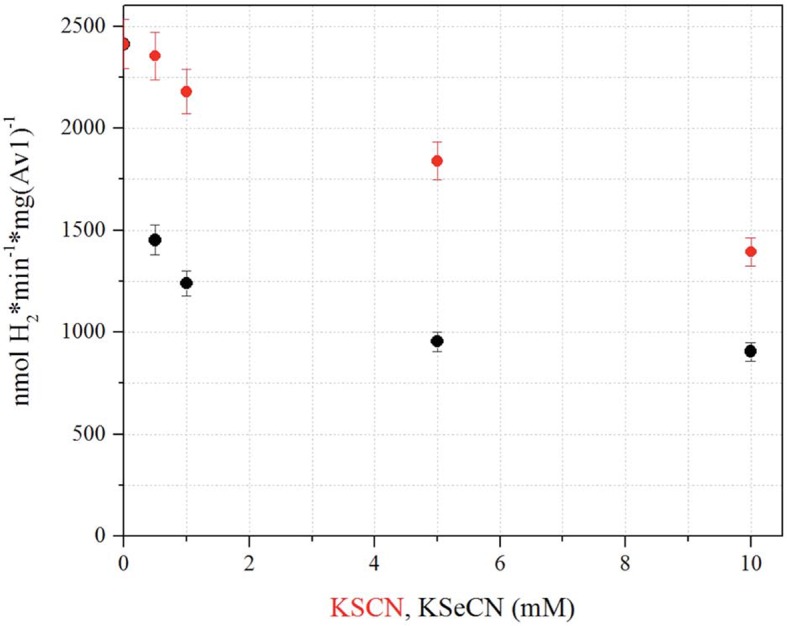
Figure 1—figure supplement 3.

Proton reduction activity as a function of KSeCN (black) or KSCN (red) concentrations (0, 0.5, 1, 5, 10 mM). H2 production in the presence of 10 mM KSeCN is approximately 65% when compared to 10 mM KSCN, and approximately 38% in comparison to the KSCN/KSeCN free reduction activity. Error bars represent standard deviations from three measurements.