Abstract
Objective
To evaluate pathology of the triangular fibrocartilage complex (TFCC) using high resolution morphologic magnetic resonance (MR) imaging, and compare with quantitative MR and biomechanical properties.
Materials and Methods
Five cadaveric wrists (22 to 70 yrs) were imaged at 3T using morphologic (proton density weighted spin echo, PD FS, and 3D spoiled gradient echo, 3D SPGR) and quantitative MR sequences to determine T2 and T1rho properties. In eight geographic regions, morphology of TFC disc and laminae were evaluated for pathology and quantitative MR values. Samples were disarticulated and biomechanical indentation testing was performed on the distal surface of the TFC disc.
Results
On morphologic PD SE images, TFC disc pathology included degeneration and tears, while that of the laminae included degeneration, degeneration with superimposed tear, mucinous transformation, and globular calcification. Punctate calcifications were highly visible on 3D SPGR images and found only in pathologic regions. Disc pathology occurred more frequently in proximal regions of the disc than distal regions. Quantitative MR values were lowest in normal samples, and generally higher in pathologic regions. Biomechanical testing demonstrated an inverse relationship, with indentation modulus being high in normal regions with low MR values. The laminae studied were mostly pathologic, and additional normal samples are needed to discern quantitative changes.
Conclusion
These results show technical feasibility of morphologic MR, quantitative MR, and biomechanical techniques to characterize pathology of the TFCC. Quantitative MRI may be a suitable surrogate marker of soft tissue mechanical properties, and a useful adjunct to conventional morphologic MR techniques.
Keywords: Wrist, distal radioulnar joint, DRUJ, ultrashort, UTE, T2, T1rho, MSK, indentation
INTRODUCTION
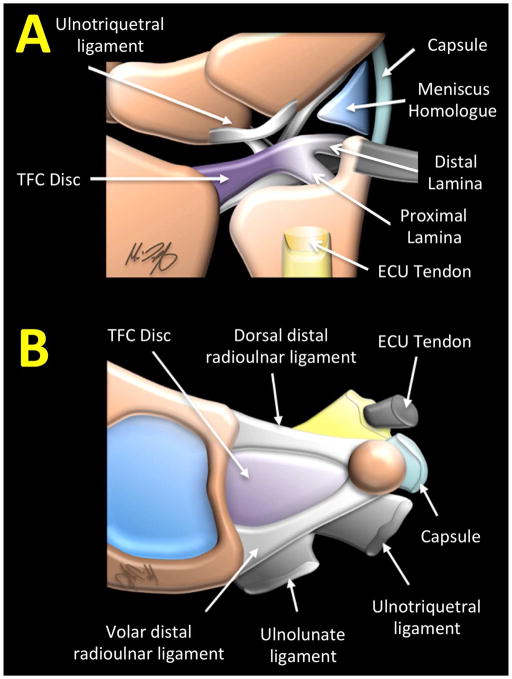
The Triangular Fibrocartilage Complex (TFCC) is the main biomechanical stabilizer of the distal radioulnar joint (DRUJ). The TFCC is a compound structure comprised of the triangular fibrocartilage (TFC) disc proper, proximal and distal laminae, volar and dorsal radioulnar ligaments, ulnocarpal ligaments (ulnolunate and ulnotriquetral ligaments), ulnar collateral ligament, subsheath of extensor carpi ulnaris (ECU) tendon and the meniscus homologue (Figure 1). The TFC articular disc is a biconcave structure attaching medially to the distal radius, and laterally to the ulnar styloid process via the proximal and distal laminae of the triangular ligament. The TFCC articulates between the proximal carpal row and the distal ulna [1, 2], facilitating smooth motion of the wrist by stabilizing the DRUJ and transmitting axial loads between the ulna and carpal bones [3].
Figure 1.
Illustration of (A) a coronal view and (B) disarticulated axial view of triangular fibrocartilage complex (TFCC) and its components.
Degenerative changes in the TFC disc develop as early as the fourth decade, and progress with advancing age [4]. Conventional magnetic resonance imaging (MRI) is widely used for diagnosis of TFCC pathology, and demonstrates a high incidence of TFCC degeneration and tears as regions of increased signal intensity. Lesions of TFCC are accurately identified with conventional MR, shows strong agreement with arthroscopy [5], and are associated with diminished function such as grip weakness as well as ulnar sided wrist pain [2].
While conventional morphologic MRI is useful clinically, quantitative MRI may further improve evaluation of the TFCC. Quantitative techniques including T2 [6] and T1rho [7] mapping are able to discern biochemical composition [8] and biomechanical properties [9] of articular cartilage. Such techniques have proven sensitivity to cartilage degeneration in the knee, and are likely capable of detecting similar structural alterations in the fibrocartilaginous TFCC. Additionally, due to moderately short T2 nature of TFCC, MR sequences utilizing ultrashort TE (UTE) techniques [10, 11] may capture signals normally unseen by conventional MR techniques. Quantitative UTE techniques allow determination of UTE T2* [12] and UTE T1rho [13] values, and have been used to evaluate many short T2 musculoskeletal tissues such as Achilles tendon, and have often provided greater sensitivity to detection of early structural alteration than conventional longer TE sequences.
To date, little has been studied on quantitative MR changes of the TFCC with pathology, and how these MR measures relate to biomechanical properties. The objective of our cadaveric study was to evaluate TFCC pathology using high resolution morphologic MRI, and compare with quantitative MR properties tailored for long or short T2 tissues, as well as compressive biomechanical properties determined by indentation testing.
MATERIALS AND METHODS
This article does not contain any studies with human participants or animals performed by any of the authors. This cadaveric study was exempt by the institutional review board and the consent was not required. This article does not contain identifiable patient data.
MRI Imaging
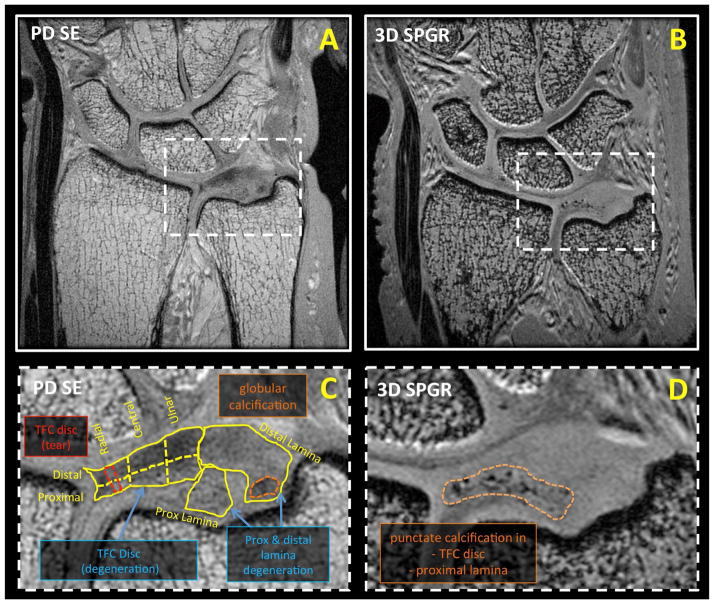
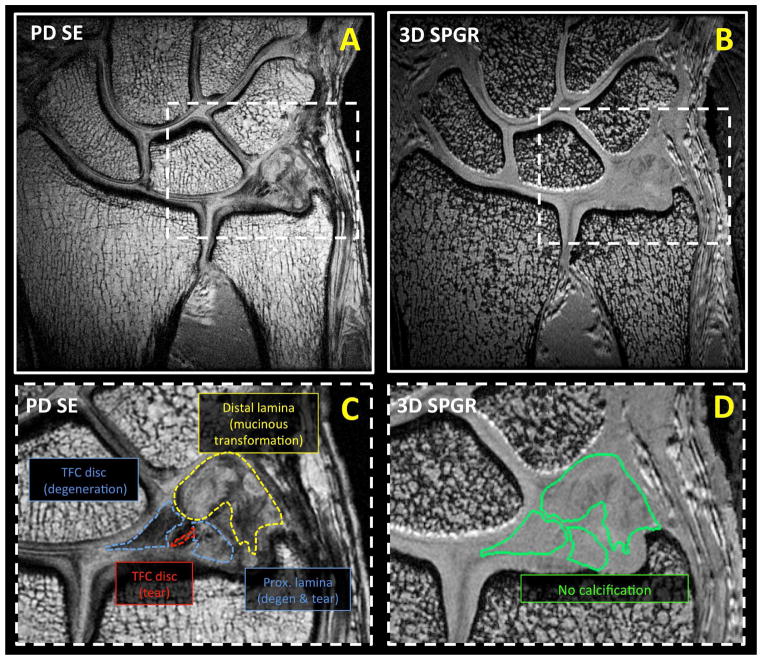
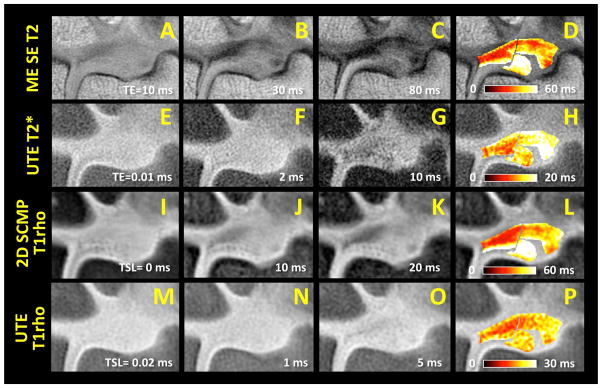
Unilateral cadaveric wrists (n=5, 2 males, 3 females, 32 to 101 years old) were obtained and imaged in a 3 Tesla Signa HDx scanner (GE Healthcare, Milwaukee, MI) with 3 inch surface coil. The MR scanner had the maximum peak gradient amplitude of 40 mT/m and slew rate of 150 mT/m/s. Hardware modification included addition of a custom transmit-receive switch to the receiver pre-amplifiers for rapid switching after the radiofrequency excitation pulse. The specimens had no known history of trauma or wrist symptoms. Specimens were placed in a neutral prone position and images were obtained in a coronal plane. Imaging protocol included morphologic and quantitative sequences. Morphologic, high-resolution sequences included proton density-weighted spin echo (PD SE; Figure 2AC and Figure 3AC) with and without fat suppression and three-dimensional spoiled gradient echo (3D SPGR; Figure 2BD and Figure 3BD) sequences. Quantitative sequences tailored for long T2 tissues included 2D multi-echo spin echo T2 mapping (ME SE T2; Figure 4A to D), 2D spiral chopped magnetization preparation (2D SCMP; Figure 4I to L) T1rho [14], and 3D magnetization-prepared angle-modulated partitioned k-space spoiled gradient echo snapshots (3D MAPSS) T1rho [15]. Quantitative sequences tailored for short T2 tissues included ultrashort time-to-echo (UTE) T2* (Figure 4E to H) and UTE T1rho (Figure 4M to P) sequences. Table 1 lists detailed scanning parameters used with each sequence.
Figure 2.
Morphologic coronal MR images of a cadaveric wrist obtained with (A, C) proton density weighted spin echo (PD SE) and (B, D) three-dimensional spoiled gradient recalled echo (3D SPGR) sequences. Soft tissue degeneration was detectable on PD SE images, while dense calcification was highly visible on SPGR images. Morphologic images were evaluated for pathology in (C) eight geographic regions. Annotated pathology seen on the close-up PD SE image (C) included degeneration (of the TFC disc and laminae), tear (red dotted line in TFC disc) and globular calcification (orange dotted line in distal lamina). (D) In a 3D SPGR image of the same sample, punctate calcifications of the TFC disc and proximal lamina could be seen as regions of focal hypointensity.
Figure 3.
Morphologic coronal MR images of another cadaveric wrist obtained with (A, C) proton density weighted spin echo (PD SE) and (B, D) three-dimensional spoiled gradient recalled echo (3D SPGR) sequences. On a close-up PD SE image (C), pathology including TFC disc degeneration (blue dotted line), TFC disc tear (red dotted line), proximal lamina degeneration with superimposed tear (purple dotted line), and distal lamina mucinous transformation (distal lamina) could be discerned. (B, D) 3D SPGR image suggested the lack of calcification in this sample.
Figure 4.
Quantitative MR images and respective color maps of a TFCC sample in coronal plane, obtained with (A to D) multi-echo spin echo T2 (ME SE T2), (E to H) ultrashort echo time (UTE) T2*, (I to L) two-dimensional spiral chopped magnetization preparation (2D SCMP) T1rho, and (M to P) UTE T1rho techniques. Images obtained at (A, E, I, M) the shortest echo time (TE) or spin-lock time (TSL) exhibit higher signal intensity in the region of the TFC disc and the laminae compared to the images obtained at (C, G, K, O) longer TE or TSL. In regions of interest representing the TFC disc and the laminae, voxel-wise exponential fitting was performed to obtain (D, H, L, P) color maps reflecting spatial variations in quantitative MR properties.
Table 1.
MR scanning parameters.
| Sequence | TR (ms) | TE or TSL (ms) | FOV (mm) | Ph x Frq | Slice (mm) | FA (deg) |
|---|---|---|---|---|---|---|
| PD SE | 1467 | 16 | 80 | 320 × 320 | 0.7 | 90 |
| 3D SPGR | 50 | 4.6 | 60 | 320 × 320 | 0.2 | 24 |
| ME SE T2 | 2000 | 10 to 80; 8 TEs | 60 | 320 × 256 | 3 | 90 |
| 2D SCMP | 1500 | 0 to 40; 4 TSLs | 80 | 1024 × 85 | 3 | 90 |
| 3D MAPSS | 8.7 | 0 to 20; 4 TSLs | 80 | 256 × 256 | 3 | 60 |
| UTE T2* | 100 | 0.01 to 30; 12 TEs | 60 | 256 × 255 | 3 | 28 |
| UTE T1rho | 400 | 0.02 to 10; 4 TSLs | 60 | 192 × 191 | 3 | 40 |
MR Evaluation
Images from the mid-coronal slice were selected for each sample, to register with the locations of biomechanical indentation testing. Morphologic MR images (PD SE and 3D SPGR; Figure 2 and Figure 3) were evaluated by two musculoskeletal radiologists (C.B.C. with 16 years of clinical experience, and T.R. with 5 years of clinical experience). The images were evaluated for pathology of the TFC disc and lamina as follows.
On PD SE images, normal MR appearance of the TFC disc was defined as homogeneous hypointense bowtie-like structure. Normal appearing proximal and distal laminae were defined as hypointense or slightly hyperintense striated bands continuous with the ulnar attachment on fovea and ulnar styloid process, respectively. Abnormal MR appearances included the following: (1) degeneration: globular or curvilinear intermediate signal intensity (i.e., lower than the signal intensity of the synovial fluid) within the tissue without extension to the articular surface; (2) degeneration with superimposed tear: ill-defined surface wear and/or intra-substance fluid intensity on the degenerative tissue background; (3) tear: irregular high intensity with morphologic alteration, or fluid intensity extending to the tissue surface on either or both sides, or tissue transection; (4) mucinous transformation: hyperintense cystic-like lesion intervening and contained within the TFCC tissue. In addition, on both PD SE and 3D SPGR images, superimposed tissue calcifications were defined as punctate, linear or globular hypointense foci. Although abnormal, regions of tissue perforation were excluded owing to the lack of tissue for evaluation.
Additionally, distal-to-proximal thickness of the TFC disc was measured (OsiriX, Pixmeo SARL, Geneva, Switzerland) at the approximate indentation sites, to determine indentation modulus.
Quantitative MR images were analyzed by selecting 8 regions of interest (ROI) in the TFCC representing the following geographic areas (Figure 2C): 6 sub-regions of the TFCC disc including distal-radial, distal-central, distal-ulnar, proximal-radial, proximal-central, and proximal-ulnar regions, as well as proximal and distal lamina. The signal intensity in each of the 8 ROIs were averaged and fit to the appropriate mono-exponential decay function to determine SE ME T2, UTE T2*, 2D SCMP T1rho, and UTE T1rho values.
Biomechanical (Indentation) Testing
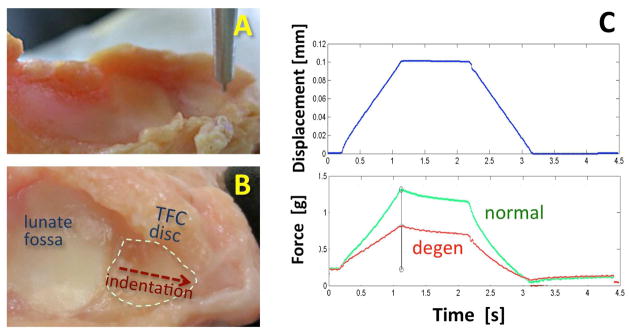
The wrists were dissected by an orthopaedic surgeon and the soft tissues of the TFCC exposed. One sample was excluded upon gross inspection due to excessive calcifications covering the entire radial side of the wrist, which would exhibit an abnormally high biomechanical stiffness. The remaining four exposed TFCC specimens were tested as planned. The samples were thawed in normal saline and clamped on a custom jig to expose the distal surface of the TFCC disc for indentation testing. Indentation was performed (Figure 5A) with a MACH-1 mechanical testing system (Biomomentum, Laval, QC, Canada) fitted with a non-porous 1 mm diameter plane-ended indenter. Indentation was performed on multiple locations of the TFCC disc, from the radial to ulnar end of the disc (Figure 5B) 1 mm apart. At each site, loading protocol consisted of an application of 0.1 mm compressive displacement at a velocity of 0.1 mm/sec, held for 1 sec, and a release at the same velocity, while recording the force. To reduce variability of indentation measurement due to varying thickness of the disc tissue, the instantaneous shear modulus was calculated [16], assuming Poisson’s ratio of 0.5 and correcting for thickness of the tissue. Indentation moduli were averaged for 3 anatomic regions of the disc (distal-radial, distal-central and distal-ulnar) for comparison against MR morphology in each region.
Figure 5.
(A, B) Gross photographs of a disarticulated wrist sample prepared for biomechanical indentation testing of the distal surface of the TFC disc with a (A) non-porous 1 mm diameter plane-ended indenter. (B) Each TFC disc was tested at multiple sites along a radio-ulnar midline of the disc. (C) Indentation testing protocol consisted of application of a short-duration compressive displacement while measuring the force generated. Differences in measured data from a normal (green) and a degenerated (red) TFC disc is illustrated.
Statistical Analysis
The pathology for each ROI was defined by the MR morphology. Quantitative MR properties and indentation moduli of the TFC discs were analyzed using Analysis of Variance (ANOVA) and posthoc Tukey test. Statistically significant level was set at p=0.05.
RESULTS
MR Morphology of TFCC
On morphologic PD SE images, pathology of the TFC disc included degeneration (Figure 2C and Figure 3C) and tears (Figure 3C), while that of the lamina included degeneration (Figure 2C and Figure 3C), degeneration with superimposed tear, and mucinous transformation (Figure 3C). Calcifications were seen on both PD SE and 3D SPGR images, but were more conspicuous on 3D SPGR images (Figure 2D). Each of eight geographic regions of the TFCC (Figure 2C) was annotated by the observed pathology in the region.
In the morphologic images of the TFC discs, pathology of some kind was found in 24 out of 30 regions. None of the TFC discs was completely normal, including that from the youngest donor. Proximal regions were mostly pathologic (14 of 15) while distal regions tended to be less pathologic (10 of 15; chi-square p=0.07). Degeneration was the most common type of pathology, found in 21 of 24 pathologic regions, while tearing was identified in 3 of 24 pathologic regions. Calcifications were found only in regions of degeneration (5 of 21 degenerated regions). No calcifications were detected in normal TFC tissues.
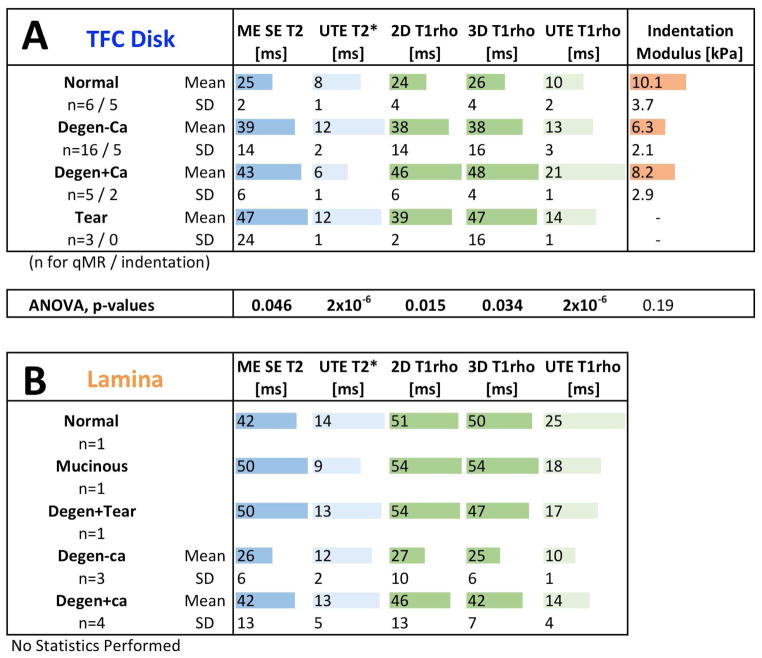
In the TFC disc, qMR values were lowest in normal samples and increased significantly with pathology (Figure 6A). ME SE T2 values in normal, degeneration without calcification, degeneration with calcification, and torn discs were 25±2 ms (mean±standard deviation), 39±14 ms, 43±6 ms and 47±24 ms, respectively, and increased significantly with the severity of pathology (p=0.046). UTE T2* value of the aforementioned tissues were 8±1 ms, 12±2 ms, 6±1 ms, and 12±1 ms, respectively, also varying significantly with pathology (p=2×10⁻⁶). T1rho values from 2D SCMP T1rho sequence were 24±4 ms, 38±14 ms, 46±6 ms, and 39±2 ms, respectively, and the values from 3D MAPSS T1rho sequence were similar. These values also varied significantly with pathology (p<0.05). UTE T1rho values of the same tissues were 10±2 ms, 13±3 ms, 21±1 ms, and 14±1 ms, respectively, also varying significantly with pathology (p =2×10⁻⁶).
Figure 6.
(A) Quantitative MR values and biomechanical indentation modulus for the TFC disc. All quantitative MR values were generally lowest in normal samples, and increased significantly with degeneration or tear. Indentation modulus showed an inverse trend, being the highest in normal samples and decreasing with pathologic changes. (B) Quantitative MR values for the lamellae. Lamellar samples were mostly pathologic, and requires additional samples for statistical analysis.
On morphologic images (Figure 2 and Figure 3), proximal and distal lamina exhibited diverse pathology (9 of 10), including mucinous transformation (Figure 3C; 1 of 10), degeneration with superimposed tear (1 of 10), degeneration without calcification (Figure 2C; 3 of 10) and degeneration with calcification (Figure 2C; 4 of 10).
While quantitative MR values were obtained for the laminae (Figure 6B), no statistics were performed due to the diverse pathology and small number of normal lamina (n=1). ME SE T2 values of laminae ranged from 26 to 50 ms. UTE T2* values yielded a lower range of 9 to 14 ms. T1rho values obtained from 2D and 3D T1rho sequences ranged from 27 to 54 ms and 25 to 54 ms, respectively. A lower range of 10 to 25 ms was found for UTE T1rho values. Among pathologic samples, degenerative tissue with calcification tended to have higher quantitative values (ME SE T2, 2D and 3D T1rho, and UTE T1rho) than those without calcification, similar to the finding in the TFC discs.
Biomechanical Properties of the TFC Disc
Indentation modulus values were generally higher in normal regions of the TFC disc and lower in pathologic regions (Figure 5C). In the normal, degeneration region without calcification, and degeneration region with calcification, the indentation moduli were 10.1±3.7 kPa, 6.3±2.1 kPa, and 8.2±2.9 kPa, respectively (Figure 6A). Degenerative tissue with superimposed calcification had a slightly greater modulus than the degenerative tissue without calcification. However, no statistically significant difference due to pathology was found between normal and pathologic regions.
DISCUSSION
These results show technical feasibility of high resolution morphologic and quantitative MR techniques to evaluate pathology of the TFCC, and their biomechanical ramifications. Morphologic PD SE sequence reliably demonstrated pathology of TFC disc including degeneration and tear, as well as pathology of the lamina including degeneration, degeneration with superimposed tear, and mucinous transformation. Punctate calcifications were best depicted on the 3D SPGR sequence, similar to those in the knee meniscus [17]. Calcifications were found only within pathologic regions, a finding consistent with prior MR studies [17]. Greater frequency of pathology involving proximal regions of the TFC disc as compared to the distal regions was also similar to previous findings [18], and may relate to greater amount of articulation and wear on the proximal side during forearm supination and pronation [4].
Quantitative MR techniques provide a novel and sensitive means for evaluating tissues of the TFCC, and complement conventional techniques. In our study, both T2 and T1rho measurements from conventional and UTE MR techniques generally increased with pathology, in agreement with past studies on other musculoskeletal tissues such as articular cartilage [6, 19]. To our knowledge, only one study [20] has previously reported quantitative T1 and T1rho values of the TFC discs and found a positive correlation with age. Quantitative MR, however, did not uniquely demonstrate abnormalities not seen with conventional sequences. While clinical utilization is currently scarce for the wrist, and diagnostic efficacy (e.g., greater accuracy or sensitivity to pathology over conventional techniques) has not been established, quantitative MR could be beneficial in some cases clinically. Quantitative MR techniques provide objective and continuous measure of tissue health, which would be useful not only for initial assessment but also for follow up after therapeutic interventions. For example, stable minor tears or degeneration of the TFCC, as well as repaired tissues, may be monitored longitudinally for signs of deterioration without obvious morphologic changes. Sensitivity of many quantitative MR techniques to composition of load-bearing musculoskeletal tissues [8, 21] is yet another reason for applying quantitative techniques in the wrist.
Calcification, found only in regions of degeneration, tended to have higher (T2, T2*, T1rho) values on most sequences compared to degenerated tissue without calcification. For punctate calcifications with short T2 values [17], the higher quantitative MR values are attributable to degeneration of tissue surrounding the calcification. Interestingly, UTE T2* values were lower in regions with calcification (6±1 ms) compared to degenerated regions without calcification (12±2 ms). This observation may relate to susceptibility artifact producing more rapid T2 dephasing and loss of magnetization at longer TEs, thereby reducing calculated T2* values. Spin echo or magnetization-prepared techniques are less prone to such an artifact.
Biomechanical indentation testing demonstrated loss of normal TFC disc stiffness in pathologic regions, consistent with past biomechanical studies of various healthy and diseased connective tissues. In articular cartilage [22], meniscus [23], and temporomandibular disc [24, 25], decreased tissue stiffness from degeneration occurs with advanced age or osteoarthritis, due to loss of normal collagen structure and increased water content. This also results in increase in T2 values, as found in pathologic tissues in this study. Degenerated regions of the TFC disc with superimposed calcification, however, exhibited a slightly higher modulus compared to similar regions without calcification, suggesting the calcifications may have been dense and stiff in nature and may also have confounded the evaluation of the properties of the soft tissue alone.
This study has several limitations. Due to a small sample size, relatively few normal tissues were included in the study, especially for the laminae. Further, without histopathologic analysis (could not be performed due to tissue damage that occurred after the study during storage), the performance of morphologic MR for pathology detection could not be validated, nor could biomechanical testing measurements be correlated with confirmed structural changes. This makes interpretation of the data somewhat challenging, and it will be addressed in future studies. The regions of interest in the TFC disc were selected to facilitate comparison against biomechanical properties, and may have contained mixed pathology (i.e., thin tear within normal region was defined as tear), possibly confounding our results. Additionally, quantitative MR values in the laminae are susceptible to magic angle effect, as the curvature of the laminae nears 55° relative to the main magnetic field B0 [26]. Lastly, clinical history related to each sample was not available.
In conclusion, these results show a significant association between degenerative changes of the TFCC visible on high resolution morphologic MRI, and objective measurements obtained with quantitative MRI and biomechanical testing. Quantitative MR techniques are a novel and sensitive means for evaluating the TFCC, which may complement conventional techniques and allow more precise staging of TFCC degeneration. The techniques presented are readily translatable in vivo, but additional studies are needed to determine in vivo diagnostic utility.
Acknowledgments
This article was made possible in part by grants from Award Number 5I01CX000625 (Project ID: 1161961) from the Clinical Science Research & Development of the VA Office of Research and Development in support of Dr. Christine B. Chung, and the National Institute of Arthritis and Musculoskeletal and Skin Diseases of the National Institutes of Health in support of Dr. Won C. Bae (Grant Number R01 AR066622). The contents of this paper are solely the responsibility of the authors and do not necessarily represent the official views of the National Institutes of Health or Veterans Affairs.
Footnotes
Disclosure: The authors declare that they have no conflict of interest
CONFLICT OF INTEREST
The authors declare that they have no conflict of interest.
Contributor Information
Won C. Bae, Email: wbae@ucsd.edu.
Thumanoon Ruangchaijatuporn, Email: thumanoon.rua@outlook.com.
Eric Y Chang, Email: ericchangmd@gmail.com.
Reni Biswas, Email: rbiswas@gmail.com.
Jiang Du, Email: jiangdu@ucsd.edu.
Sheronda Statum, Email: sherondastatume@msn.com.
Christine B. Chung, Email: cbchung@ucsd.edu.
References
- 1.Pahwa S, Srivastava DN, Sharma R, Gamanagatti S, Kotwal PP, Sharma V. Comparison of conventional MRI and MR arthrography in the evaluation wrist ligament tears: A preliminary experience. Indian J Radiol Imaging. 2014;24(3):259–267. doi: 10.4103/0971-3026.137038. [DOI] [PMC free article] [PubMed] [Google Scholar]
- 2.Al-Hiari AA. The role of wrist magnetic resonance arthrography in diagnosing triangular fibrocartilage complex tears: experience at king hussein medical center, jordan. Sultan Qaboos University medical journal. 2013;13(2):280–286. doi: 10.12816/0003235. [DOI] [PMC free article] [PubMed] [Google Scholar]
- 3.Nakamura T, Yabe Y, Horiuchi Y. Dynamic changes in the shape of the triangular fibrocartilage complex during rotation demonstrated with high resolution magnetic resonance imaging. Journal of hand surgery. 1999;24(3):338–341. doi: 10.1054/jhsb.1998.0216. [DOI] [PubMed] [Google Scholar]
- 4.Mikic ZD. Age changes in the triangular fibrocartilage of the wrist joint. J Anat. 1978;126(Pt 2):367–384. [PMC free article] [PubMed] [Google Scholar]
- 5.Meier R, Schmitt R, Christopoulos G, Krimmer H. TFCC-lesion. MR arthrography vs. arthroscopy of the wrist. Unfallchirurg. 2003;106(3):190–194. doi: 10.1007/s00113-002-0505-5. [DOI] [PubMed] [Google Scholar]
- 6.Mosher TJ, Dardzinski BJ. Cartilage MRI T2 relaxation time mapping: overview and applications. Semin Musculoskelet Radiol. 2004;8(4):355–368. doi: 10.1055/s-2004-861764. [DOI] [PubMed] [Google Scholar]
- 7.Regatte RR, Akella SV, Wheaton AJ, Lech G, Borthakur A, Kneeland JB, et al. 3D-T1rho-relaxation mapping of articular cartilage: in vivo assessment of early degenerative changes in symptomatic osteoarthritic subjects. Acad Radiol. 2004;11(7):741–749. doi: 10.1016/j.acra.2004.03.051. [DOI] [PubMed] [Google Scholar]
- 8.Welsch GH, Mamisch TC, Zak L, Blanke M, Olk A, Marlovits S, et al. Evaluation of cartilage repair tissue after matrix-associated autologous chondrocyte transplantation using a hyaluronic-based or a collagen-based scaffold with morphological MOCART scoring and biochemical T2 mapping: preliminary results. Am J Sports Med. 2010;38(5):934–942. doi: 10.1177/0363546509354971. [DOI] [PubMed] [Google Scholar]
- 9.Wheaton AJ, Dodge GR, Elliott DM, Nicoll SB, Reddy R. Quantification of cartilage biomechanical and biochemical properties via T1rho magnetic resonance imaging. Magn Reson Med. 2005;54(5):1087–1093. doi: 10.1002/mrm.20678. [DOI] [PubMed] [Google Scholar]
- 10.Young IR, Bydder GM. Magnetic resonance: new approaches to imaging of the musculoskeletal system. Physiol Meas. 2003;24(4):R1–23. doi: 10.1088/0967-3334/24/4/r01. [DOI] [PubMed] [Google Scholar]
- 11.Robson MD, Gatehouse PD, Bydder M, Bydder GM. Magnetic resonance: an introduction to ultrashort TE (UTE) imaging. J Comput Assist Tomogr. 2003;27(6):825–846. doi: 10.1097/00004728-200311000-00001. [DOI] [PubMed] [Google Scholar]
- 12.Du J, Takahashi AM, Chung CB. Ultrashort TE spectroscopic imaging (UTESI): application to the imaging of short T2 relaxation tissues in the musculoskeletal system. J Magn Reson Imaging. 2009;29(2):412–421. doi: 10.1002/jmri.21465. [DOI] [PubMed] [Google Scholar]
- 13.Du J, Carl M, Diaz E, Takahashi A, Han E, Szeverenyi NM, et al. Ultrashort TE T1rho (UTE T1rho) imaging of the Achilles tendon and meniscus. Magn Reson Med. 2010;64(3):834–842. doi: 10.1002/mrm.22474. [DOI] [PubMed] [Google Scholar]
- 14.Buck FM, Bae WC, Diaz E, Du J, Statum S, Han ET, et al. Comparison of T1rho measurements in agarose phantoms and human patellar cartilage using 2D multislice spiral and 3D magnetization prepared partitioned k-space spoiled gradient-echo snapshot techniques at 3 T. AJR Am J Roentgenol. 2011;196(2):W174–179. doi: 10.2214/AJR.10.4570. [DOI] [PMC free article] [PubMed] [Google Scholar]
- 15.Li X, Han ET, Busse RF, Majumdar S. In vivo T(1rho) mapping in cartilage using 3D magnetization-prepared angle-modulated partitioned k-space spoiled gradient echo snapshots (3D MAPSS) Magn Reson Med. 2008;59(2):298–307. doi: 10.1002/mrm.21414. [DOI] [PMC free article] [PubMed] [Google Scholar]
- 16.Hayes WC, Keer LM, Herrmann KG, Mockros LF. A mathematical analysis for indentation tests of articular cartilage. J Biomech. 1972;5:541–551. doi: 10.1016/0021-9290(72)90010-3. [DOI] [PubMed] [Google Scholar]
- 17.Omoumi P, Bae WC, Du J, Diaz E, Statum S, Bydder GM, et al. Meniscal calcifications: morphologic and quantitative evaluation by using 2D inversion-recovery ultrashort echo time and 3D ultrashort echo time 3.0-T MR imaging techniques--feasibility study. Radiology. 2012;264(1):260–268. doi: 10.1148/radiol.12111439. [DOI] [PMC free article] [PubMed] [Google Scholar]
- 18.Kang HS, Kindynis P, Brahme SK, Resnick D, Haghighi P, Haller J, et al. Triangular fibrocartilage and intercarpal ligaments of the wrist: MR imaging. Cadaveric study with gross pathologic and histologic correlation. Radiology. 1991;181(2):401–404. doi: 10.1148/radiology.181.2.1924779. [DOI] [PubMed] [Google Scholar]
- 19.Baum T, Joseph GB, Karampinos DC, Jungmann PM, Link TM, Bauer JS. Cartilage and meniscal T2 relaxation time as non-invasive biomarker for knee osteoarthritis and cartilage repair procedures. Osteoarthritis Cartilage. 2013;21(10):1474–1484. doi: 10.1016/j.joca.2013.07.012. [DOI] [PMC free article] [PubMed] [Google Scholar]
- 20.Rauscher I, Bender B, Grozinger G, Luz O, Pohmann R, Erb M, et al. Assessment of T1, T1rho, and T2 values of the ulnocarpal disc in healthy subjects at 3 tesla. Magn Reson Imaging. 2014;32(9):1085–1090. doi: 10.1016/j.mri.2014.05.010. [DOI] [PubMed] [Google Scholar]
- 21.Li X, Cheng J, Lin K, Saadat E, Bolbos RI, Jobke B, et al. Quantitative MRI using T1rho and T2 in human osteoarthritic cartilage specimens: correlation with biochemical measurements and histology. Magn Reson Imaging. 2011;29(3):324–334. doi: 10.1016/j.mri.2010.09.004. [DOI] [PMC free article] [PubMed] [Google Scholar]
- 22.Bae WC, Temple MM, Amiel D, Coutts RD, Niederauer GG, Sah RL. Indentation testing of human cartilage: sensitivity to articular surface degeneration. Arthritis Rheum. 2003;48(12):3382–3394. doi: 10.1002/art.11347. [DOI] [PubMed] [Google Scholar]
- 23.Danso EK, Makela JT, Tanska P, Mononen ME, Honkanen JT, Jurvelin JS, et al. Characterization of site-specific biomechanical properties of human meniscus-Importance of collagen and fluid on mechanical nonlinearities. J Biomech. 2015;48(8):1499–1507. doi: 10.1016/j.jbiomech.2015.01.048. [DOI] [PubMed] [Google Scholar]
- 24.Lu XL, Mow VC, Guo XE. Proteoglycans and mechanical behavior of condylar cartilage. J Dent Res. 2009;88(3):244–248. doi: 10.1177/0022034508330432. [DOI] [PMC free article] [PubMed] [Google Scholar]
- 25.Bae WC, Biswas R, Statum S, Sah RL, Chung CB. Sensitivity of quantitative UTE MRI to the biomechanical property of the temporomandibular joint disc. Skeletal Radiol. 2014;43(9):1217–1223. doi: 10.1007/s00256-014-1901-y. [DOI] [PMC free article] [PubMed] [Google Scholar]
- 26.Bydder M, Rahal A, Fullerton GD, Bydder GM. The magic angle effect: a source of artifact, determinant of image contrast, and technique for imaging. J Magn Reson Imaging. 2007;25(2):290–300. doi: 10.1002/jmri.20850. [DOI] [PubMed] [Google Scholar]


