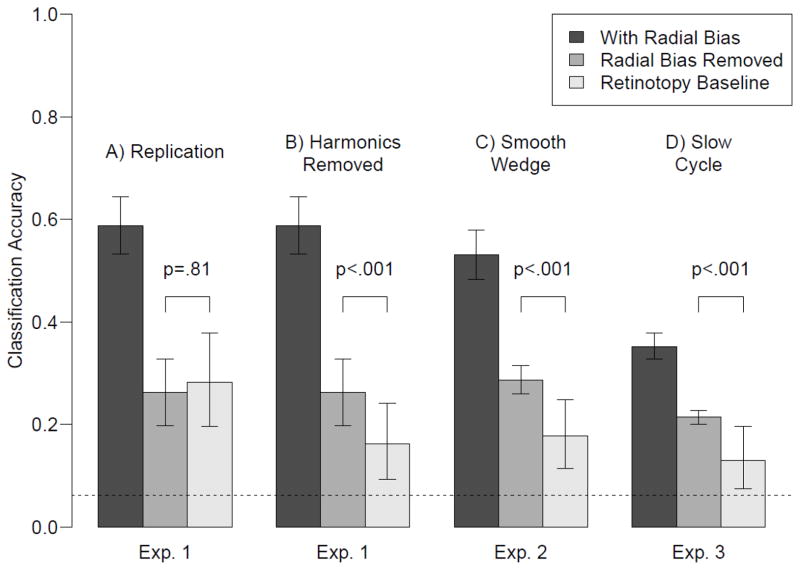
Figure 2.
Decoding results from Experiments 1–3. The leftmost bar in each panel shows decoding performance for the original orientation data. The middle bar shows decoding performance after removal of the radial bias. The third bar shows the retinotopy baseline, which represents the amount of residual retinotopy information left over after removal of the retinotopy signal. If orientation decoding after removing the radial bias is higher than this retinotopy baseline, then there must be orientation information in the signal that is not due to radial bias. Error bars denote standard errors for orientation decoding with and without radial bias. For the retinotopy baseline, the error bars denote the .025 and .975 percentiles of the simulated distribution, averaged across participants.

