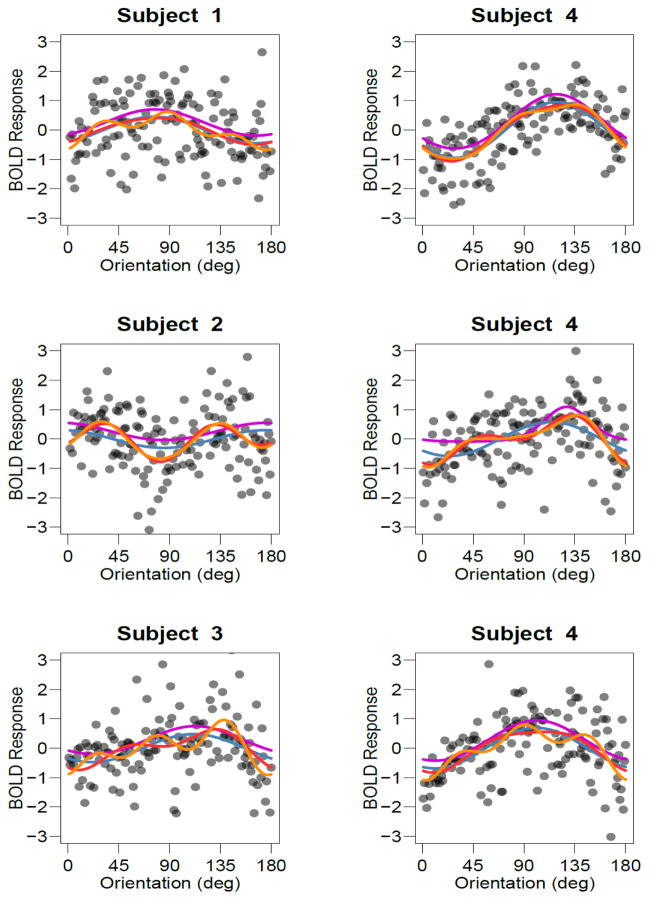
Figure 4.
Examples of tuning curves for individual voxels. Each point depicts the BOLD response of an individual voxel to an individual block in Experiment 4. Lines denote the best-fitting single-cosine (blue), two-cosine (red), three-cosine (orange) and von Mises (magenta) models overlaid as lines. The von Mises curves have been shifted up slightly so that they are not obscured by other curves. Top, middle and bottom rows depict voxels that were fit best by the single, double and triple-cosine complexity, respectively, where fit was assessed using AIC.

