Abstract
Accurate automated tissue segmentation of premature neonatal magnetic resonance images is a crucial task for quantification of brain injury and its impact on early postnatal growth and later cognitive development. In such studies it is common for scans to be acquired shortly after birth or later during the hospital stay and therefore occur at arbitrary gestational ages during a period of rapid developmental change. It is important to be able to segment any of these scans with comparable accuracy. Previous work on brain tissue segmentation in premature neonates has focused on segmentation at specific ages. Here we look at solving the more general problem using adaptations of age specific atlas based methods and evaluate this using a unique manually traced database of high resolution images spanning 20 gestational weeks of development. We examine the complimentary strengths of age specific atlas-based Expectation-Maximization approaches and patch-based methods for this problem and explore the development of two new hybrid techniques, patch-based augmentation of Expectation-Maximization with weighted fusion and a spatial variability constrained patch search. The former approach seeks to combine the advantages of both atlas- and patch-based methods by learning from the performance of the two techniques across the brain anatomy at different developmental ages, while the latter technique aims to use anatomical variability maps learnt from atlas training data to locally constrain the patch-based search range. The proposed approaches were evaluated using leave-one-out cross-validation. Compared with the conventional age specific atlas-based segmentation and direct patch based segmentation, both new approaches demonstrate improved accuracy in the automated labeling of cortical gray matter, white matter, ventricles and sulcal cortical-spinal fluid regions, while maintaining comparable results in deep gray matter.
Keywords: Segmentation, MRI, Atlas-based, Patch-based, Expectation-Maximization, Premature Neonates, Spatio-temporal
1. Introduction
In the past decades, magnetic resonance (MR) imaging has been an essential tool to study human brain anatomy of all developmental stages: fetal [53, 54, 17], neonatal [26, 39, 11, 51], children [16, 35, 52], adolescents [16, 35, 52, 15] and adults [18]. These studies often rely on delineation of different tissue classes to characterize the brain anatomy as a critical step before any analysis. However, manual delineation of tissues is both time consuming and difficult to reproduce, especially for studies using a large cohort [2, 25, 51]. Thus, an automatic tissue labeling technique is crucial for allowing detailed and reproducible evaluation of the brain morphometry [26, 25, 36, 43].
Significance
One particular group of subjects - premature neonates - have attracted a great deal of interest both clinically and in research [26, 30, 2, 43, 44, 38]. Premature neonates are classed as babies who are born at less than 37 gestational weeks (GW) [26, 24, 46]. Even though the preterm birth rate in the United States has declined by 11% since 2006, the rate still remains high at 11.38% in 2013 [24]. Growing evidence shows that preterm infants are often at a higher risk of anatomical abnormalities and accompanying neuro-cognitive deficits, such as cerebral palsy [38], periventricular leukomalacia (PVL) [56], ventriculomegaly [28] and severe intraventricular hemorrhage (IVH) with periventricular hemorrhagic infarction (PHI) [56]. Furthermore, evidence indicates adverse neuro-developmental outcomes later in life [46], including neuromotor function [61], behavioral disorders [28], cognitive impairment [38, 56]. Therefore, efforts are being made to better characterize early brain development [55, 26] and to diagnose neuro-developmental abnormalities as early as possible [28, 7, 32]. MR imaging and subsequent analysis of the premature neonatal brain structure provides us with a promising route to providing specific markers of brain injury.
Previous Work on Brain Tissue Segmentation
In the past decades, various approaches have been proposed for automated tissue labeling of brain MR images [64, 41, 65, 20]. Significant efforts have been made in developing atlas-based approach [12, 43, 44]. In such methods, an atlas of neonatal brain anatomy is generated from manual or semi-automated labeling and used as prior knowledge for automated tissue labeling. One of the most powerful and commonly used approaches is the atlas-based Expectation-Maximization (EM) tissue labeling method [60, 33, 4, 9]. In such approaches, a spatial atlas was constructed from a set of manually delineated MR scans and used to provide the essential spatial information in an EM algorithm, which is based on the voxel intensity clustering of MRI[60, 33, 4]. The conventional EM-based tissue labeling approach is based on a Gaussian Mixture Model (GMM) of the observed MRI intensities, where the intensity values of each tissue class are assumed to have a Gaussian distribution, whose parameters can be estimated based on the Maximum Likelihood Estimator (MLE) using the EM algorithm [50]. The EM algorithm is dependent on a priori information from a spatial prior, due to overlap in MR intensity ranges of different tissue classes [9]. One unique example in T1-weighted premature neonatal brain MRI is the similar intensity level exhibited by the myelinated white matter and gray matter. Here, without a spatial prior, the EM algorithm will be unable to label the tissues based on MR intensity alone. A second strength of the atlas-based EM approaches is that they can directly incorporate an MRI intensity inhomogeneity model to account for scanner or developmentally induced variation of tissue intensity across the imaged field of view [34].
However, errors in aligning new images to the atlas can induce errors that may be correlated with changes of interest in the anatomies being studied (e.g. increasing complexity with age or the occurrence of lesions and blood clots). To reduce such errors, multi-atlas label fusion algorithms were proposed [1, 3, 48]. Label fusion strategies such as Majority Voting (VM) and the STAPLE algorithm [59] have been extensively investigated. However, such approaches still rely heavily on having manually delineated atlas subjects that closely match the subjects being studied. These methods can be limited in cases of more extreme developmental variations and often pose challenging registration problems when mapping between individual and atlas. Wang et al. [57] improved on the conventional multi-atlas label fusion techniques with iteratively updated tissue probability maps, with validation only on term-born infants in the first year of life without prematurity. However, such direct label fusion methods are difficult to apply in cases of imaging rapid brain growth at random developmental stages. For example, to segment a 29 GW scan, a label fusion approach would require multiple pre-segmented examples around that gestational age with the same tissue contrast. It is not practical to obtain such set of manual segmentations matching any gestational age to be segmented. A second limitation of this approach is that it required multiple MR contrasts, for which it is difficult to ensure consistent quality during multiple acquisitions due to the high probability of motion during unsedated clinical studies.
Alternative studies suggested a patch-based approach, in which local patch-based searches can provide accurate labeling of tissues where local MRI intensity alone contains adequate information to predict the underlying tissue label [47, 14, 13]. A patch-based approach makes use of local similarities between images which were previously developed for non-local image de-noising problems [8, 31]. The key advantage of this method is that it does not require a fine scale mapping from atlas to subject [47], and therefore would demonstrate better performance than the conventional atlas-based methods when the subject’s anatomy deviates greatly from the anatomies captured in the atlas and this deviation can be recognized with only MR intensity patterns. However, the patch-based approach cannot handle the cases where tissue classification is highly dependent on the spatial location of the voxel, not simply on intensity. For instance, even with carefully defined local search range, it can be challenging to differentiate myelinated white matter and cortical grey matter in T1-weighted MRI data of developing neonates. Therefore, it is difficult to use the conventional patch-based technique alone to produce anatomically correct automated tissue labelings.
Introducing patch-based approaches into other segmentation frameworks, for example, probabilistic approaches, has also been proposed and studied. A probabilistic patch-based label fusion model for multi-atlas segmentation was first proposed by Bai et al. [6] and evaluated on cardiac MR images. Wu et al. [63] and Asman et al. [5] further developed such approach for the adult brain MRI and thyroid segmentation task. Initial attempts to apply such method on neonatal brain MRIs have been made. Wang et al. [58] evaluated a patch-driven level sets approach on normal neonatal T1w images over a small age range (41.5 ± 1.7 GWs) after normal term births, and for only GM and WM classes. No evaluation on premature neonatal brain was provided, and thus, could not show any age independence for their segmentation accuracy.
Studies also aimed to achieve a more detailed automatic labeling of brain tissues and regions. Gousia et al.[19] evaluated and compared an atlas-based and a label fusion-based approach to automatically segment neonatal brain MR images at term age into 50 regions. Makropoulos et al. [37] further pushed ahead to a wider age range using an Expectation-Maximization (EM)-based framework and showed promising results. However, brain parcellation remains a different problem than tissue segmentation and they did not evaluate the methods against manual labeling in scans at any gestational ages.
Challenges of Tissue Labeling in Premature Neonatal Imaging
One of the key challenges in automated analysis of premature neonatal MR data is the rapid anatomical changes with age [36, 43]. The age-dependent differences that can be observed in MR scans include the size and shape of the brain due to brain growth, as well as the changes in MR intensity contrast caused by brain maturation [21]. Previous work on neonatal brain tissue segmentation mainly focused on segmentation at specific ages, for example, the NeoBrainS12 challenge [29]. In our work, an additional dimension of time is incorporated into the atlas and a spatio-temporal atlas can be constructed from a set of manually delineated MRIs covering the age range of interest as in [21, 23, 36]. For each new MR scan to be segmented, an age-matched anatomy can be synthesized from the spatio-temporal atlas and used to provide the essential spatial prior in the EM algorithm.
Another key challenge in automated delineation of brain tissues in premature neonatal MRIs is the increasing inter-subject variation with age or the occurrence of blood clots and associated tissue abnormalities. Although the addition of a parametrized spatio-temporal atlas can provide a more age-specific and thus accurate tissue prior [21], the method can still fail to accurately segment the MRI anatomies that exhibit large anatomical variations that are not well captured by an average tissue atlas derived from a training dataset [50]. Especially in clinical studies of brain injuries occurring from preterm birth, it is a challenge to completely capture a model of all possible variations within a new subject using a finite training dataset. If the individual MRI to be segmented differs from all atlas subjects, then the accuracy of the prior is dependent on the estimation of a non-rigid mapping to align the new individual anatomy to the atlas prior [36]. However, this problem cannot be simply solved using a finer scale alignment of the subject and atlas MRI intensities. A very fine scale mapping may resolve normal geometric differences between the average prior and the subject, but may also incorrectly adapt and distort fundamental pathological differences that should be preserved and labeled. For example, when regional tissue contrast is modified by brain injury, fine scale registration may simply remove or shrink these differences so that they better match the atlas prior anatomy, rather than preserving the geometry of the differences, such as lesions, damaged tissues or regions of high contrast blood clot and their location in the surrounding normal anatomy. This problem becomes particularly challenging in the premature neonates, because of the extreme shape variation in normal tissue boundaries (e.g. ventricle size and shape as in Fig. 1) that must be aligned to the statistical average, and the significant variation in local tissue integrity and intensity (e.g. abnormal white matter intensity as in Fig. 1) that need to be preserved for segmentation. Cardoso et al. proposed an adaptive MAP-EM-based segmentation algorithm especially for such cases in preterm neonates and showed satisfactory results in cases of ventriculomegaly [10]. However, the age range covered by their dataset was limited to 35.7 to 44.3 GWs (40.4 ± 1.74 GWs) which corresponds to the time when the premature neonates are recovering from earlier injuries, and did not provide an evaluation on cases of with more severe anatomical variations in images acquired shortly after birth.
Figure 1.
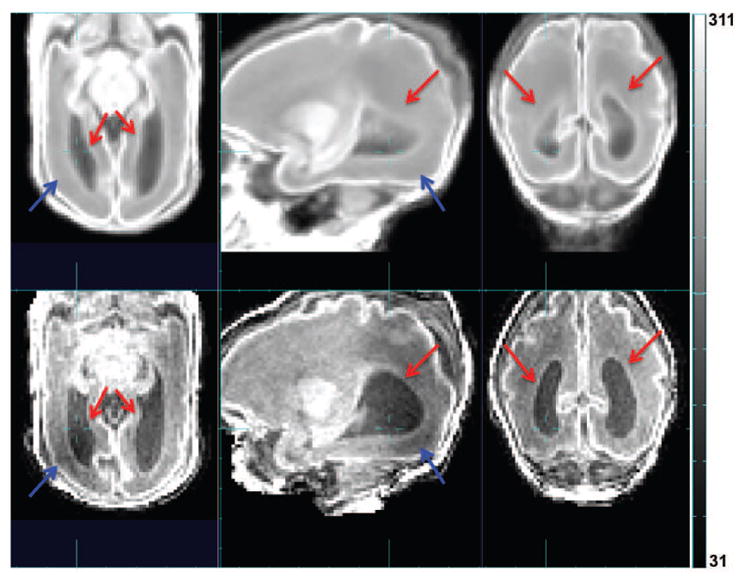
Comparison between the age-specific average image warped into subject space (upper row) and the subject MR image (lower row). Red arrow: difference in ventricle size and shape. Blue arrow: abnormal white matter intensity.
Proposed Approach And Contributions
In this work, we propose two different approaches that integrate and make the best use of both an accurate parameterized atlas prior and a patch-based local search in the EM segmentation framework. The first approach i) learns the location of greatest errors in the atlas-based tissue segmentation based on training data, and ii) adapts the priors in these locations to make use of priors derived from a local patch-based dictionary search of the atlas data. The second approach a) learns the amount of spatial variability at each location from carefully aligned atlas training data, and b) uses it to guide the patch-based local search carried out at each voxel. Both hybrid approaches aim to provide a more robust prior that is derived from both an anatomical atlas average and a local tissue match for the EM segmentation. This allows a balance between the accuracy of mapping between subject anatomy and atlas, and the intensity similarity assumptions for patch searches in different regions of the brain. The proposed approaches can be generalized as a patch-based augmentation of EM (PBAEM) via weighted fusion (WF) or spatial variability search (SVS) with specific application to parametric atlas-based segmentation. The proposed approaches were evaluated on a set of 32 MR brain scans of premature neonates with ages ranging from 27.3 to 46.4 gestational weeks (GW) using leave-one-out cross-validation. We show that such methods can produce more accurate automated tissue labeling, especially in cases of large inter-subject anatomical variation, compared to either the conventional atlas-based and patch-based approaches. This work is a significant development on our preliminary methodology presented at SPIE Medical Imaging 2014 [36] by adding adapted weighting for PBAEM-WF and a newly proposed PBAEM-SVS approach.
The contributions of this work are threefold.
We propose novel methods to achieve automatic segmentation of premature neonatal MRIs with higher accuracy and age consistency at any given age than conventional atlas- and patch- based methods after premature birth, instead of a single target age. This is especially important in the clinical settings since clinical neonatal MR studies may be acquired at any random time point based on diagnostic needs.
Our work presents the most extensive quantitative validation against whole brain manual tissue labelings of different algorithms over the largest age range in premature neonatal MRI studies.
The atlas in this work, constructed from 32 manually traced scans, is the most complete premature neonatal brain tissue atlas constructed from manual labeling and covers the widest age range among published datasets of 27.2 to 46.4 GWs.
In the next sections, we describe both approaches in detail and their validation on a set of premature neonatal brain MR images with a high level of anatomical variation.
2. Methods
2.1. Overview
In this section, we first briefly review the EM-based automatic tissue segmentation framework and define the “running prior” which is the focus of our work. Next, we introduce the process to synthesize atlas-based tissue probabilities from the spatio-temporal atlas, followed by the computation of patch-based tissue probability. Then we demonstrate how we spatially adapt the tissue probability prior using both the atlas- and patch-based tissue probability. Finally, we summarize the entire PBAEM framework.
2.2. Preliminaries & EM-based Tissue Segmentation Algorithm
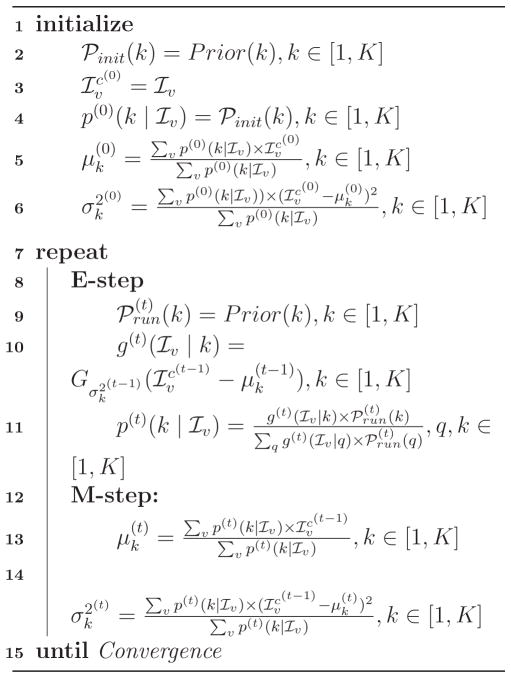
Let v be the voxel index, x = [x[1], x[2], x[3]]T be the voxel coordinates of voxel v, Iv ≡ I(x) be the intensity of voxel v, and ℐv ≡ ln Iv be the log-transformed intensity. Following [23], we model the log-transformed intensity ℐ instead of the original intensity I with GMM to increase robustness to outliers and achieve better performance. K is the number of tissue classes we aim to segment the image into, and k ∈ [1,K] is the current tissue class. μk and are the mean and variance of tissue class k in the log-transformed space of the GMM model. is the Gaussian probability density of log-transformed intensity ℐv at voxel v given mean μk and variance . ℘(k) stands for the prior tissue probability of class k and p(ℐv |k) is the posterior tissue probability of class k given the log-transformed voxel intensity ℐv. The EM algorithm consists of an initialization step and an iterative process to estimate the GMM parameters. To distinguish the priors using in different steps, the initialization prior is denoted as ℘init(k). The prior which is used in the iterations is referred to as the “running prior” and denoted as ℘run(k). The superscript of (0) indicates the variable values in the initialization step, and superscript (t) indicates the variable values at the t-th iteration of EM.
In addition, to account for MRI signal variations (i.e. bias fields), a polynomial model of the bias field is integrated in the EM iterative framework [23, 34]. The degree of the polynomial model gradually increases from zero to three upon EM convergence [23]. We assume a standard multiplicative bias model [34] and correct for the bias field based on current estimate of the GMM in each iteration [23, 34]. The log-transformed bias field at t-th iteration at voxel v is denoted as ℬv. Thus, the bias-corrected log-transformed MR intensity at voxel v is given by:
| (1) |
Given the definitions above, the EM-based tissue segmentation algorithm can be expressed by Algorithm 1. Prior(k) generally represents the tissue probability prior of tissue class k from any source. Experimentally, we omit the neighborhood constraint on to obtain superior performance in older subjects. The initialization prior and running prior are the focus of our work and are explained in details in the following subsections.
Algorithm 1.
EM-based Segmentation Algorithm
2.3. Atlas-based Estimation of Tissue Probability
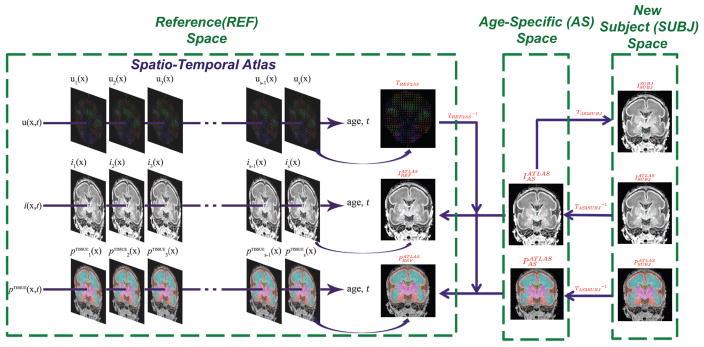
In this subsection, we first explain the construction of a spatio-temporal atlas, followed by the steps to synthesize age-specific atlas-based tissue probability. Here we define three spaces (Figure 2): the space of spatio-temporal atlas is referred to as the reference (REF) space; the space of synthesized age-matched anatomy is referred to as the age-specific (AS) space; and the space of the new subject to be segmented is denoted as the subject (SUBJ) space. For the remainder of the paper, the MR intensity images I and tissue probability maps P will be denoted in accordance to the following rule: the superscript indicates the source of the image, and the subscript indicates the space which the image is in. The subscript of transformation T indicates the two spaces between which the transformation applies.
Figure 2.
Illustration of synthesizing atlas-based tissue probability from the spatio-temporal atlas.
In the conventional task of tissue labeling for adult brain images, a spatial atlas is constructed from multiple manually traced training datasets and provides essential spatial information to distinguish tissue classes with similar intensity levels. However, at this stage of life, premature neonates experience rapid anatomical changes due to brain development. Therefore, the intensity and location of tissue classes can be highly dependent on age. To incorporate temporal information in the atlas, we use a parameterized spatio-temporal atlas approach as proposed by [21]. After a symmetric groupwise alignment of all atlas datasets, we bring all the individual anatomy to a common space via a set of displacement fields that capture the difference of individual anatomical locations of each point from the average anatomy. These displacement fields are denoted as TREF2SUBJ. Temporal models of global linear transformation parameters and local displacement fields, MR intensity and tissue probably are fitted to this data. To obtain the atlas-based estimation of the tissue probability for a new subject MR scan, firstly, we synthesize an age-matched global and local displacement field TREF2AS, MR intensity template and a tissue probability map from the spatio-temporal atlas to correspond to the new scan. Note that here TREF2AS essentially is the composition of a global linear transformation and a local deformation field: TREF2AS = T̃REF2AS ∘ T̂REF2AS where T̃REF2AS is the global linear transformation and T̂REF2AS is the local warp field. Secondly, is used to bring and from the reference space to the AS space as and (equivalent for P):
| (2) |
Thirdly, the MR image of the new subject is linearly registered to the age-specific MR using 12 parameters (including translation, rotation, scaling and skewness) followed by a non-rigid registration to obtain TAS2SUBJ as in previous fetal brain segmentation [49, 21]. In this step, a mask is used to exclude the non-brain portions in the MR scan such as neck, nose etc. Also note that here we have: TAS2SUBJ = T̃AS2SUBJ ∘ T̂AS2SUBJ. Based on the inverse of the estimated spatial transformation , we map the age-specific MR template and age-specific tissue probability map into the space of the new subject MRI. We denote this subject-space age-specific MR template as and the subject-space age-specific tissue probability map as .
| (3) |
which is equivalent for P. In fact, is the resulting atlas-based estimation of tissue probability for the new subject scan. In the atlas-based segmentation approach [23], is used as a source of spatially varying priors in the EM algorithm. Thus, in the EM segmentation algorithm with only an atlas-based prior , Eq. 2 in Algorithm 1 should be replaced with:
| (4) |
and Eq. 9 in Algorithm 1 is replaced with:
| (5) |
2.4. Patch-based Estimation of Tissue Probability
Following the framework of previous patch-based segmentation approaches [47, 14, 13], for a given location in the subject anatomy, we carry out a local search of a reference dictionary image for feasible matches to the observed region of subject anatomy to be labeled. Unlike patch-based segmentation of adults [47, 14, 13], we do not simply search a labelled subject anatomy textbook matching the subject, instead we search the age-specific estimate for that scan generated from the atlas data subjects. This is important in studies of rapidly developing brain anatomy where a single age representative matched atlas subject may not exist for a new MRI study, and it is more appropriate to search a model based representative average template synthesized for that age. This search is carried out across the aligned age-specific MR template (i.e. ) within a given search distance of the voxel to be labelled. The search range is assigned as a ratio of estimated total tissue volume to avoid any bias in search neighborhood size due to brain volume differences across ages. In order to eliminate differences in global contrast between and , we run a first-round atlas-based age-specific EM segmentation to obtain the bias-corrected MR image. We further scale its intensity so that the mean intensities within the brain between and are the same. A weight w(u, v) between the patch to be labeled Hv centered at voxel v in and each patch in the search neighborhood N(v) centered at voxel u in is computed as [47, 14, 13]:
| (6) |
where n is the number of voxels in a 3-D patch; ε is the standard deviation of the noise and β is the smoothing parameter. In this manner, the computed weight of each sample is only driven by the similarity of the intensity between the two patches in the MR to be segmented and the subject-space age-specific MR. Unlike a direct patch labeling scheme as in previous patch-based approaches[47, 14, 13], the proposed approach extracts the best tissue probability estimate for each class k from the dictionary image instead of the best label estimate for use in the EM optimization. A patch-based tissue probability for each possible patch is computed by a fusion of weighted tissue probabilities of patches within the defined search neighborhood [47, 14, 13]:
| (7) |
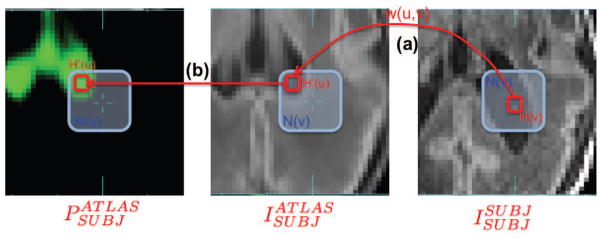
where is the computed patch-based tissue probability (unnormalized) of class k given voxel intensity Iv. Figure 3 illustrates the patch-based local search.
Figure 3.
Illustration of patch-based local search adapted for using with spatio-temporal atlas. (a) For the patch Hv centered at voxel v, the local search is conducted within the search neighborhood N(v) in and weight w(u, v) between each possible pair of patches is computed. (b) Tissue probability of each possible patch within N(u) is extracted from the and used to compute the patch-based tissue probability of voxel v.
In order to ensure we have a probability estimate at each voxel, such that , we normalize the estimates at each voxel:
| (8) |
where is the normalized patch-based tissue probability of class k given voxel intensity Iv. Using this definition, voxels with similar surrounding neighborhoods are considered to have similar tissue probabilities [13].
To reduce computational time required for voxel by voxel patch evaluation during larger searches, we exclude patches centered outside the brain. Pre-computation of local image statistics in the reference and subject MRI is carried out to allow a more efficient and accurate pre-exclusion [13] of patch matches. In our study, this pre-selection procedure is based on the structural similarity measure (SSIM) [13, 14].
In the EM segmentation algorithm using only a patch-based prior , Eq. 2 in Algorithm 1 is simply replaced by:
| (9) |
and Eq. 9 in Algorithm 1 is finally replaced with:
| (10) |
2.5. Spatially Adapted Tissue Probability Prior
In the following two subsections, we subsequently describe two proposed ways to integrate the atlas-based tissue probability with a local patch-based search.
2.5.1. Weighted Fusion (WF) of Tissue Probabilities
Using the framework described above, we have two alternative probabilities for tissues at each location in the MRI scan to be segmented. In PBAEM, we combine these two estimates into a single weighted tissue probability for each voxel to provide an improved initial estimate for use as a running prior in the EM algorithm. For the weighting to be optimal, we account for the “Patch Contribution” (PC) to quantify how much new information is introduced by adding the patch-based estimates of tissue probability as well as its accuracy and reliability. Also, we implement a weighting for “Voxel Label Accuracy” (VLA) to quantify the overall performance of each tissue prior within the EM algorithm. To capture the age-specific feature of the spatially varying PC and VLA map, we adopted same approach from the spatio-temporal atlas to construct a spatio-temporal model of both PC and VLA maps, and synthesize age-specific PC and VLA maps for each new subject to be segmented. In the following paragraphs, details of learning these weightings are given.
Age-Specific Patch Contribution (PC) Map
The contribution of the patch-based approach into the combined tissue probability depends on the intensity uniqueness on two levels: intensity structure within a patch itself and the patch similarity within the search neighborhood. Consider cases when a voxel has a similar MR intensity to its neighboring voxels or a patch has a similar structure to its neighboring patches. If the voxels or patches belong to the same tissue class, then a patch-based local search will yield exactly the atlas-based tissue probability as the neighbours are structurally equivalent. If these constant voxels or patches belong to different tissue classes (e.g. at DGM/WM boundaries), then the patch-based search does not help in distinguishing the tissue. Thus, measurements that characterize intensity uniqueness within the patch and search neighborhood are essential to quantify the actual contribution of patch-based local search. We characterize the patch contribution per voxel in two ways: patch uniqueness (PU) and neighborhood uniqueness (NU). PU measures the intensity variance given image noise within the patch under consideration, while NU describes how much on average the intensities are different between the patch under consideration and all patches within its search neighborhood.
Here we derive PU as an example: The measured MR intensity of a voxel can be seen as its true value plus additive noise. The probability of two voxels’ (v and v′) actual intensities Īv and Īv′ being the same given their measured intensities Iv and Iv′ and image noise variance σ2 is:
| (11) |
The probability of n voxels in a patch Hv centered at voxel v having the same true intensities as voxel v is:
| (12) |
The n-th root is taken to eliminate any bias caused by the different number of voxels in a patch, especially in patches at brain boundary. Therefore, the patch uniqueness, which is the probability of n voxels in a patch having different intensities as the center voxel, is defined as:
| (13) |
In the same manner, we define neighborhood uniqueness NU as:
| (14) |
where N is the number of patches within the search neighborhood of voxel i.
The patch contribution (PC) at each voxel is then computed as the product of PU and NU:
| (15) |
To eliminate the intensity variation across the image as well as between subjects, all computations is conducted on bias-corrected MRIs which are also globally intensity normalized to match the intensity of the age specific atlas MRI values. To construct a spatio-temporal model of PC maps across the age range, we follow the approach used for temporal modeling of tissue probabilities [21]. LogOdds representation of probabilities [21, 42] is adopted to ensure that the resulting model estimates of PC values are in the range of valid probabilities. The probabilities are then modeled in the LogOdds space using a polynomial model of designated degree [21].
Age-Specific Voxel Label Accuracy (VLA) Map
From the perspective of the overall performances of the two tissue probabilities used as running priors in the EM labeling, we use our training data to learn where each estimate provides a more useful EM prior. To do this we evaluate the results of EM segmentation using the two different priors on the training data. Then we evaluate overall performance of each at every voxel using a leave-one-out cross-validation against the manual tracing for each subject in the training dataset. From this we create an overall Voxel Label Accuracy (VLA) map for both the atlas- and patch-based tissue probabilities. The VLA of each voxel is defined as follows:
| (16) |
where V LAa(v) and V LAp(v) are the VLA of voxel i of atlas- and patch- based tissue probability respectively; ca(v) and cp(v) are the number of scans that are labeled correctly via EM segmentation using atlas- and patch-based priors respectively; t(v) is the total number of scans segmented at voxel i. We follow the same approach to construct a temporal model of VLA maps in the LogOdds space and synthesize age-specific VLA maps for each new subject scan. These two maps allow us to quantify of the accuracy level of two tissue probabilities for each voxel in the MR image to be segmented.
Spatially Weighted Tissue Probability
For tissue class k given voxel intensity Iv for voxel i, the combined tissue probability is the weighted average of atlas-based tissue probability Pa(k | Iv) and the patch-based tissue probability Pp(k | Iv):
| (17) |
2.5.2. Spatial Variability Search (SVS)
A single spatio-temporal atlas can only capture the average age-dependent changes in anatomy over time. However, scans of subjects at the similar ages exhibit individual variability, especially in the depth and location of cortical foldings that cannot be accounted for easily without also loosing abnormal features such as lesions and blood clots. In PBAEM, the purpose of introducing in the patch-based local search is to reduce the segmentation error caused by residual differences between the age specific atlas and the individual to be segmented. An alternative way of examining the problem of combining methods is directly in terms of this spatial variability: If there is no individual variability in the location of an anatomical point after global linear registration, the patch search range should be over few (or zero) neighbors and should therefore return the same probability as a direct age specific atlas prior. If we know that individual anatomies are varied in their spatial configuration at a given location then we would expect to use a wider patch search range. Thus, an alternative approach to combining the atlas and patch priors is by learning how to adapt the patch search range for given locations and ages. We can again do this from the atlas data by constructing an accurately aligned set of subjects (using the careful manual segmentations) and modeling how spatial variation in the positioning of anatomical locations varies with age.
Temporal Modeling of Variability
We define the minimum deformation space of the average anatomy as reference space. The groupwise alignment of the atlas data is constructed such that the the mean displacement around each point is zero. In constructing a spatio temporal atlas of these displacements as in [21] we create an average growth trajectory that can be used to synthesize an average estimate of location of each point for any given age. Here we consider the residual variability in the displacements across the atlas group around the average displacement trajectory as capturing information about individual anatomical variability.
For each subject in the atlas, for voxel v with voxel coordinate x, we can calculate the absolute difference R̂v between the age specific displacement field for that age TREF2AS(x) and the actual field TREF2SUBJ(x) that was estimated to map that individual to the average anatomy:
| (18) |
Then we follow the same approach of temporal modeling as in [21], but fit a linear model to the residual displacement R̂(x) between the age specific displacements and the actual displacements for each subject. This model then allows us to synthesize an age-specific error map in addition to the mean shape, intensity and tissue probability maps used in EM segmentation. We define this age-matched error map as the variability map, which captures the inter-subject variation for the given age, and denote its value with voxel coordinates x by R(x).
Constraining the Patch Search Range
This locally learnt age-specific variability map can then be used to define the patch-based local search range. Essentially, for each voxel, the variability in three image axis directions gives us a 3D ellipsoid centered at the voxel under investigation. This ellipsoid defines the search range for its center voxel. Noted that the synthesized age-specific variability map is in the reference space. Therefore, we first transform the voxel location in the new subject space into the reference space.
For voxel v in , transformation of its spatial location xSUBJ to the reference anatomy space is done in two steps. Firstly, we transform the voxel coordinates from the new subject space to the AS space:
| (19) |
Then we transform the voxel coordinates from the AS space into the reference space:
| (20) |
After transforming voxel locations, we determine that, in the reference space, voxel v′ with fractional coordinate x′REF is in the search range of voxel v with fractional coordinate xREF if the following inequality is satisfied:
| (21) |
where a is the search range threshold that can be adjusted experimentally for the best performance (Figure 4).
Figure 4.
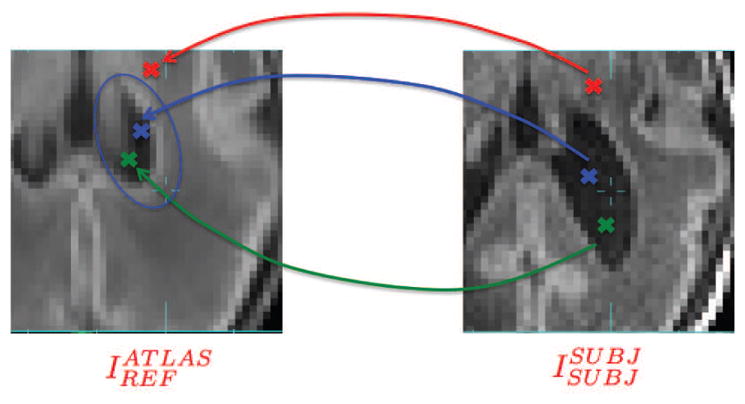
Illustration of transforming voxel locations from SUBJ space to REF space and determining whether voxels lie in the search range (blue elipsoid) in the REF space. Blue cross: voxel to be labeled; Green cross: voxel inside the search range of voxel to be labeled; Red cross: voxel outside the search range of voxel to be labeled.
In this way, in regions with less variation, such as DGM and internal WM away from the cortex, a spatial variability-defined search range is restricted. In extreme cases, when variability is minimal, no search will be conducted and the patch-based tissue probability will be the same as the atlas-based tissue probability at that voxel. Conversely, points in the cortex at later gestational ages will have high between-subject variability and the search is required to include a certain fraction of expected locations of the cortex after global linear registration. Thus, the range will be larger.
2.6. Patch-based Augmentation of EM (PBAEM) Framework
In the proposed approach, we combine the desirable properties of both atlas- and patch-based approaches to provide an improved prior with which to initiate EM labeling of a new MRI scan. Experimentally, we found that best automated tissue labeling performance was achieved using patch-based tissue probability as the initialization prior and the combined tissue probability as the running prior in the EM algorithm. Therefore, in the initialization step, Eq. 2 in Algorithm 1 should be replaced with:
| (22) |
In the iterations, Eq. 9 in Algorithm 1 should be replaced with:
| (23) |
3. Experiments and Validation
MR Imaging Protocol & Image Preprocessing
Premature neonatal imaging was performed by our collaborators at University of British Columbia in Vancouver, Canada using a 1.5T Siemens scanner with a dedicated neonatal head coil. For each scan, a T1-weighted image was acquired using a 3D FLASH sequence with imaging parameters TR = 36ms, TE = 9.2ms and a voxel resolution of 1.04 × 1.04 × 1mm3. Then, to create a reference atlas and test set, each MR image was manually segmented into six cerebral tissue regions: gray matter (GM), white matter (WM), ventricles (VENT), deep gray matter (DGM), sulcal CSF (sCSF) and non-brain background region (BG) using the rview segmentation tool (http://rview.colin-studholme.net). The resulting tissue label maps were used to create the spatio-temporal atlas and also served as reference segmentation for accuracy mapping and validation.
Population
The test dataset used for validation consists of 32 T1-weighted brain MR scans of premature neonatal brains. The birth ages range from 24.9 to 31.4 GWs (27.9 ± 2.3 GWs), and the ages at scan range from 27.3 to 46.4 GWs (35.0 ± 5.6 GWs). The male to female ratio of 32 training subjects is 16/16. Our dataset is one of the most long-standing manually-traced premature neonatal brain MRI dataset dating back to 2008 [46].
3.1. Atlas Registration and Model Construction
To create an accurately aligned set of images in the common reference space REF a symmetric demons registration was employed to form a minimum distance shape average between all the brain anatomies. This was used to align the data driven by a multi-channel alignment of manually labeled tissue maps and also manually labeled lobe regions marked on each of the atlas subject MRI scans used rather than the MRI values alone to provide improved accuracy and anatomical consistency. These transformation were then used to bring each of the subject MRI scans into the REF space. To build the parameteric atlas over the large developmental range, instead of a quadratic model used previously [21, 36], different degrees of temporal fitting were tested on the age range and a third order model was employed for each of the components.
Parameter and Model Selection
We experimentally searched for the best parameter settings for the patch search and algorithmic models. First, the temporal models using linear, quadratic and cubic fitting were tested. Then, in PBAEM-WF, we aimed to use the same patch search parameters for all tissue classes for the patch-based local search. To select the optimal parameters, a patch size of 3 × 3 × 3 voxels and 5×5×5 voxels, and a search neighborhood size ratio from 0.0005 to 0.015 of the total brain volume were tested. In PBAEM-SVS, a locally defined search range from 1.0 to 3.0 times of variability were tested. Results of these are detailed below.
Validation
To evaluate the overall performance of the segmentation approach against the conventional age-specific EM, experiments were performed using a leave-one-out cross-validation, as dividing the 32 manually traced scans into separate training and test data would result in an inadequate number of scans to accurately capture the growth over the extended age range studied here. Each scan was segmented with the spatio-temporal atlas from the other 31 subject scans. The oldest scan (46.4 GW) was excluded from segmentation performance evaluation because its age lay significantly beyond the maximum age of the remaining atlas subjects. Thus, the atlas constructed from the remaining younger subjects could not adequately represent its complex anatomy. Conversely, near the younger age limit, we have more scans in our atlas cohort that allows us to carry out a meaningful evaluation of the segmentation performance. To avoid excessive computations, the PC and VLA models were constructed from all training scans. Since the PC map does not depend on the spatio-temporal atlas, the PC model used all 32 training scans. However, the VLA model could only be constructed from 31 training scans due to the exclusion of the oldest scan.The comparison of overall performance between the conventional atlas-based segmentation approach and PBAEM was made using 31 sets of automated and manual tissue labeling. To quantify the performance of the automatic segmentation, the Dice Similarity Coefficient (DSC), Hausdorff distance (HD) [27] and mean distance (MD) of the tissue volume between manual and automatic tissue labellings were used. Detailed distance measurements of GM and WM divided by 8 lobes (Frontal Left/Right, Temporal Left/Right, Parietal Left/Right and Occipital Left/Right) were also computed. To challenge the validity of proposed methods without using computationally expensive leave-on-out cross-validation for PC and VLA maps, experiments on non-atlas scans(which are not used in the atlas training dataset consisting of 32 scans) were conducted. We present the results in the following section.
4. Results
In this section, we first show a collective comparison of DSC by using five different methods (Table 1), which will be referred to later in the section. We include the conventional atlas-based EM segmentation (Column 2) and direct patch-based labeling technique (Column 3) as baseline methods. For the direct patch-based technique, due to the fact that it is extremely difficult to obtain a set of manually labeled textbook images at each age, we adopted the age-specific average which was synthesized from the spatio-temporal atlas as the reference. An EM segmentation with patch-based tissue probability alone as prior (Column 4) was also included in the comparison as an improvement on the direct patch-based segmentation to provide more insight on patch-based tissue probability estimation. In the following subsections, we discuss in detail the results of PBAEM-WF, followed by results of PBAEM-SVS.
Table 1.
Comparison of average DSCs of 31 subjects using five methods. Highest DSCs are bold.
| Tissue Class | EM w/Atlas-based | Direct Patch-based Segmentation | EM w/Patch-based Prior | PBAEM-WF | PBAEM-SVS |
|---|---|---|---|---|---|
| GM | 0.856 ± 0.030 | 0.720 ± 0.097 | 0.801 ± 0.043 | 0.869* ± 0.024 | 0.884* ± 0.027 |
| WM | 0.911 ± 0.061 | 0.847 ± 0.089 | 0.911 ± 0.041 | 0.918* ± 0.045 | 0.928* ± 0.042 |
| VENT | 0.856 ± 0.053 | 0.775 ± 0.077 | 0.859 ± 0.049 | 0.867* ± 0.044 | 0.871* ± 0.046 |
| sCSF | 0.769 ± 0.045 | 0.767 ± 0.040 | 0.803 ± 0.042 | 0.801* ± 0.043 | 0.810* ± 0.039 |
| DGM | 0.932 ± 0.019 | 0.856 ± 0.053 | 0.874 ± 0.028 | 0.926 ± 0.019 | 0.923 ± 0.020 |
indicates statistical significance with P < 0.05 from pair-wise two-tailed t-test with using EM w/atlas-based prior.
4.1. PBAEM-WF
4.1.1. Parameter and Model Selection
We first experimented with temporal models of atlas, PC and VLA maps. A cubic temporal model of local deformation, MR intensities and tissue probabilities showed superior performance over the quadratic model. While, quadratic and cubic temporal models of PC and VLA maps showed comparable results. For the sake of consistency, we adopted the cubic model for all further experiments.
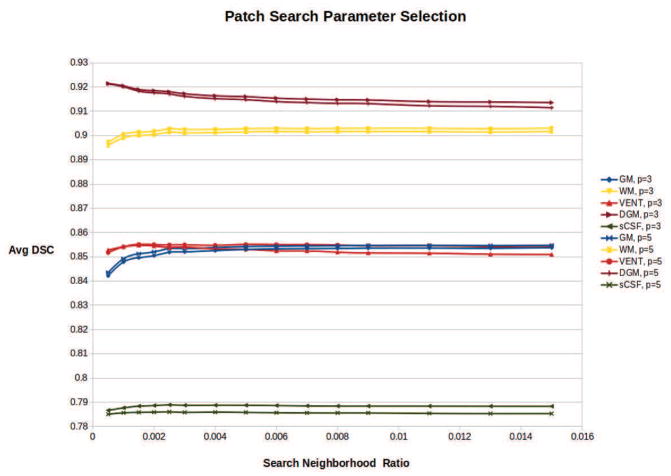
Then, we experimented with different patch search parameters to achieve the optimal performance of the PBAEM approach. To determine parameter settings to optimize performance, we assessed the average DSC of PBAEM automatic labeling of all 31 testing scans using patch-based tissue probabilities computed with different sets of parameters. A patch size of 3 × 3 × 3 voxels and 5 × 5 × 5 voxels, and a search neighborhood size ratio from 0.0005 to 0.015 of total brain volume were explored experimentally. Figure 5 shows the average DSC obtained using these sets of parameters. The average DSC stabilizes around a search neighborhood ratio of 0.003, regardless of the patch size. We chose the optimal search range ratio of 0.0025 allowing for optimal performance in cortical regions (e.g. GM, sCSF) and WM, while limiting the decrease of DSC in DGM. A patch size of 3 ×3 ×3 voxels or 5 ×5 ×5 voxels showed comparable results in GM, WM, VENT and DGM at search neighborhood ratio of 0.0025. However, given the different performances on the sCSF class, we chose a patch size of 3 × 3 × 3 voxels to allow more improvement in sCSF. Therefore, the final parameters for the following experiments and results are a patch size of 3 × 3 × 3 voxels and a search neighborhood ratio of 0.0025. This corresponds to about 9 × 9 × 9 in younger brains and about 13 × 13 × 13 in older brains.
Figure 5.
Average DSC of GM, WM, VENT, DGM and sCSF using PBAEM-WF automated segmentation with different sets of patch search parameters. Patch size of 3 × 3 × 3 voxels or 5 × 5 × 5 voxels is indicated by solid or dashed line. Neighborhood ratios correspond to fraction of total brain volume. An optimal patch size of 3 × 3 × 3 and a search range of 0.0025 were chosen for optimal performances in cortical regions.
4.1.2. Atlas- and Patch-based Estimation of Tissue Probability
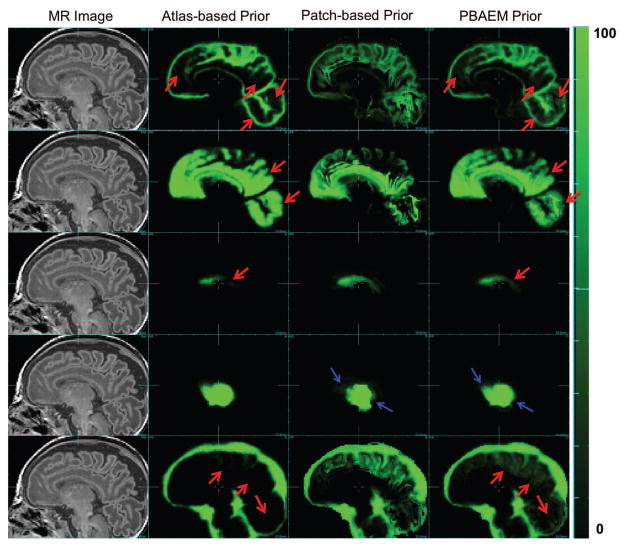
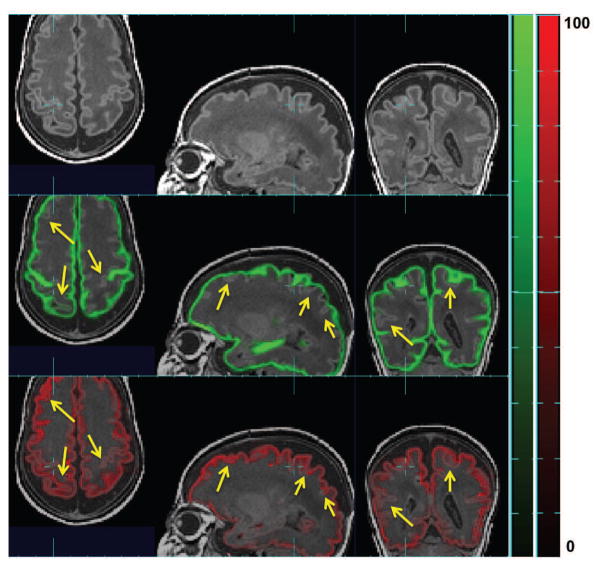
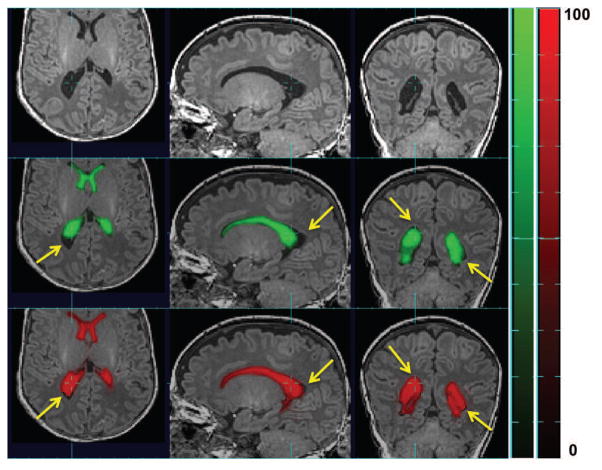
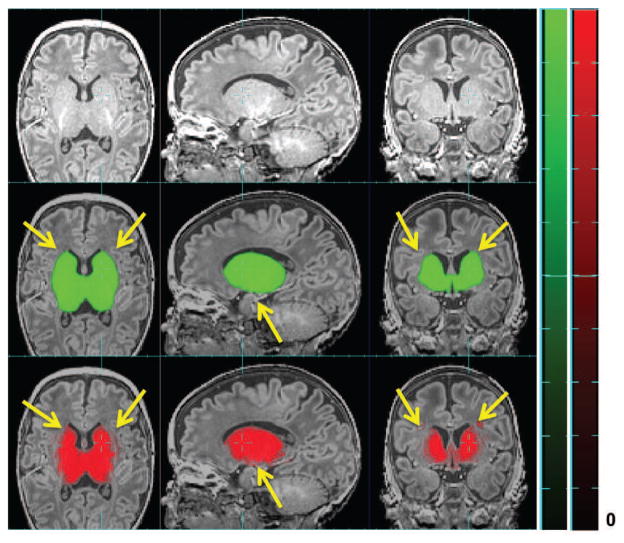
For each manually segmented subject, we constructed a corresponding spatio-temporal atlas using the other 31 scans in the dataset and synthesized A-TPM. Next, we transformed the A-TPM into the space of the scan to be segmented to obtain the . The first row in Figure 6 gives an example of s of 5 tissue classes for one scan. The patch-based tissue probability was computed using the following parameters: a patch size of 3 × 3 × 3 voxels and a search neighborhood ratio of 0.0025. The second row of Figure 6 presents an example of patch-based tissue probability map of 5 tissue classes for one scan. Compared to the atlas-based tissue probabilities, the less defined tissue boundaries of patch-based tissue probabilities would allow the EM labeling more freedom to adapt to unseen anatomies in the new subject to be segmented. Figures 7, 8 and 9 illustrate the complementary strengths of these two tissue probabilities. The patch-based prior has superior performance over the atlas-based prior in cases of normal inter-subject variations in GM as shown in Figure 7. This is because each subject’s unique cortical folding in GM cannot be fully captured by the atlas constructed from only a limited set of scans. Figure 8 shows a scan of a subject with ventriculomegaly, where the abnormally enlarged ventricles were not captured in the atlas constructed from healthy subjects. Therefore, the atlas-based approach fails to accurately estimate the tissue probability of the ventricular regions. However, the clear boundary of the ventricles allowed the patch-based approach to generate a more anatomically viable tissue probability estimation in this case. In tissue classes without clear boundaries or less variant inter-subject intensity differences, such as DGM as shown in Figure 9, atlas-based tissue probability estimation demonstrated higher accuracy than patch-based tissue probability.
Figure 6.
Examples of running priors. From left to right: Raw MR image (column 1), atlas-based ( ) (column 2), patch-based (column 3) and PBAEM (column 4) tissue probability map of, from top to bottom, GM, WM, VENT, DGM and sCSF of one subject as an example. Tissue probability on a scale 0 – 100. Red arrows: PBAEM tissue probability is more accurate than the atlas-based one; Blue arrows: PBAEM tissue probability is more accurate than the patch-based one.
Figure 7.
Raw MR image overlaid (top row) with atlas-based tissue probability map ( ) (middle row) and patch-based (bottom row) tissue probability map of GM in one subject. Here tissue probability is scaled by 100. Yellow arrows point where patch-based TP is more accurate than atlas-based one.
Figure 8.
Raw MR image overlaid (top row) with atlas-based tissue probability map ( ) (middle row) and patch-based (bottom row) tissue probability map of VENT in one subject with ventriculomegaly. Here tissue probability is scaled by 100. Yellow arrows point where patch-based TP is more accurate than atlas-based one.
Figure 9.
Raw MR image overlaid (top row) with atlas-based tissue probability map ( ) (middle row) and patch-based (bottom row) tissue probability map of DGM in one subject. Here tissue probability is scaled by 100. Yellow arrows point where patch-based TP is less accurate than atlas-based one.
4.1.3. Spatially Adapted Tissue Probability Prior Age-Specific Spatially Varying PC Map
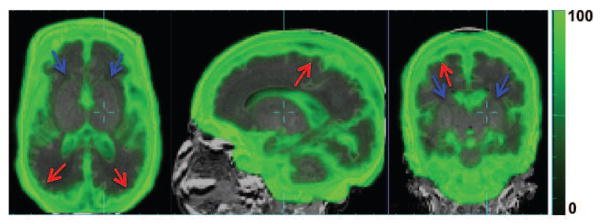
The PC maps in Figure 10 demonstrate the additional information that is introduced by the patch-based search. In cortical regions (e.g. sCSF/GM boundaries and GM/WM boundaries), the uniqueness of MR intensities of different tissue regions is high. Therefore, the intensity-based local patch search can better distinguish between tissues. This is reflected in the high PC values in these regions. In contrast, at WM/DGM boundaries where there is low MR intensity contrast, the patch based search could not reliably separate WM and DGM. The lower PC values here reflects the decreased reliability and utility of the patch-based search. The PC has its lowest value inside uniform regions, such as inside WM and DGM, where the patch-based tissue probabilities, by definition, are the same as the atlas-based tissue probabilities. Therefore, little additional information can be introduced by incorporating the patch-based search.
Figure 10.
Age-specific Patch Contribution (PC) map (green) overlaid over raw MR image (grayscale). PC values are on a scale of 0–100%. Red arrows: high PC values in cortical regions at sCSF/GM and GM/WM boundaries. Blue arrow: low PC values at WM/DGM boundary and inside WM, DGM.
Age-Specific Spatially Varying VLA Map
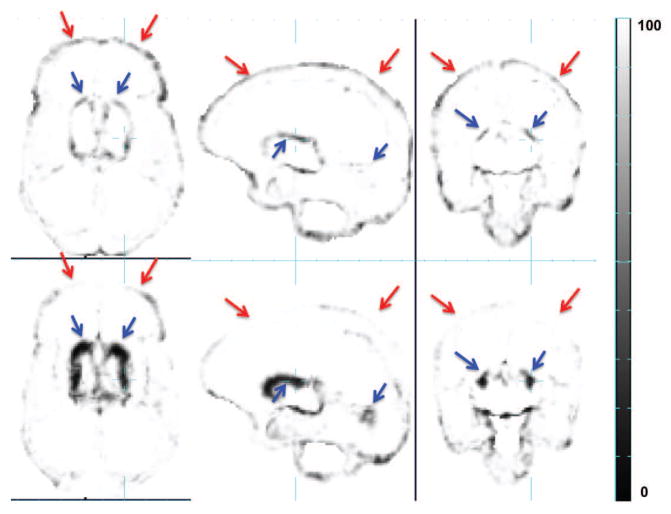
The VLA maps in Figure 11 illustrate the complementary strengths of atlas- and patch-based tissue probability estimates. We can see that at GM-WM boundaries, the patch-based tissue probabilities are more accurate (shown as higher intensity in the VLA map) compared to the atlas-based tissue probabilities, while at DGM-WM boundaries, they are less accurate. The patch-based estimates tend to be more accurate where there is a clear tissue boundary or the inter-subject variation is large, such as GM, WM, VENT and sCSF. In tissue classes like DGM whose boundary does not have high intensity contrast, or where little inter-subject variation is present, atlas-based estimation of tissue probability tends to be more accurate. VLA maps succeed in measuring these differences in accuracy levels on a voxel basis, allowing us to optimally combine the two tissue probabilities at a voxel level.
Figure 11.
Comparison between Voxel Label Accuracy (VLA) maps resulting from EM segmentation using atlas-based (top row) and patch-based (bottom row) tissue probabilities as running priors. VLA values are on a scale of 0–100%. Red arrows: patch-based tissue probabilities is more accurate at sCSF/GM and GM/WM boundaries; Blue arrows: atlas-based tissue probabilities is more accurate at DGM/WM boundaries.
Patch-based Augmented Prior
Figure 6 compares the spatially adapted tissue probability (bottom row) with the atlas- (top row) and patch-based (middle row) tissue probability map of 5 tissue classes of one subject. We show that the patch-based augmentation of atlas-based tissue probabilities takes advantage of the complimentary strengths of both the atlas-based and the patch-based methods, improving accuracy in GM, WM, VENT and sCSF compared to atlas-based TP and in DGM compared to patch-based TP.
4.1.4. Comparison with Conventional Segmentation Techniques
Average DSCs for 5 tissue classes of the 31 scans were computed and compared among using atlas-, patch-based and PBAEM prior in the EM algorithm and a baseline direct patch-based segmentation. Column 2 and 5 in Table 1 shows the comparison of average DSCs between the conventional atlas-based EM segmentation and the PBAEM approach. On average, the PBAEM approach significantly (p < 0.05) improved the segmentation accuracy in GM, WM, VENT and sCSF compared to the conventional atlas-based EM segmentation. Although we see a significant (p < 0.05) decrease in accuracy in the DGM, the amount of decrease is less that 1%. This was due to the fact that our PBAEM-based method improves the automated segmentation for tissues with high boundary contrast and large inter-subject intensity variation. However, the boundaries of DGM are less distinguishable and inter-subject intensities less variant than GM, WM, VENT and sCSF.
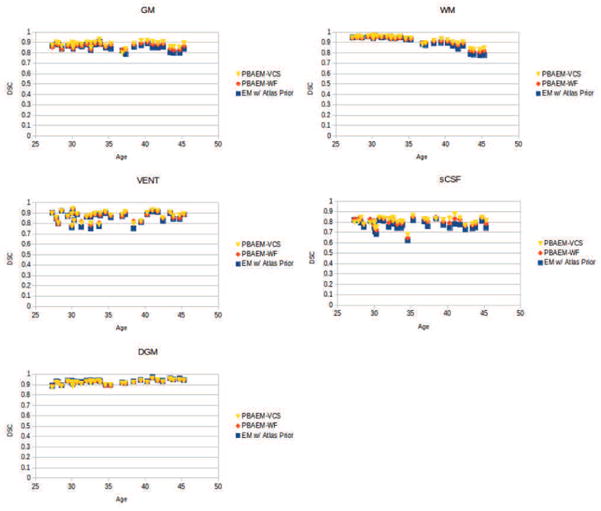
Figure 12 plots individual DSCs with age of five tissue classes. For most subjects, we can see an significant improvement in DSC in GM (26/31), WM (15/31), VENT (23/31) and sCSF (31/31). In addition, a trend of decreasing segmentation accuracy with age is shown in WM, while for GM, VENT, sCSF and DGM, comparable segmentation accuracy is obtained regardless of age. This may reflect the fact that white matter myelineation and increasing level of cortical folding makes older scans more difficult to segment.
Figure 12.
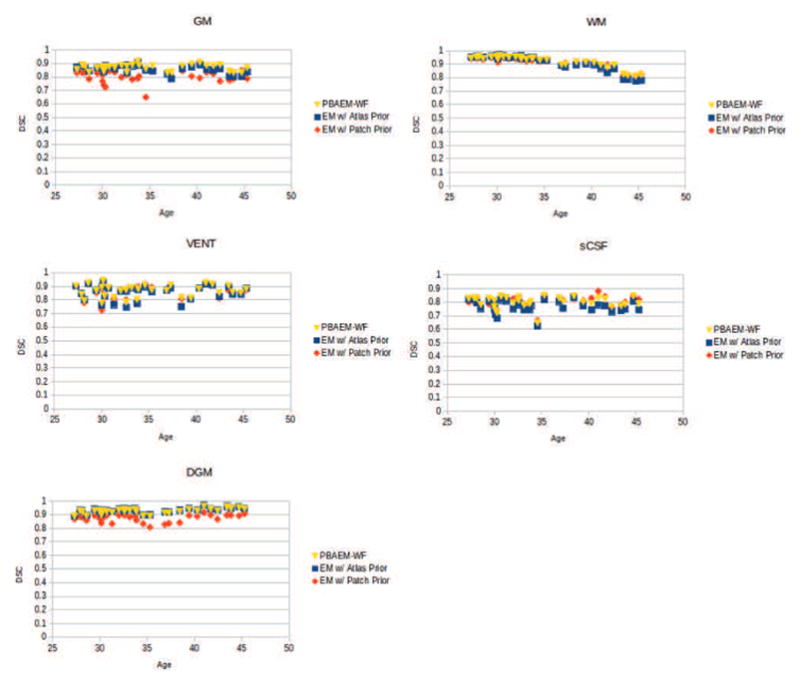
DSCs of five tissue classes of 31 individual scans plotted with age.
Figure 13 gives an example of the improved automated labeling at GM-WM boundaries compared to the conventional atlas-based EM method. Figure 14 illustrates that our proposed PBAEM approach produced a more anatomically correct automated labeling for the ventricular regions compared to the atlas-based EM segmentation approach.
Figure 13.
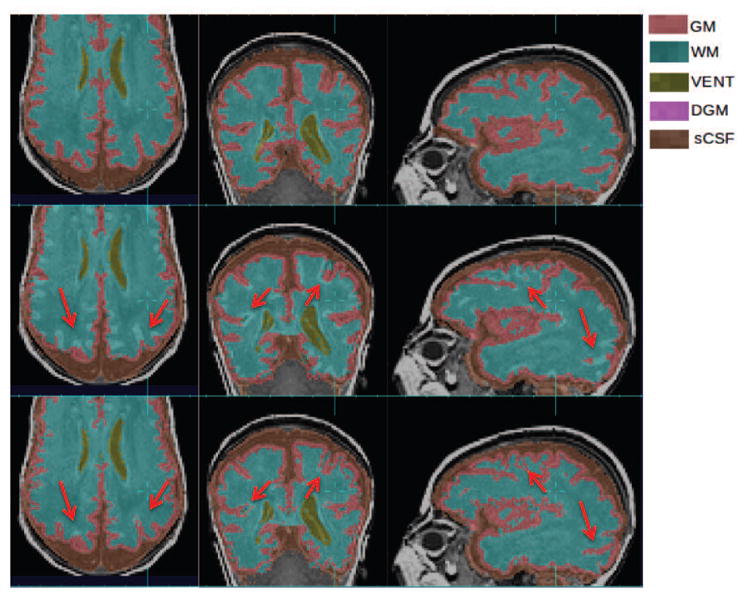
Improvements of GM and WM segmentation in a subject where the cortex is significantly more folded than the age-specific average template. Top row: manual segmentation; Middle row: atlas-based automatic segmentation (DSC: GM 0.7580, WM 0.8882); Bottom row: PBAEM (DSC: GM 0.8477 with improvement of 0.0897, WM 0.9151 with improvement of 0.0269). Red arrows: GM-WM boundaries where PBAEM was proved to generate more accurate labeling than atlas-based approach.
Figure 14.
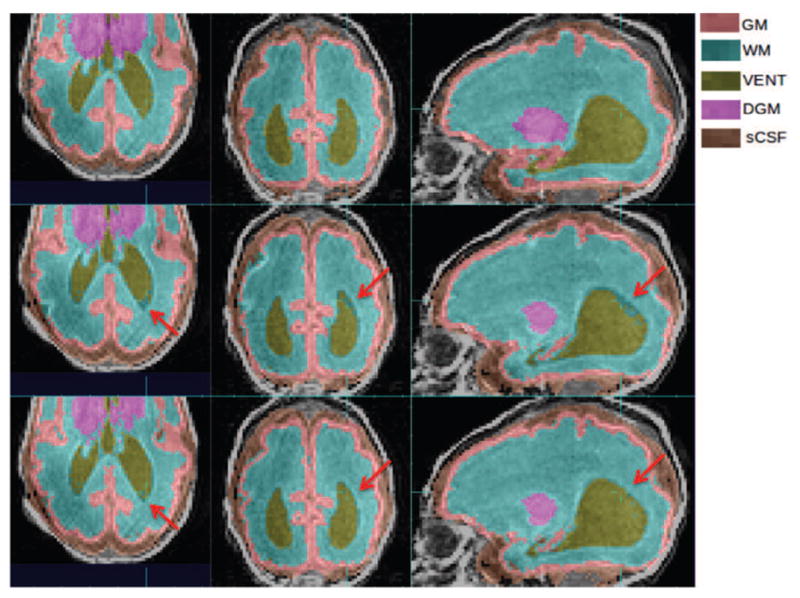
Improvements of VENT segmentation in a subject where VENT is significantly larger than the age-specific average template. Top row: manual segmentation; Middle row: atlas-based automatic segmentation (DSC: VENT: 0.9191); Bottom row: PBAEM (DSC: VENT 0.9364 with improvement of 0.0173).Red arrows: VENT boundaries where PBAEM was found to generate more accurate labeling than the atlas-based approach.
Column 4 and 5 in Table 1 shows the comparison of average DSCs using EM with patch-based prior alone and with the fully optimized PBAEM prior. It is clear that the segmentation accuracy improved in most tissue classes using PBAEM compared to only using the patch-based prior except for sCSF where is minimally reduced.
4.1.5. Application to Unseen Abnormal Cases
To further test the robustness of our proposed algorithm when applied to unseen abnormal cases that are significantly different from those in the atlas, we constructed a spatio-temporal atlas using all 32 atlas subjects and applied our method on a non-atlas subject with severe ventriculomegaly and Grade 2 intraventricular hemorrhage (IVH). Figure 15 illustrates the comparison of the performances between PBAEM and the conventional atlas-based approach. As a result of this scan’s anatomy drastically varying from the spatio-temporal atlas constructed from healthy subjects, the atlas-based approach failed to generate an acceptable automated tissue labeling, as seen in the middle row of Figure 15. In particular, the abnormally enlarged ventricular regions were not captured. The bottom row of Figure 15 shows the ability of our proposed PBAEM approach to adapt to the unseen anatomies which greatly differed from the atlas. The abnormal ventricular regions were more accurately contoured and the blood clot was partially labeled as non-brain background (BG) based on its abnormal intensity at its location.
Figure 15.
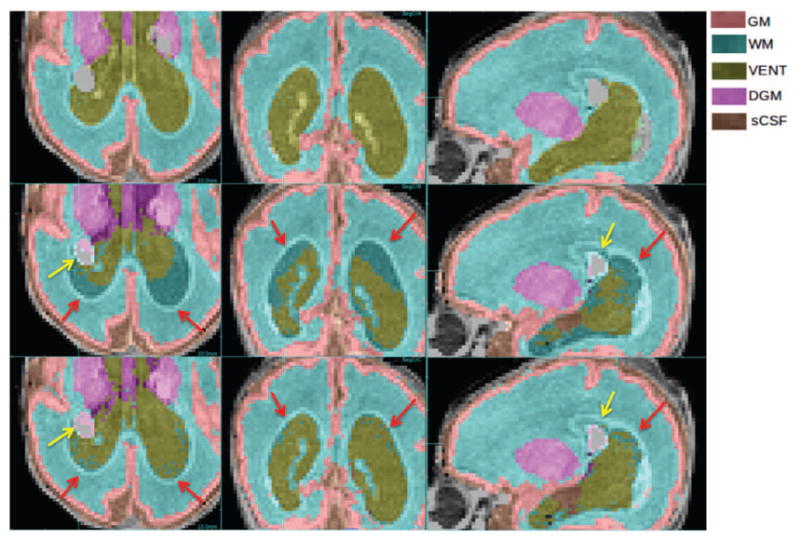
Labeling of abnormal anatomy not represented in the atlas. Comparison of manual labeling (top row), conventional atlas-based (middle row) and PBAEM (bottom row) automated labeling in a case of severe ventriculomegaly and Grade 2 IVH. Red arrows: PBAEM approach produced a more valid and accurate labeling of the enlarged VENT; Yellow arrows: IVH was partially labeled as BG. DSC: Atlas-based: GM 0.88, WM 0.90, VENT 0.64, DGM 0.82, sCSF 0.80; PBAEM: GM 0.88, WM 0.93,VENT 0.83, DGM 0.84, SCSF 0.82.
4.2. PBAEM-SVS
4.2.1. Patch Search Range Threshold Selection
Experiments were conducted using different search ranges of from 1.5 to 3.0 times of variability at each voxel. The average and standard deviation of DSC of 31 subjects are compared, as shown in Figure 16. We can see that the segmentation performance improves with increasing search range until an optimal threshold, and then decreases. When the patch search range is smaller than the optimum, it is not large enough to cover most potential matching voxels. However, when the search range is too broad, the tissue probabilities of the best matches will be diluted by the non-matches. In order to balance the performances of all tissue classes, a threshold of 2.0 was used in the remaining experiments.
Figure 16.
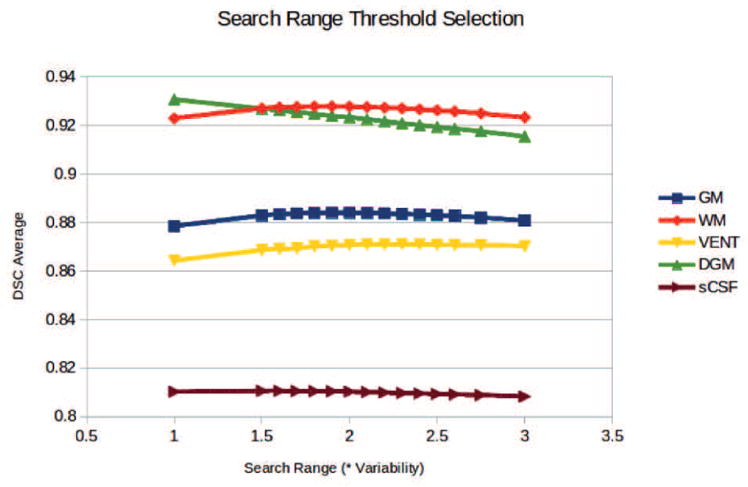
Average (left) and standard deviation (right) of DSC of 31 subjects using different search range threshold.
4.2.2. Age-Specific Variability Map
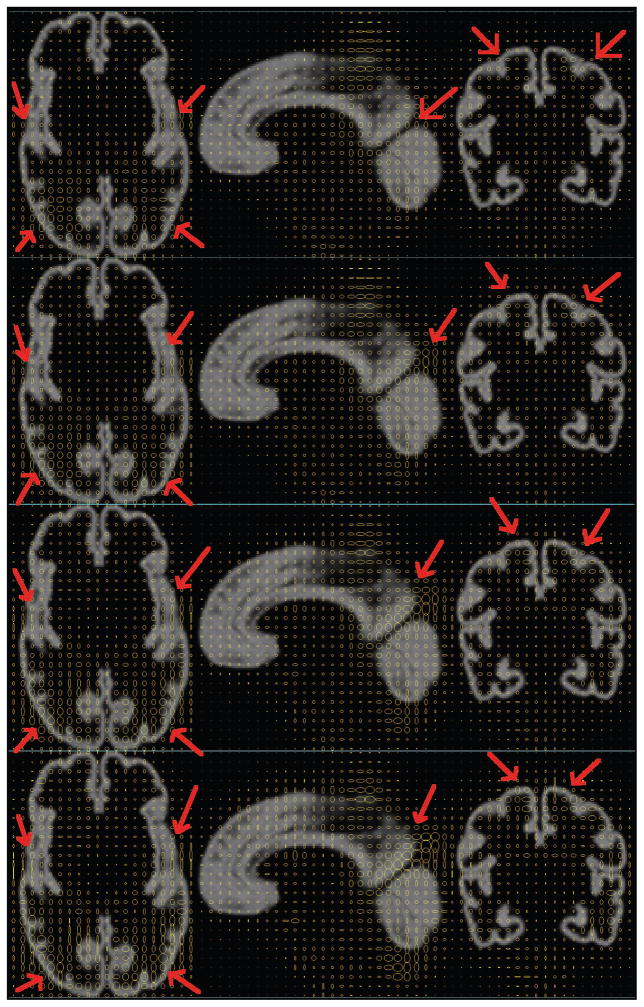
Synthesized age-specific variability maps at four different gestational ages are shown and compared in Figure 17 to visualize the age effect on variability in neonatal brain MRIs. We can clearly see that the variability at cortical regions dramatically grows with age, especially at major cortical gyrifications (red arrows).
Figure 17.
Age-specific variability maps shown as 2D ellipses overlying on average MR image in REF space. 1st row: 30.0 GW; 2nd row: 35.0 GW; 3rd row: 40.0 GW; 4th row: 45.0 GW. Red arrows: dramatic variability range change with age.
4.2.3. Patch-based Tissue Probability with Locally Constrained Search
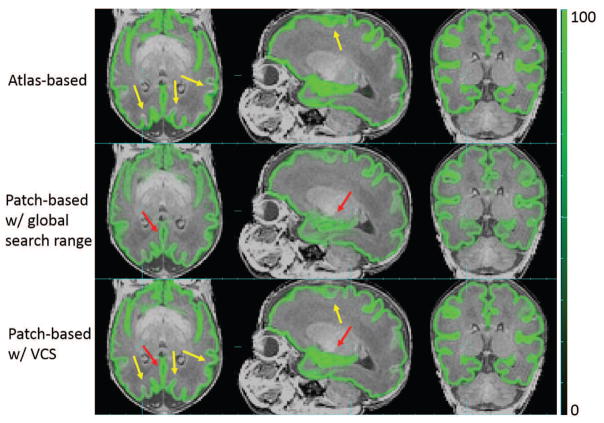
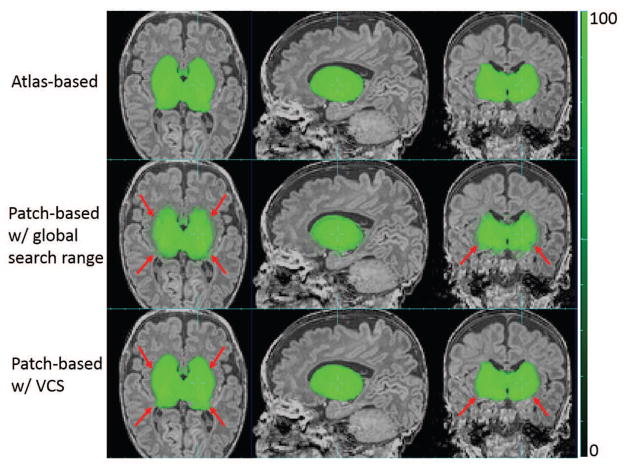
Using the threshold of search range chosen above, patch-based tissue probability was computed for each voxel in the scan being studied. Figure 18 shows the comparison of GM tissue probability between the atlas-based, patch-based using a global search range as in PBAEM-WF and using a locally defined search range as in PBAEM-SVS. Compared to atlas-based tissue probability, the SVS patch-based tissue probability demonstrates higher accuracy at cortical GM (pointed by yellow arrows). Compared to a patch-based tissue probability using a globally defined search range, SVS patch-based tissue probability shows superior accuracy in the region of the Hippocampus (red arrow) and sharper tissue probability boundaries in GM as a whole.
Figure 18.
Comparison of GM tissue probabilities between atlas-based, patch-based with globally and locally set search ranges. Red arrows: SVS patch-based TP better than patch-based with global search range; Yellow arrows: SVS patch-based TP superior to the atlas-based TP.
Figure 19 shows the improvement in estimating the tissue probability in regions with less variation. Since the variability is low in DGM, the SVS range is also small. Thus, in such regions, the patch-augmented tissue probability is dominated by the atlas-based tissue probability of its closest neighbor and will not be further diluted. This illustrates one of the major advantages of a locally constrained patch-based search that implicitly combines the atlas and patch priors by simply modifying the search range.
Figure 19.
Comparison of DGM tissue probabilities between atlas-based, patch-based with globally and locally set search ranges. Red arrows: SVS patch-based TP superior to the patch-based TP with global search range.
4.2.4. Comparison with PABEM-WF
The final automated tissue segmentations were compared between PBAEM-SVS and all other four methods. Column 5 and 6 in Table 1 compares the average DSC of 31 subjects between PBAEM-WF and PBAEM-SVS. We can see that the segmentation accuracy is significantly (p < 0.05) improved using PBAEM-SVS, especially in cortical GM. However, in GM and VENT, the standard deviations are slightly higher than using PBAEM-WF, these differences are minimal. Compared to the baseline atlas-based EM segmentation (Column 2 in Table 1), we see significantly (p < 0.05) improved DSC in GM, WM, VENT and sCSF, while maintain comparable accuracy in DGM.
Figure 20 gives an example of improvement in automatic labeling of GM when using PBAEM-SVS compared to PBAEM-WF. In the corpus callosum (blue arrows), due to WM myelination, the intensity is similar to cortical GM in its neighborhood. If the search range is too big, it will be more likely to be labeled as cortical GM instead of WM as in PBAEM-WF. However, using PBAEM-SVS, we are able to learn that the variability in corpus callosum is low, and thus, the patch-based search will be conducted more locally to avoid mislabeling.
Figure 20.
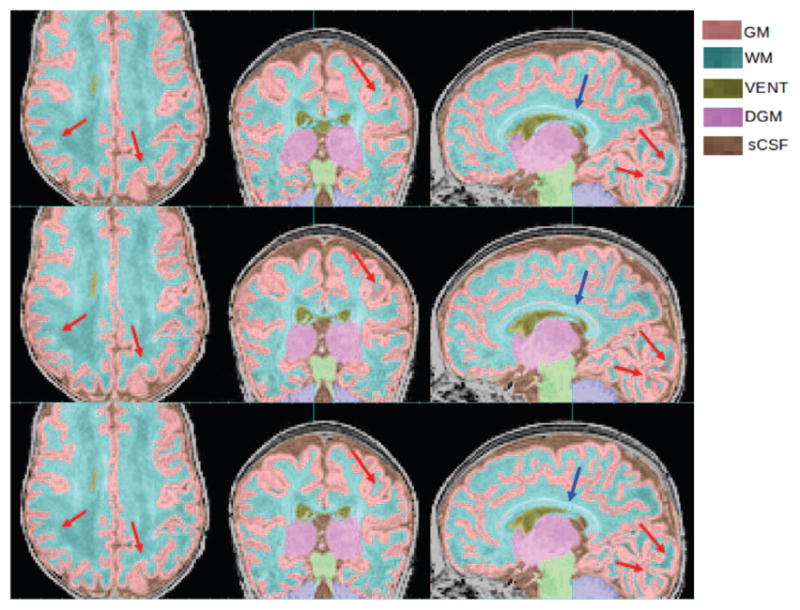
Improvements of GM and WM segmentation in a subject where the cortex is significantly more folded than the age-specific average template. Top row: manual segmentation; Middle row: PBAEM-WF (DSC: GM 0.8946, WM 0.9153); Bottom row: PBAEM-WF (DSC: GM 0.9171 with improvement of 0.0225, WM 0.9330 with improvement of 0.0177). Red arrows: Cortical GM-WM boundaries where PBAEM-SVS was proved to generate more accurate labeling than PBAEM-WF approach; Blue arrows: corpus callosum
Figure 21 provides a visualization of improvement of PBAEM-SVS compared to atlas-based segmentation and PBAEM-WF with different ages. Improvements are seen especially in later weeks of development, where segmentation errors were relatively larger using both atlas-based approach and PBAEM-WF. PBAEM-SVS helps to reduce inconsistency of segmentation accuracy across ages. However, in WM, we still see some decreasing DSC values at later ages that may be driven by WM myelination effects inducing local loss of WM contrast with its neighbors.
Figure 21.
DSCs of five tissue classes of 31 individual scans plotted with age. Comparison is shown between segmentation performances of conventional atlas-based EM approach, PBAEM-WF and PBAEM-SVS.
4.2.5. Application to Unseen Abnormal Cases
We further tested PBAEM-SVS on the abnormal scan with IVH. Figure 22 shows an example when the blood clot was mislabeled as brainstem (BS) by PBAEM-WF while was correctly labeled as BG by PBAEM-SVS. This is because, in PBAEM-SVS, the approach employed a smaller search range at the hemorrhage site (inside WM) than the globally defined search range in PBAEM-WF which captures more tissues. Therefore, the patch-based search was correctly limited in the BS region and gave a more accurate patch-based tissue probability estimate. However, this led to some increase in errors in the ventricles as subjects with such ventricular variability were not included in the atlas and therefore the shape variance was not learned. The next step in the work will be to add a range of such manually segmented subjects to the atlas data.
Figure 22.
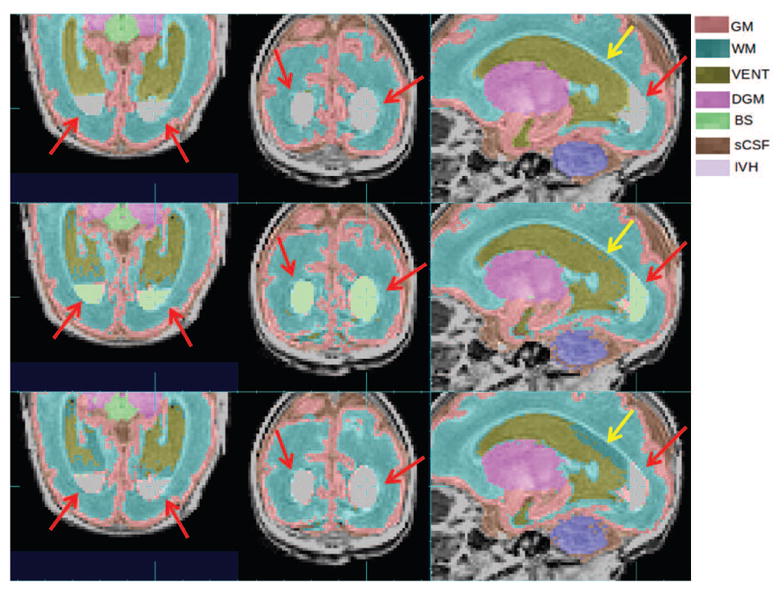
Comparison of PBAEM-WF and PBAEM-SVS on an abnormal scan with IVH. Red arrow: IVH mislabeled as BS by using PBAEM-WF while correctly labeled as BG by using PBAEM-SVS; Yellow arrows: mislabeled VENT as WM by PBAEM-SVS while correctly labeled by PBAEM-WF. DSC: Atlas-based: GM 0.84, WM 0.91, VENT 0.81, DGM 0.94, sCSF 0.76; PBAEM: GM 0.84, WM 0.91, VENT 0.84, DGM 0.93, sCSF 0.83.
4.3. Distance Evaluation
Based on comparison of DSC in Table 1, we see that PBAEM-SVS shows the most superior segmentation performance. Here we further computed and compared the average HD and MD (Table 2) between PBAEM-SVS and conventional atlas-based EM technique to show its superiority. We can see that in most cases, PBAEM-SVS provided better performance than the conventional age-specific atlas-based approach. The majority of the large errors we observe occurred outside brain tissue, e.g. around skull due to partial volume effect. This could be solved with a more accurate skull stripping or masking in the future.
Table 2.
Comparison of average HDs and MDs of 31 subjects between PBAEM-SVS and atlas-based EM technique. Lowest HDs and MDs are bold.
| Tissue Class | EM w/Atlas-based Prior | PBAEM-SVS | ||
|---|---|---|---|---|
| MD | HD | MD | HD | |
| GM | 0.17 ± 0.04 | 5.58 ± 1.11 | 0.13* ± 0.03 | 5.79 ± 1.19 |
| WM | 0.12 ± 0.10 | 5.67 ± 2.15 | 0.09* ± 0.06 | 5.64 ± 1.89 |
| VENT | 0.35 ± 0.30 | 23.61 ± 6.24 | 0.23* ± 0.15 | 19.78* ± 6.10 |
| sCSF | 0.31 ± 0.09 | 9.45 ± 1.90 | 0.26* ± 0.06 | 9.60 ± 1.88 |
| DGM | 0.08* ± 0.03 | 5.13 ± 9.62 | 0.09 ± 0.03 | 3.94 ± 0.89 |
indicates statistical significance with P < 0.05 from pair-wise two-tailed t-test between the two methods.
We also computed distance measurements of cortical GM by individual lobes (Table 3). We see that both methods achieved consistent results across different lobes and PABEM-SVS showed significant superiority in all lobes of the cortex. We also noted that segmentation accuracy in the occipital lobes was improved by using PBAEM-SVS over conventional age-specific atlas-based method.
Table 3.
Comparison of average HDs and MDs of 8 lobes of cortical GM from 31 subjects between PBAEM-SVS and atlas-based EM technique. Lowest HDs and MDs are bold.
| Lobe | EM w/ Atlas-based Prior | PBAEM-SVS | ||
|---|---|---|---|---|
| MD | HD | MD | HD | |
| Frontal R | 0.15 ± 0.04 | 4.25 ± 1.34 | 0.12* ± 0.03 | 4.38 ± 1.43 |
| Frontal L | 0.15 ± 0.04 | 4.43 ± 1.41 | 0.12* ± 0.03 | 4.43 ± 1.47 |
| Temporal R | 0.17 ± 0.04 | 4.16 ± 0.91 | 0.14* ± 0.04 | 4.05 ± 0.99 |
| Temporal L | 0.17 ± 0.05 | 4.00 ± 0.90 | 0.14* ± 0.04 | 3.91 ± 1.04 |
| Parietal R | 0.17 ± 0.07 | 4.40* ± 1.10 | 0.13* ± 0.06 | 4.90 ± 1.20 |
| Parietal L | 0.15 ± 0.05 | 3.95 ± 1.21 | 0.11* ± 0.03 | 4.24 ± 1.28 |
| Occipital R | 0.22 ± 0.07 | 4.20 ± 1.15 | 0.16* ± 0.06 | 4.07 ± 1.31 |
| Occipital L | 0.19 ± 0.06 | 3.93 ± 1.19 | 0.13* ± 0.04 | 3.70 ± 1.35 |
indicates statistical significance with P < 0.05 from pair-wise two-tailed t-test between the two methods.
5. Discussion and Conclusion
In this work, we propose two hybrid approaches that augment the conventional model-based EM segmentation technique for labeling rapidly developing brain anatomy. The proposed methods combine the strengths in both atlas- and patch-based approaches in order to obtain more accurate automated labeling of brain tissues. We introduce the patch-based tissue probability estimates as a representation of any new subject’s own anatomy within the atlas-based EM segmentation framework. In particular, we adapt the patch-based segmentation approach to use the parametric average estimate synthesized from the atlas as the patch-based dictionary images. Critically, this allows us to use atlases constructed with a relatively sparse distribution of manually segmented scans over a large developmental range. A series of experiments with challenging examples of MRI from a range of clinical cases of premature birth showed a superior performance of the proposed PBAEM framework over either the conventional atlas-based segmentation approach or the local patch-based methods. Successful application of PBAEM to the non-atlas abnormal cases demonstrates the validity of PC and VLA maps and also further highlighted its ability to adapt to the new unseen anatomies that are not captured in the atlas.
One of the limitations of these basic experiments is that we have not used all the subject-related information that is available. For example, in the current work, the birth age of the atlas subjects ranges from 24.9 to 31.4 GWs. Previous studies have shown that neonates born very prematurely (VPT) (less than 30 GW) [62, 40] and with low body weights (LBW) [40] may suffer from more severe neuro-developmental abnormalities compared to infants born less prematurely. Thus, incorporating such information into the model could allow us to further adjust the local patch-based search for the very premature neonates. Moreover, the age-at-scan of the atlas subjects are not evenly distributed within the whole age range from 27.2 to 46.4 GW, with particularly less density between 39 to 46 GW. Although the algorithm still produced anatomically valid automated tissue segmentations for that age range, we believe that the labeling accuracy in GM and WM could be improved further if more scans between 39 and 46 GW were included in the atlas to capture cortical variability.
Future work would also include improving the methods of combining tissue probabilities from different sources. The proposed approach has introduced priors and constraints from the sources other than the atlas itself into the conventional atlas-based EM automatic segmentation framework. A potential direction would be to incorporate priors acquired from other geometric models, such as the laminar structure model of the developing human fetal brain [22] and topological information as proposed by Rajchl et al. [45] for further improvement of the segmentation accuracy at earlier gestational ages and in fetuses. Another direction for advancement of PBAEM-SVS is to better learn and adapt the search range in cases of abnormalities, such as ventriculomegaly (Figure 22). Due to the fact that these abnormal features are not captured in the spatio-temporal atlas, using the variability map derived from the atlas, we could not automatically assign a larger search range in abnormal regions.
Another future direction is to carry out more extensive validation, especially on larger cross-scanner cross-acquisition datasets. Such validation is not included in this paper due to unavailability of any public dataset that fits the criterion. For example, due to the significant differences in tracing protocols, especially in cortical GM (see Appendix), we have not attempted the Neo-BrainS12 challenge [29]. We are currently building a premature neonatal brain MRI database with consistent manual tracing on scans acquired using scanners from different vendors in different sites with different MR acquisition parameters. Such database will enable us to conduct a more extensive validation of the proposed methods in the future. In addition, we can extend our validation to a full leave-one-out cross-validation on PC and VLA maps when computational resources become available. Alternatively, when more atlas training data becomes available, we can extend the validation to a leave-N-out cross-validation.
In terms of applications of our method, these automated tissue segmentation results on premature neonatal scans covering the full range of clinical ages provide a basis for a range of morphometric analyses of brain growth. In particular, they enable the study of local anatomical variations using deformation based or surface based morphometry that have so far not been able to be applied to large scale studies of the brain after premature birth. Such techniques for local anatomical mapping in premature neonates may reveal markers that are specific to given functional deficits later in life, that can help direct early cognitive interventions soon after birth.
Table 4.
Comparison of average HDs and MDs of 8 lobes of WM from 31 subjects between PBAEM-SVS and atlas-based EM technique. Lowest HDs and MDs are bold.
| Lobe | EM w/ Atlas-based Prior | PBAEM-SVS | ||
|---|---|---|---|---|
| MD | HD | MD | HD | |
| Frontal R | 0.10 ± 0.07 | 4.28 ± 1.78 | 0.08* ± 0.05 | 4.25 ± 1.58 |
| Frontal L | 0.09 ± 0.06 | 4.10 ± 1.06 | 0.08* ± 0.04 | 3.95 ± 0.94 |
| Temporal R | 0.12 ± 0.09 | 4.15 ± 1.69 | 0.10* ± 0.06 | 4.05 ± 1.42 |
| Temporal L | 0.12 ± 0.09 | 4.01 ± 1.22 | 0.10* ± 0.06 | 3.87 ± 1.13 |
| Parietal R | 0.13 ± 0.12 | 3.46 ± 1.32 | 0.09* ± 0.07 | 3.52 ± 1.58 |
| Parietal L | 0.12 ± 0.12 | 3.68 ± 1.20 | 0.09* ± 0.07 | 3.53 ± 1.50 |
| Occipital R | 0.18 ± 0.17 | 3.95* ± 1.34 | 0.13* ± 0.10 | 4.33 ± 1.56 |
| Occipital L | 0.19 ± 0.22 | 4.11 ± 2.28 | 0.13* ± 0.13 | 4.16 ± 1.90 |
indicates statistical significance with P < 0.05 from pair-wise two-tailed t-test between the two methods.
Highlights.
Hybrid methods for age consistent segmentation in premature neonates are proposed.
Approaches combine atlas- and patch-based methods for age-specific tissue labeling.
Validation against manual tracing over a large age range was conducted.
Results show significant improvement compared to conventional age-specific methods.
Acknowledgments
This work is supported by NIH grant NIH/NINDS R01 NS 061957. The imaging data used was acquired with support by Canadian Institutes for Health Research (CIHR) operating grant MOP-79262 (S.P.M.). S.P.M. is currently the Bloorview Children’s Hospital Chair in Pediatric Neuroscience and was supported by a Tier 2 Canada Research Chair in Neonatal Neuroscience, and Michael Smith Foundation for Health Research Scholar.
Appendix
In this section, we demonstrate the difference between tracing protocols between NeoBrainS12 [29] and ours. We tested on one 30W coronal scan from the NeoBrainS12 training dataset for which their tracing is available for comparison. Figure 23 below shows the differences between their manual labeling protocols and our segmentation. In particular in our tracing protocol we ensure that cortical GM is segmented over the whole brain surface. These are significant regions missing from the NeoBrainS12 data that would result in an invalid comparison of our method aimed at accurate cortical labeling. Both our manual tracing protocol and our automated segmentation detect this cortical ribbon in the NeoBrainS12 data even though it is missing from the NeoBrainS12 reference segmentation.
Figure 23.
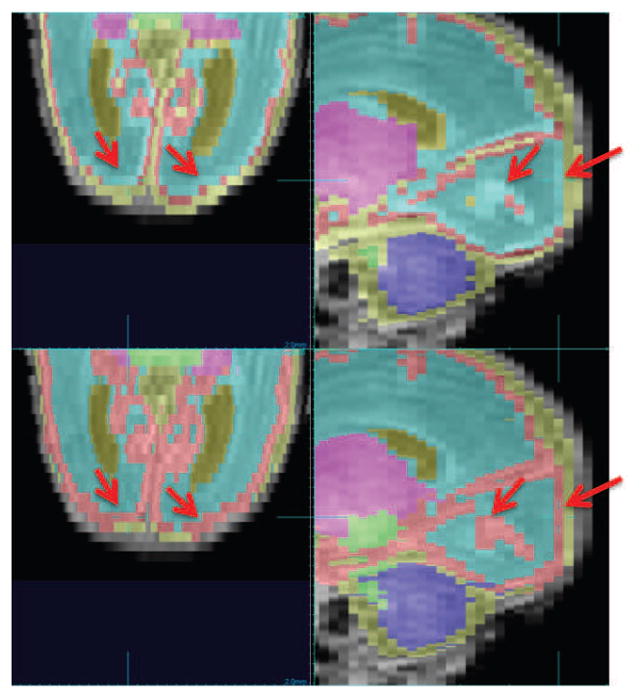
Comparison of segmentation protocols between NeoBrainS12 [29] (top row) and ours (bottom row). Red arrow: cortical GM where two tracing protocols differ.
Footnotes
Publisher's Disclaimer: This is a PDF file of an unedited manuscript that has been accepted for publication. As a service to our customers we are providing this early version of the manuscript. The manuscript will undergo copyediting, typesetting, and review of the resulting proof before it is published in its final citable form. Please note that during the production process errors may be discovered which could affect the content, and all legal disclaimers that apply to the journal pertain.
References
- 1.Aljabar P, Heckemann RA, Hammers A, Hajnal JV, Rueckert D. Multi-atlas based segmentation of brain images: atlas selection and its effect on accuracy. NeuroImage. 2009;46:726–738. doi: 10.1016/j.neuroimage.2009.02.018. [DOI] [PubMed] [Google Scholar]
- 2.Anbeek P, Isgum I, van Kooij BJM, Mol CP, Kersbergen KJ, Groenendaal F, Viergever MA, de Vries LS, Benders MJNL. Automatic segmentation of eight tissue classes in neonatal brain MRI. PLoS ONE. 2013;8(12):e81895. doi: 10.1371/journal.pone.0081895. [DOI] [PMC free article] [PubMed] [Google Scholar]
- 3.Artaechevarria X, Munoz-Barrutia A, Ortizde Solórzano C. Combination strategies in multi-atlas image segmentation: Application to brain mr data. Medical Imaging, IEEE Transactions on. 2009;28:1266–1277. doi: 10.1109/TMI.2009.2014372. [DOI] [PubMed] [Google Scholar]
- 4.Ashburner J, Friston KJ. Unified segmentation. NeuroImage. 2005;26:839–851. doi: 10.1016/j.neuroimage.2005.02.018. http://dx.doi.org/10.1016/j.neuroimage.2005.02.018. [DOI] [PubMed] [Google Scholar]
- 5.Asman AJ, Landman BA. Non-local statistical label fusion for multi-atlas segmentation. Medical image analysis. 2013;17:194–208. doi: 10.1016/j.media.2012.10.002. [DOI] [PMC free article] [PubMed] [Google Scholar]
- 6.Bai W, Shi W, O’Regan DP, Tong T, Wang H, Jamil-Copley S, Peters NS, Rueckert D. A probabilistic patch-based label fusion model for multi-atlas segmentation with registration refinement: application to cardiac mr images. Medical Imaging, IEEE Transactions on. 2013;32:1302–1315. doi: 10.1109/TMI.2013.2256922. [DOI] [PubMed] [Google Scholar]
- 7.BSP, BV, LHS, et al. Regional brain volume abnormalities and long-term cognitive outcome in preterm infants. JAMA. 2000;284:1939–1947. doi: 10.1001/jama.284.15.1939. [DOI] [PubMed] [Google Scholar]
- 8.Buades A, Coll B, Morel JM. A review of image denoising algorithms, with a new one. Multi-scale Modeling & Simulation. 2005;4:490–530. [Google Scholar]
- 9.Cabezas M, Oliver A, Llad X, Freixenet J, Cuadra MB. A review of atlas-based segmentation for magnetic resonance brain images. Computer Methods and Programs in Biomedicine. 2011;104:e158–e177. doi: 10.1016/j.cmpb.2011.07.015. http://dx.doi.org/10.1016/j.cmpb.2011.07.015. [DOI] [PubMed] [Google Scholar]
- 10.Cardoso MJ, Melbourne A, Kendall GS, Modat M, Robertson NJ, Marlow N, Ourselin S. AdaPT: An adaptive preterm segmentation algorithm for neonatal brain MRI. NeuroImage. 2013;65:97–108. doi: 10.1016/j.neuroimage.2012.08.009. [DOI] [PubMed] [Google Scholar]
- 11.Choe Ms, Ortiz-Mantilla S, Makris N, Gregas M, Bacic J, Haehn D, Kennedy D, Pienaar R, Caviness VS, Benasich AA, Grant PE. Regional infant brain development: An MRI-based morphometric analysis in 3 to 13 month olds. Cerebral Cortex. 2013;23:2100–2117. doi: 10.1093/cercor/bhs197. [DOI] [PMC free article] [PubMed] [Google Scholar]
- 12.Cocosco CA, Zijdenbos AP, Evans AC. A fully automatic and robust brain MRI tissue classification method. Medical Image Analysis. 2003;7:513–527. doi: 10.1016/s1361-8415(03)00037-9. [DOI] [PubMed] [Google Scholar]
- 13.Coupe P, Manjon J, Fonov V, Pruessner J, Robles M, Collins DL. Patch-based segmentation using expert priors: Application to hippocampus and ventricle segmentation. NeuroImage. 2011;54:940–954. doi: 10.1016/j.neuroimage.2010.09.018. [DOI] [PubMed] [Google Scholar]
- 14.Eskildsen SF, Coupe P, Fonov V, Manjon JV, Leung KK, Guizard N, Wassef SN, Ostergaard LR, Collins DL. BEaST: Brain extraction based on nonlocal segmentation technique. NeuroImage. 2012;59:2362–2373. doi: 10.1016/j.neuroimage.2011.09.012. [DOI] [PubMed] [Google Scholar]
- 15.Giedd JN. Structural magnetic resonance imaging of the adolescent brain. Annals of the New York Academy of Sciences. 2004;1021:77–85. doi: 10.1196/annals.1308.009. [DOI] [PubMed] [Google Scholar]
- 16.Giedd JN, Blumenthal J, Jeffries NO, Castellanos FX, Liu H, Zijdenbos A, Paus T, Evans AC, Rapoport JL. Brain development during childhood and adolescence: a longitudinal MRI study. Nature neuroscience. 1999;2:861–863. doi: 10.1038/13158. [DOI] [PubMed] [Google Scholar]
- 17.Glenn OA. Normal development of the fetal brain by MRI. Seminars in Perinatology. 2009;33:208–219. doi: 10.1053/j.semperi.2009.04.009. http://dx.doi.org/10.1053/j.semperi.2009.04.009. Advances in Fetal Neuroimaging. [DOI] [PubMed] [Google Scholar]
- 18.Good C, Johnsrude I, Ashburner J, Henson R, Fristen K, Frackowiak RSJ. A voxel-based morphometric study of ageing in 465 normal adult human brains. Biomedical Imaging, 2002; 5th IEEE EMBS International Summer School on; 2002. p. 16. [DOI] [PubMed] [Google Scholar]
- 19.Gousias IS, Hammers A, Counsell SJ, Srinivasan L, Rutherford MA, Heckemann RA, Hajnal JV, Rueckert D, Edwards AD. Magnetic resonance imaging of the newborn brain: automatic segmentation of brain images into 50 anatomical regions. PloS ONE. 2013;8:e59990. doi: 10.1371/journal.pone.0059990. [DOI] [PMC free article] [PubMed] [Google Scholar]
- 20.Greenspan H, Ruf A, Goldberger J. Constrained gaussian mixture model framework for automatic segmentation of mr brain images. Medical Imaging, IEEE Transactions on. 2006;25:1233–1245. doi: 10.1109/tmi.2006.880668. [DOI] [PubMed] [Google Scholar]
- 21.Habas P, Kim K, Corbett-Detig J, Rousseau F, Glenn O, Barkovich A, Studholme C. A spatiotemporal atlas of MR intensity, tissue probability and shape of the fetal brain with application to segmentation. NeuroImage. 2010a;53:460–470. doi: 10.1016/j.neuroimage.2010.06.054. [DOI] [PMC free article] [PubMed] [Google Scholar]
- 22.Habas PA, Kim K, Chandramohan D, Rousseau F, Glenn OA, Studholme C. Statistical model of laminar structure for atlas-based segmentation of the fetal brain from in utero MR images. Proc. SPIE Medical Imaging: Image Processing; 2009. pp. 725917–8. [Google Scholar]
- 23.Habas PA, Kim K, Rousseau F, Glenn OA, Barkovich AJ, Studholme C. Atlas-based segmentation of developing tissues in the human brain with quantitative validation in young fetuses. Human Brain Mapping. 2010b;31:1348–1358. doi: 10.1002/hbm.20935. [DOI] [PMC free article] [PubMed] [Google Scholar]
- 24.Hamilton B, Martin J, Osterman M, Curtin S. Births: Preliminary data for 2013. National vital statistics reports. 2014;63:1–19. [PubMed] [Google Scholar]
- 25.Heckemann RA, Hajnal JV, Aljabar P, Rueckert D, Hammers A. Automatic anatomical brain MRI segmentation combining label propagation and decision fusion. NeuroImage. 2006;33:115–126. doi: 10.1016/j.neuroimage.2006.05.061. [DOI] [PubMed] [Google Scholar]
- 26.Huppi PS, Warfield S, Kikinis R, Barnes PD, Zientara GP, Jolesz FA, Tsuji MK, Volpe JJ. Quantitative magnetic resonance imaging of brain development in premature and mature newborns. Annals of Neurology. 1998;43:224–235. doi: 10.1002/ana.410430213. [DOI] [PubMed] [Google Scholar]
- 27.Huttenlocher DP, Klanderman GA, Rucklidge WJ. Comparing images using the Hausdorff distance. Pattern Analysis and Machine Intelligence, IEEE Transactions on. 1993;15:850–863. [Google Scholar]
- 28.Inder TE, Wells SJ, Mogridge NB, Spencer C, Volpe JJ. Defining the nature of the cerebral abnormalities in the premature infant: a qualitative magnetic resonance imaging study. The Journal of Pediatrics. 2003;143:171–179. doi: 10.1067/S0022-3476(03)00357-3. [DOI] [PubMed] [Google Scholar]
- 29.Isgum I, Benders M, Avants B, Cardoso M, Counsell S, Gomez EF, Gui L, Huppi PS, Kersbergen K, Makropoulos A, Melbourne A, Moeskops P, Mol C, Kuklisova-Murgasova M, Rueckert D, Schnabel J, Srhoj-Egekher V, Wu J, Wang S, de Vries L, Viergever M. Evaluation of automatic neonatal brain segmentation algorithms: the NeoBrainS12 challenge. Medical Image Analysis. 2015;20:135–151. doi: 10.1016/j.media.2014.11.001. [DOI] [PubMed] [Google Scholar]
- 30.Kapellou O, Counsell SJ, Kennea N, Dyet L, Saeed N, Stark J, Maalouf E, Duggan P, Ajayi-Obe M, Hajnal J, Allsop JM, Boardman J, Rutherford MA, Cowan F, Edwards AD. Abnormal cortical development after premature birth shown by altered allometric scaling of brain growth. PLoS Med. 2006;3:e265. doi: 10.1371/journal.pmed.0030265. [DOI] [PMC free article] [PubMed] [Google Scholar]
- 31.Katkovnik V, Foi A, Egiazarian K, Astola J. From local kernel to nonlocal multiple-model image denoising. International journal of computer vision. 2010;86:1–32. [Google Scholar]
- 32.Kidokoro H, Anderson PJ, Doyle LW, Woodward LJ, Neil JJ, Inder TE. Brain injury and altered brain growth in preterm infants: Predictors and prognosis. Pediatrics. 2014;134:e444–e453. doi: 10.1542/peds.2013-2336. [DOI] [PubMed] [Google Scholar]
- 33.Leemput KV, Maes F, Vandermeulen D, Suetens P. Automated model-based tissue classification of MR images of the brain. IEEE Trans Med Imaging. 1999a;18(10):897–908. doi: 10.1109/42.811270. [DOI] [PubMed] [Google Scholar]
- 34.Leemput KV, Maes F, Vandermeulen D, Suetens P. Automated model-based tissue classification of MR images of the brain. IEEE Transactions on Medical Imaging. 1999b;18:897–908. doi: 10.1109/42.811270. [DOI] [PubMed] [Google Scholar]
- 35.Lenroot RK, Giedd JN. Brain development in children and adolescents: insights from anatomical magnetic resonance imaging. Neuroscience & Biobehavioral Reviews. 2006;30:718–729. doi: 10.1016/j.neubiorev.2006.06.001. [DOI] [PubMed] [Google Scholar]
- 36.Liu M, Seshamani S, Harrylock L, Kitsch A, Miller S, Chau V, Poskitt K, Rousseau F, Studholme C. Spatially adapted augmentation of age-specific atlas-based segmentation using patch-based priors. SPIE Medical Imaging, International Society for Optics and Photonics; 2014. pp. 90341H–90341H. [Google Scholar]
- 37.Makropoulos A, Gousias IS, Ledig C, Aljabar P, Serag A, Hajnal JV, Edwards AD, Counsell SJ, Rueckert D. Automatic whole brain MRI segmentation of the developing neonatal brain. Medical Imaging, IEEE Transactions on. 2014;33(9):1818–1831. doi: 10.1109/TMI.2014.2322280. [DOI] [PubMed] [Google Scholar]
- 38.Marlow N. Neurocognitive outcome after very preterm birth. Archives of Disease in Childhood -Fetal and Neonatal Edition. 2004;89:F224–F228. doi: 10.1136/adc.2002.019752. [DOI] [PMC free article] [PubMed] [Google Scholar]
- 39.Matsuzawa J, Matsui M, Konishi T, Noguchi K, Gur RC, Bilker W, Miyawaki T. Age-related volumetric changes of brain gray and white matter in healthy infants and children. Cerebral Cortex. 2001;11:335–342. doi: 10.1093/cercor/11.4.335. [DOI] [PubMed] [Google Scholar]
- 40.Mirmiran M, Barnes PD, Keller K, Constantinou JC, Fleisher BE, Hintz SR, Ariagno RL. Neonatal brain magnetic resonance imaging before discharge is better than serial cranial ultrasound in predicting cerebral palsy in very low birth weight preterm infants. Pediatrics. 2004;114:992–998. doi: 10.1542/peds.2003-0772-L. [DOI] [PubMed] [Google Scholar]
- 41.Pham DL, Prince JL. Information Processing in Medical Imaging. Springer; 1999. An adaptive fuzzy segmentation algorithm for three-dimensional magnetic resonance images; pp. 140–153. [DOI] [PubMed] [Google Scholar]
- 42.Pohl KM, Fisher J, Bouix S, Shenton M, Mc-Carley RW, Grimson WEL, Kikinis R, Wells WM. Using the logarithm of odds to define a vector space on probabilistic atlases. Medical Image Analysis. 2007;11:465–477. doi: 10.1016/j.media.2007.06.003. [DOI] [PMC free article] [PubMed] [Google Scholar]
- 43.Prastawa M, Gilmore J, Lin W, Gerig G. Automatic segmentation of neonatal brain MRI. In: Barillot C, Haynor D, Hellier P, editors. Medical Image Computing and Computer-Assisted Intervention MICCAI 2004. Springer; Berlin Heidelberg: 2004. pp. 10–17. 3216 of Lecture Notes in Computer Science. [DOI] [Google Scholar]
- 44.Prastawa M, Gilmore JH, Lin W, Gerig G. Automatic segmentation of MR images of the developing newborn brain. Medical image analysis. 2005;9:457–466. doi: 10.1016/j.media.2005.05.007. [DOI] [PubMed] [Google Scholar]
- 45.Rajchl M, Baxter JS, McLeod AJ, Yuan J, Qiu W, Peters TM, Khan AR. Hierarchical max-flow segmentation framework for multi-atlas segmentation with Kohonen self-organizing map based Gaussian mixture modeling. Medical Image Analysis. 2015 doi: 10.1016/j.media.2015.05.005. in press. [DOI] [PubMed] [Google Scholar]
- 46.Rodriguez-Carranza CE, Mukherjee P, Vigneron D, Barkovich J, Studholme C. A framework for in vivo quantification of regional brain folding in premature neonates. NeuroImage. 2008;41:462–478. doi: 10.1016/j.neuroimage.2008.01.008. [DOI] [PMC free article] [PubMed] [Google Scholar]
- 47.Rousseau F, Habas P, Studholme C. A supervised patch-based approach for human brain labeling. IEEE Trans Med Imaging. 2011;30:1852–1862. doi: 10.1109/TMI.2011.2156806. [DOI] [PMC free article] [PubMed] [Google Scholar]
- 48.Sabuncu MR, Yeo BT, Van Leemput K, Fischl B, Golland P. A generative model for image segmentation based on label fusion. Medical Imaging, IEEE Transactions on. 2010;29:1714–1729. doi: 10.1109/TMI.2010.2050897. [DOI] [PMC free article] [PubMed] [Google Scholar]
- 49.Scott JA, Habas PA, Kim K, Rajagopalan V, Hamzelou KS, Corbett-Detig JM, Barkovich AJ, Glenn OA, Studholme C. Growth trajectories of the human fetal brain tissues estimated from 3D reconstructed in utero MRI. International Journal of Developmental Neuroscience. 2011;29:529–536. doi: 10.1016/j.ijdevneu.2011.04.001. [DOI] [PMC free article] [PubMed] [Google Scholar]
- 50.Shiee N, Bazin P, Cuzzocreo JL, ABlitz A, Pham DL. Segmentation of brain images using adaptive atlases with application to ventriculomegaly. In: Székely G, Hahn HK, editors. Proc Information Processing in Medical Imaging. 2011. pp. 1–12. [DOI] [PMC free article] [PubMed] [Google Scholar]
- 51.Song Z, Awate S, Licht D, Gee J. Clinical neonatal brain MRI segmentation using adaptive nonparametric data models and intensity-based Markov priors. In: Ayache N, Ourselin S, Maeder A, editors. Medical Image Computing and Computer-Assisted Intervention MICCAI 2007. Springer; Berlin Heidelberg: 2007. pp. 883–890. volume 4791 of Lecture Notes in Computer Science. [DOI] [PubMed] [Google Scholar]
- 52.Sowell ER, Trauner DA, Gamst A, Jernigan TL. Development of cortical and subcortical brain structures in childhood and adolescence: a structural MRI study. Developmental Medicine & Child Neurology. 2002;44:4–16. doi: 10.1017/s0012162201001591. [DOI] [PubMed] [Google Scholar]
- 53.Studholme C. Mapping fetal brain development in utero using magnetic resonance imaging: The big bang of brain mapping. Annual Review of Biomedical Engineering. 2011;13:345–368. doi: 10.1146/annurev-bioeng-071910-124654. [DOI] [PMC free article] [PubMed] [Google Scholar]
- 54.Studholme C, Rousseau F. Quantifying and modelling tissue maturation in the living human fetal brain. International Journal of Developmental Neuroscience. 2014;32:3–10. doi: 10.1016/j.ijdevneu.2013.06.006. http://dx.doi.org/10.1016/j.ijdevneu.2013.06.006. special Issue: Imaging Developing Brain. [DOI] [PMC free article] [PubMed] [Google Scholar]
- 55.Tzarouchi L, Astrakas L, Xydis V, Zikou A, Kosta P, Drougia A, Andronikou S, Argyropoulou M. Age-related grey matter changes in preterm infants: An MRI study. NeuroImage. 2009;47:1148–1153. doi: 10.1016/j.neuroimage.2009.03.072. http://dx.doi.org/10.1016/j.neuroimage.2009.03.072. [DOI] [PubMed] [Google Scholar]
- 56.Volpe JJ. Brain injury in premature infants: a complex amalgam of destructive and developmental disturbances. The Lancet Neurology. 2009;8:110–124. doi: 10.1016/S1474-4422(08)70294-1. http://dx.doi.org/10.1016/S1474-4422(08)70294-1. [DOI] [PMC free article] [PubMed] [Google Scholar]
- 57.Wang L, Gao Y, Shi F, Li G, Gilmore JH, Lin W, Shen D. LINKS: Learning-based multi-source integration framework for segmentation of infant brain images. NeuroImage. 2015;108:160–172. doi: 10.1016/j.neuroimage.2014.12.042. [DOI] [PMC free article] [PubMed] [Google Scholar]
- 58.Wang L, Shi F, Li G, Gao Y, Lin W, Gilmore JH, Shen D. Segmentation of neonatal brain mr images using patch-driven level sets. NeuroImage. 2014;84:141–158. doi: 10.1016/j.neuroimage.2013.08.008. [DOI] [PMC free article] [PubMed] [Google Scholar]
- 59.Warfield SK, Zou KH, Wells WM. Simultaneous truth and performance level estimation (STAPLE): an algorithm for the validation of image segmentation. Medical Imaging, IEEE Transactions on. 2004;23:903–921. doi: 10.1109/TMI.2004.828354. [DOI] [PMC free article] [PubMed] [Google Scholar]
- 60.Wells WM, III, Grimson WEL, Kikinis R, Jolesz FA. Adaptive segmentation of MRI data. Medical Imaging, IEEE Transactions on. 1996;15:429–442. doi: 10.1109/42.511747. [DOI] [PubMed] [Google Scholar]
- 61.Wood NS, Marlow N, Costeloe K, Gibson AT, Wilkinson AR. Neurologic and developmental disability after extremely preterm birth. New England Journal of Medicine. 2000;343:378–384. doi: 10.1056/NEJM200008103430601. [DOI] [PubMed] [Google Scholar]
- 62.Woodward LJ, Anderson PJ, Austin NC, Howard K, Inder TE. Neonatal MRI to predict neurodevelopmental outcomes in preterm infants. New England Journal of Medicine. 2006;355:685–694. doi: 10.1056/NEJMoa053792. [DOI] [PubMed] [Google Scholar]
- 63.Wu G, Wang Q, Zhang D, Nie F, Huang H, Shen D. A generative probability model of joint label fusion for multi-atlas based brain segmentation. Medical image analysis. 2014;18:881–890. doi: 10.1016/j.media.2013.10.013. [DOI] [PMC free article] [PubMed] [Google Scholar]
- 64.Yan MX, Karp JS. Information processing in medical imaging. Springer; 1995. An adaptive bayesian approach to three-dimensional mr brain segmentation; p. 201. [Google Scholar]
- 65.Zhang Y, Brady M, Smith S. Segmentation of brain mr images through a hidden Markov random field model and the expectation-maximization algorithm. Medical Imaging, IEEE Transactions on. 2001;20:45–57. doi: 10.1109/42.906424. [DOI] [PubMed] [Google Scholar]


