

Graphical Abstract
Conditions are identified under which molybdenum disulfide (MoS2) is dispersed in aqueous solution at concentrations up to 0.12 mg/mL using a range of nonionic, biocompatible block copolymers (i.e., Pluronics and Tetronics). Furthermore, the optimal Pluronic dispersant for MoS2 is found to be effective for a range of other two-dimensional materials such as molybdenum diselenide, tungsten diselenide, tungsten disulfide, tin selenide, and boron nitride.
Keywords: molybdenum disulfide, tungsten diselenide, tungsten disulfide, tin selenide, boron nitride, pluronic, tetronic
Layered two-dimensional (2D) nanomaterials have attracted significant attention due to their large surface areas, nanometer-scale thicknesses, and superlative properties.[1–3] Since the isolation of graphene in 2004, many classes of 2D nanomaterials have been isolated and studied, including chalcogenides, nitrides, oxides, and other elemental analogues of graphene such as 2D silicon and black phosphorus.[4,5] These nanomaterials display a wide range of interesting mechanical, optical, electrical, and chemical properties, enabling their use in electronics, catalysis, spintronics, and related applications.[6,7] Of particular interest is the transition metal dichalcogenide (TMD) molybdenum disulfide (MoS2) because of its widespread commercial availability and semiconducting direct band gap in monolayer form.[8,9] In addition, nanoscale MoS2 possesses other attributes including high charge carrier mobility, visible photoluminescence, optical transparency, piezoelectricity, and superlubricity.[8,10–17] Moreover, the semiconducting electronic structure of MoS2 makes it a favorable candidate in the fields of sensing and electronics over graphene, which is intrinsically a zero band gap material.[10,18–21] MoS2 also holds promise in solution-based applications, although its potential in this area has not yet been fully realized. For example, aqueous dispersions of MoS2 have been proposed as biological imaging agents, drug delivery vehicles, and photothermal agents, as well as the basis for electronic and electrocatalytic applications.[22,23]
In order to realize this myriad of applications, scalable methods of exfoliation are needed that will maintain the 2H semiconducting structure and desirable electronic properties of MoS2 while simultaneously limiting any deleterious biological or environmental effects. Historically, atomically-thin layers of 2D nanomaterials have been isolated by mechanical exfoliation using adhesive tape, which produces high quality flakes but with limited throughput.[9,10,12,24] In addition, some 2D nanomaterials can be grown using chemical vapor deposition (CVD), wherein monolayers are produced with high purity and with a greater potential for scalability than mechanical exfoliation or colloidal chemical synthesis.[25–30 ] However, CVD-synthesized monolayers often need to be transferred from their growth substrate using harsh etchants and polymer coatings. These chemical treatments and polymer-based transfer techniques can result in structural damage and/or surface contamination to the resulting films.[31]
Solution processing offers a path forward to scalable production of 2D nanomaterials. Current methods, however, present a number of limitations with respect to their potential use in both electronics and biomedical applications. For example, chemical exfoliation can be achieved via ion intercalation, most commonly lithium ion intercalation.[32,33] However, for MoS2, this ion intercalation process involves harsh, toxic chemicals and significantly changes the electronic properties of the final nanomaterial due to a phase change from the semiconducting 2H-MoS2 to the metallic 1T-MoS2 polytype.[13,25–35] Exfoliation by ultrasonication in aqueous and organic solution has been demonstrated in a manner that preserves the original semiconducting 2H-MoS2 phase, but to prevent agglomeration, ionic surfactants (e.g., sodium cholate) in aqueous solution or nonionic polymers in organic solvents have been used.[36–40] The charged residues from ionic surfactants compromise electronic, electrochemical, and biological applications, while previously studied nonionic polymer dispersions have not been optimized for high yield and concentration, thereby also hindering applications in the biomedical field.
In this study, we demonstrate the exfoliation and stable dispersion of a suite of 2D nanomaterials in aqueous solution using biocompatible, nonionic poloxamers as a surfactant. A survey of 19 different poloxamers (i.e., Pluronics and Tetronics) reveals the effect of varying composition of block copolymer on the dispersion efficiency of MoS2. Size characterization analysis by scanning electron microscopy (SEM) and atomic force microscopy (AFM) shows that the resulting dispersions contain flakes that are primarily less than 10 layers in thickness. Furthermore, X-ray photoelectron spectroscopy (XPS) and high-resolution scanning transmission electron microscopy (STEM) confirm the unchanged stoichiometry and high crystalline quality of the resulting solution-processed MoS2. These exfoliation and dispersion conditions are found to be generally applicable to a wide range of 2D nanomaterials including molybdenum diselenide (MoSe2), tungsten diselenide (WSe2), tungsten disulfide (WS2), tin selenide (SnSe), and boron nitride (BN), thus providing a diverse palate of aqueous 2D nanomaterial dispersions for fundamental studies and emerging applications.
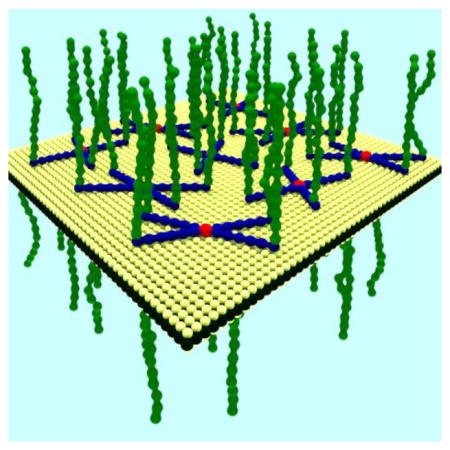
Pluronics and Tetronics are biocompatible nonionic block copolymers that can be used as surfactants in aqueous solution due to their amphiphilic nature. They are comprised of hydrophobic polypropylene oxide (PPO) chains and hydrophilic polyethylene oxide (PEO) chains in different lengths and ratios. As shown in Figure 1, Tetronics consist of two PPO chains covalently linked in a cross shape by ethylenediamine, with four identical PEO chains attached to the end of each PPO chain. On the other hand, Pluronics are based on a single PPO chain with two PEO chains attached on either end. These surfactants disperse well in aqueous solutions and are available with a wide range of PPO and PEO chain lengths. They have been previously employed to disperse and mitigate the toxicity of carbon nanomaterials including graphene and carbon nanotubes.[41–43] Pluronics have also been used to sort carbon nanotubes and molybdenum disulfide by physical structure and electronic type using density gradient ultracentrifugation.[ 44–46 ] Thus, in addition to presenting a scalable method of producing two-dimensional nanomaterials, biocompatible surfactants facilitate the deployment of these materials in biomedical applications.
Figure 1.

Schematic depiction of (A) Pluronic and (B) Tetronic block copolymers on the surface of a single-layer MoS2 flake. The amphiphilic Pluronic/Tetronic block copolymers adsorb non-covalently to the surface of MoS2 and prevent the agglomeration of the exfoliated flakes by acting as a surfactant and providing steric repulsion.
Figure 1 illustrates the hypothesized interaction between MoS2 and Pluronic/Tetronic where the PPO chains non-covalently adsorb to the surface of MoS2 through hydrophobic interactions. The hydrophilic PEO chains extend into solution thereby stabilizing the dispersion by lowering the surface tension and providing steric repulsion. The relative lengths of the PPO and PEO chains will influence these amphiphilic interactions and thus lead to variations in exfoliation and dispersion efficiency as will be quantified below.
The naming convention for each Pluronic and Tetronic identifies its state at room temperature and the molecular weight of its PPO and PEO chains. Specifically, Pluronics are labelled with a letter that represents their physical state at room temperature (i.e., flake, paste, or liquid), followed by a set of two or three digits. The last digit of each Pluronic number corresponds to the relative percent of PEO in the product. Additionally, the first one or two numbers multiplied by 300 is the approximate molecular weight of the PPO chain. Similarly, the last digit of each Tetronic name multiplied by 10 represents the percentage of PEO weight, while the earlier digits multiplied by 45 provides the molecular weight of the hydrophobic central block. Therefore, the molecular weights of the PEO and PPO components of Pluronics and Tetronics are determined using the total molecular weights provided by the source company (BASF) and the aforementioned naming convention. Overall, a total of 14 Pluronic solutions and 5 Tetronic solutions were tested to elucidate the effect of varying PEO versus PPO length on the exfoliation and dispersion efficiency of MoS2.
Initially, 300 mg of MoS2 powder (Sigma-Aldrich) was weighed in a 15 mL conical tube, followed by the addition of 8 mL of 2% w/v Pluronic or Tetronic solution. The mixture was then ultrasonicated for 1 hr at 25% amplitude (~16 W) while cooled in an ice water bath. Following ultrasonication, a series of centrifugation conditions were tested for the highest stable concentration of MoS2. Through a series of early trials, it was determined that centrifugation affected the final dispersion concentration significantly more than the initial mass of Pluronic or Tetronic block copolymer. As such, centrifugation was carried out in a tabletop centrifuge using a variety of conditions with speeds ranging from 500 rpm to 15,000 rpm, and spin times of 10 min to 75 min (see Supporting Information for more details). All data depicted here correspond to solutions centrifuged at 5,000 rpm for 60 min, as this centrifugation condition effectively removes aggregates without significantly decreasing overall yield. Solutions were then carefully decanted using a 20-gauge needle and syringe. Optical absorbance measurements were taken immediately following centrifugation, and corrected using a linear background subtraction. A subset of these measurements and their corresponding solutions are shown in Figure 2A and B. For BN, WS2, SnSe, MoSe2, and WSe2 dispersions in Pluronic F87, the same ultrasonication procedure was followed, and centrifugation was carried out at 5,000 rpm for 60 min. Lithiated molybdenum disulfide (LixMoS2) was also prepared by ion intercalation and dialysis for a comparison of concentration (see Supporting Information for experimental details).
Figure 2.

(A) Optical absorption spectra showing the range of concentrations possible by dispersing MoS2 in Pluronics under identical dispersion conditions. Photographs of corresponding solutions shown in the inset. (B) Beer’s Law plot of Pluronic F87 MoS2 dispersion optical absorbance as a function of concentration as measured by ICP-MS. (C) Concentration map of MoS2 in Pluronics and Tetronics. The color map is based on interpolation of the experimental Pluronic data, while the actual experimental values are shown by colored circles, and the actual Tetronic experimental values are represented by colored squares.
Concentration was inferred from optical absorbance spectroscopy and inductively coupled plasma mass spectrometry (ICP-MS), which allows part-per-billion sensitivity. Samples were digested in >69% nitric acid at 65°C overnight, diluted with deionized water and internal standard to appropriate concentrations, and measured by ICP-MS promptly. The presence of the metal or metalloid was measured in several samples, averaged to eliminate experimental error, and then used to determine the total concentration stoichiometrically. For MoS2, these results were largely consistent with the excitonic peak heights of background subtracted optical absorbance spectra. As such, both optical absorbance and ICP-MS were correlated to produce the final concentration values as shown in Table S1. The same method was applied to determine the mass extinction coefficient as shown in the Beer’s Law plot in Figure 2B. As seen in the optical absorbance spectra (Figure 2A), two sharp absorption peaks are present in the range of 620 nm to 675 nm. According to the photoluminescence spectra, MoS2 absorbs and emits visible wavelengths, namely photoluminescence emission peaks correspond to the excitonic transitions A1 at 670 nm and B1 at 627 nm.[12] The direct band gap is responsible for photoluminescence in MoS2, which grows stronger with reduced flake thickness. Therefore, since the MoS2 dispersions obtained here are polydisperse in thickness, photoluminescence will only occur after post-processing by density gradient ultracentrifugation,[46] wherein single-layer flakes of Pluronic-dispersed MoS2 can be isolated. The survey of Pluronic and Tetronic block copolymers resulted in a wide range of final concentrations, as shown in Figure 2C. In this plot, the actual experimental concentration values of the Pluronic and Tetronic solutions are represented by the colored circles and squares, respectively, while the underlying color map is based on an interpolation of the Pluronic data set. Additionally, Tetronics are plotted at half of their actual PEO and PPO values since their structure is similar to two Pluronic chains connected at their midpoint.
Dispersing MoS2 in different Pluronics and Tetronics under identical ultrasonication and centrifugation conditions results in a wide range of concentrations, signifying that the various Pluronics and Tetronics have varying exfoliation and dispersion efficiencies. The data in Figure 2C show that the concentration of Pluronic-dispersed MoS2 is highest with an intermediate PEO molecular weight and a large PPO molecular weight. Pluronics with an intermediate PEO molecular weight are well-suited for stable 2D nanomaterial dispersions since they are long enough to provide adequate steric hindrance between flakes, thus suppressing aggregation. The improved exfoliation and dispersion efficiency with increasing PPO molecular weight can likely be attributed to the hydrophobicity of MoS2, which has been reported to exceed that of graphene.[47,48] In contrast to the Pluronics, Tetronics show fewer systematic trends as a function of PEO and PPO molecular weights with Tetronic 904 appearing as a clear outlier in Figure 2C. The more complicated behavior of Tetronics may be attributed to the presence of the ethylenediamine linker group in the center of the PPO chains and/or its cross-shaped structure. Overall, Pluronic F87 provided the best combination of exfoliation efficiency and dispersion stability, and consequently it was chosen as the focus for more thorough characterization. For example, the mass extinction coefficient was determined for F87-MoS2 dispersions by correlating the concentration data from ICP-MS and optical absorbance spectroscopy as shown in Figure 2B.
F87-MoS2 samples were further characterized using AFM and SEM for flake size and thickness (see Supporting Information for experimental details). As shown in the AFM image (Figure 3C) and cross-sections (Figure 3D), the thickness of F87-MoS2 flakes ranges from 2 nm to 15 nm, with an average of 5.2 ± 1.1 nm, indicating that this exfoliation technique results in samples that are primarily less than 10 monolayers in thickness. These thickness values are largely consistent with those that have been reported using other surfactants, such as sodium cholate, in aqueous solution. MoS2 dispersions in organic solvents using a wide range of polymer stabilizers have also been reported to have a similar range of thicknesses.[36,39] The lateral size of the F87-MoS2 flakes has a mean square root area of 27.5 ± 15.5 nm (see Supporting Information). Furthermore, high-resolution scanning transmission electron microscopy (STEM) images were collected using a high angle annular dark field (HAADF) detector (Figure 3B). Although the pictured flake in Figure 3B is multilayer overall, our analysis suggests that the edge attenuates to a monolayer thickness, thereby allowing us to examine the crystal structure of the MoS2. The STEM analysis confirms that the 2H semiconducting crystal structure of MoS2 is conserved following Pluronic F87 dispersion as compared with literature reports.[28,49]
Figure 3.

Size characterization of Pluronic F87-dispersed MoS2. (A) SEM, (B) high-resolution STEM, (C) AFM, and (D) cross-sections derived from the AFM image. Scale bars in (A) and (C) are 500 nm. The scale bar in (B) is 1 nm.
Although block copolymers are compatible with a wide range of processes, they are known to hinder the electrical performance of 2D nanomaterials in device applications by acting as electronic insulators or charge trap carriers and may be unwanted in other fabrication procedures.[9] As such, we describe two methods to destabilize and remove Pluronic F87 in the Supporting Information. In short, when depositing on a surface such as SiO2, as is necessary for many device applications, annealing was effective for Pluronic removal. Alternatively, in solution phase, Pluronic F87 dispersion was effectively flocculated by the addition of isopropyl alcohol. Although this approach results in aggregation of the MoS2 flakes, the destabilization of the Pluronic F87 dispersion is easily achieved. Moreover, imaging by AFM or STEM before and after these processes strongly suggests the removal of the majority of Pluronic F87.
XPS was used to determine the stoichiometry of MoS2 before and after Pluronic F87 dispersion. In particular, XPS was performed on several Pluronic F87 dispersions of MoS2 using a wide range of ultrasonication energy, which was calculated using the ultrasonication power and duration of exposure. These samples were compared to raw MoS2 in its bulk powder form. The XPS analysis revealed that ultrasonication did not oxidize the MoS2 beyond its original bulk form and that the Pluronic/Tetronic did not covalently interact with the 2D nanomaterials. As shown in Figure S2, representative Mo 3d and S 2p spectra have been fitted for the following peaks between 220 and 245 eV: Mo3d satellite (233 eV), Mo 3d3/2 (230 eV), Mo 3d5/2 (227 eV), and S 2s (224 eV), and the following peaks between 160 and 170 eV: S 2p3/2 (162.2 eV) and S 2p1/2 (163.4 eV). The peaks present in the XPS spectra of bulk and exfoliated material remain constant regardless of the sonication energy, indicating a consistent level of oxidation for all samples produced in this study.
The generality of Pluronic F87 as an aqueous dispersant of 2D nanomaterials was explored for BN, WS2, SnSe, MoSe2, and WSe2, all of which showed relatively high concentrations as delineated in Figure 4B and 4C. These 2D nanomaterial dispersions were also characterized by optical absorbance spectroscopy (Figure 4A), AFM (Figure 4D), ICP-MS, and XPS (see Supporting Information). AFM reveals that the resulting flakes are comparable in dimensions to MoS2 dispersions, and XPS analysis confirms that the overall chemical composition of these 2D nanomaterials is not altered by the dispersion process. The wide range of 2D nanomaterials that can be effectively dispersed in aqueous solution with Pluronic F87 provides a diverse set of properties for subsequent studies including thermoelectrics (i.e., SnSe), semiconductors (i.e., MoS2, WS2, MoSe2, and WSe2), and insulators (i.e., BN).
Figure 4.

(A) Optical absorbance spectra, (B) photograph, (C) concentration by ICP-MS, and (D) representative AFM of BN dispersed by Pluronic F87 in water. Spectra in (A) are vertically offset for clarity. Dispersions pictured in (B) from left to right are: MoSe2, WSe2, WS2, SnSe, and BN. The scale bar in (D) is 500 nm.
In conclusion, we have demonstrated high-concentration aqueous dispersions of 2D nanomaterials using biocompatible, nonionic block copolymers. A survey of a wide range of Pluronics and Tetronics for MoS2 optimized the dispersion conditions and yielded maximum concentrations of 0.12 mg/mL for Pluronic F87. Similar results were obtained for Pluronic F87 on multiple other 2D nanomaterials, thus demonstrating the generality of this approach. Since Pluronics and Tetronics are nonionic and widely accepted as biocompatible surfactants, these 2D nanomaterial dispersions may be used for biomedical applications including photoablation therapy and medical device coatings, as well as other applications that harness the superlubricity and catalytic activity of these 2D nanomaterials.[15,22,50] Furthermore, the use of nonionic Pluronics and Tetronics may facilitate the use of solution-processed 2D nanomaterials in electronic and electrochemical applications since these dispersants lack the charged impurities that are ubiquitous in ionic surfactant dispersions.[51,52]
Experimental Section
2D Nanomaterial Dispersion Conditions
300 mg ± 5 mg bulk powder was added to 8 mL 2% w/v block copolymer solution in deionized water inside a 15 mL conical polypropylene tube. This mixture was then ultrasonicated using a horn ultrasonicator with a 3 mm diameter probe (Fisher Scientific Model 500 Sonic Dismembrator) while being chilled in an ice water bath. For all samples, excluding those used for X-ray photoelectron spectroscopy, the sonication power was maintained at 16–18 W (25%).
For MoS2 dispersions, the resulting slurry was then centrifuged under a variety of conditions (see Table S-2) to eliminate poorly dispersed MoS2. For all other 2D materials, only centrifugation condition D was used (60 minutes at 5,000 rpm). Centrifugation was carried out in an Eppendorf Model 5424 Microcentrifuge using a 45° fixed-angle rotor (FA-45-24-11). The slurry was centrifuged in 1.5 mL aliquots in conical Eppendorf tubes, of which the top 1 mL was carefully decanted using a 20-gauge needle and syringe for further studies. Seven different centrifugation conditions were tested as shown in Table S-2. All data shown in the main text correspond to dispersions that were centrifuged for 60 minutes at 5,000 rpm (centrifugation condition D).
Inductively Coupled Plasma-Mass Spectroscopy (ICP-MS)
Small aliquots (5 to 100 μL) of each Pluronic- and Tetronic-dispersed MoS2 solution and Pluronic F87-dispersed BN, WS2, SnSe, MoSe2, and WSe2 using centrifugation condition D were added to 300 or 450 μL concentrated trace-grade nitric acid (Sigma-Aldrich) in lightly-capped 15 mL conical polypropylene tubes and heated for at least 12 hr at 65 °C. 50 μL or 75 μL of ICP-MS multi-element internal standard was then added to the solution for a final concentration of 10 ppb. The solution was diluted to a final concentration of 2% nitric acid using deionized water (10 or 15 mL total). External standards were prepared to span 0.488 ppb to 1000 ppb of the elements of interest by mixing varying quantities of Mo, W, Sn, and B standards (Inorganic Solutions), 150 μL nitric acid, and 25 μL internal standard. Each external standard was diluted to a final volume of 5 mL with deionized water. All samples were measured under the same conditions on a ThermoFisher X Series II ICP-MS. The accuracy of the external standard concentration was checked by linear regression of the ICP-MS signal (R2 > 99.999).
The concentration of the undiluted specimens was then determined by using the appropriate dilution factor and the formula weight ratios. Repeated experiments revealed a ~10% uncertainty in the concentration measurements as a result of small differences in sonicator probe placement, contamination of the supernatant by poorly exfoliated material, and digestion conditions for ICP-MS. Further experimental details can be found in the Supporting Information.
Supplementary Material
Acknowledgments
This work was supported by the National Science Foundation and the Environmental Protection Agency under Cooperative Agreement Number DBI-1266377, the US Public Health Service Grant NIEHS RO1 ES022698, and the National Science Foundation (DMR-1505849). The STEM work was supported by the NSF Partnership for Research and Education in Materials (PREM) program (DMR-0934218), NIH RCMI Nanotechnology and Human Health Core (G12MD007591), Department of Defense #64756-RT-REP, and the Welch Foundation (Award #AX-1615). Metal analysis was performed at the Northwestern University Quantitative Bioelemental Imaging Center, which is supported by NASA Ames Research Center NNA06CB93G. XPS was performed at the Northwestern University NUANCE Center, which is supported by the NSF-MRSEC (NSF DMR-1121262), Keck Foundation, and the State of Illinois. Centrifugal evaporation was performed within the Northwestern University ChemCore at the Center for Molecular Innovation and Drug Discovery, which is sponsored by the Chicago Biomedical Consortium with support from The Searle Funds at The Chicago Community Trust.
Footnotes
Supporting Information is available from the Wiley Online Library or from the author.
Contributor Information
Nikhita D. Mansukhani, Department of Materials Science and Engineering, Northwestern University, 2220 Campus Drive, Evanston, Illinois 60208-3108, USA
Linda M. Guiney, Department of Materials Science and Engineering, Northwestern University, 2220 Campus Drive, Evanston, Illinois 60208-3108, USA
Peter J. Kim, Department of Materials Science and Engineering, Northwestern University, 2220 Campus Drive, Evanston, Illinois 60208-3108, USA
Yichao Zhao, Department of Materials Science and Engineering, Northwestern University, 2220 Campus Drive, Evanston, Illinois 60208-3108, USA.
Diego Alducin, Department of Physics and Astronomy, University of Texas at San Antonio, One UTSA Circle, San Antonio, Texas 78249-1644, USA.
Prof. Arturo Ponce, Department of Physics and Astronomy, University of Texas at San Antonio, One UTSA Circle, San Antonio, Texas 78249-1644, USA
Dr. Eduardo Larios, Department of Physics and Astronomy, University of Texas at San Antonio, One UTSA Circle, San Antonio, Texas 78249-1644, USA
Prof. Miguel Jose Yacaman, Department of Physics and Astronomy, University of Texas at San Antonio, One UTSA Circle, San Antonio, Texas 78249-1644, USA
Prof. Mark C. Hersam, Department of Materials Science and Engineering, Northwestern University, 2220 Campus Drive, Evanston, Illinois 60208-3108, USA
References
- 1.Plashnitsa VV, Vietmeyer F, Petchsang N, Tongying P, Kosel TH, Kuno M. J Phys Chem Lett. 2012;3:1554. doi: 10.1021/jz300487p. [DOI] [PubMed] [Google Scholar]
- 2.Gan L, Zhang Q, Cheng Y, Schwingenschlögl U. J Phys Chem Lett. 2014;5:1445. doi: 10.1021/jz500344s. [DOI] [PubMed] [Google Scholar]
- 3.Faber MS, Park K, Cabán-Acevedo M, Santra PK, Jin S. J Phys Chem Lett. 2013;4:1843. doi: 10.1021/jz400642e. [DOI] [PubMed] [Google Scholar]
- 4.Koski K, Cui Y. ACS Nano. 2013;7:3739. doi: 10.1021/nn4022422. [DOI] [PubMed] [Google Scholar]
- 5.Butler SZ, Hollen SM, Cao L, Cui Y, Gupta JA, Gutierrez HR, Heinz TF, Hong SS, Huang J, Ismach AF, Johnston-Halperin E, Kuno M, Plashnitsa VV, Robinson RD, Ruoff RS, Salahuddin S, Shan J, Shi L, Spencer MG, Terrones M, Windl W, Goldberger JE. ACS Nano. 2013;7:2898. doi: 10.1021/nn400280c. [DOI] [PubMed] [Google Scholar]
- 6.Zhao L, Lo S, Zhang Y, Sun H, Tan G, Uher C, Wolverton C, Dravid VP, Kanatzidis MC. Nature. 2014;508:373. doi: 10.1038/nature13184. [DOI] [PubMed] [Google Scholar]
- 7.Lin Y, Connell JW. Nanoscale. 2012;4:6908. doi: 10.1039/c2nr32201c. [DOI] [PubMed] [Google Scholar]
- 8.Mak KF, Lee C, Hone J, Shan J, Heinz TF. Phys Rev Lett. 2010;105:136805. doi: 10.1103/PhysRevLett.105.136805. [DOI] [PubMed] [Google Scholar]
- 9.Wang QH, Kalantar-Zadeh K, Kis A, Coleman JN, Strano MS. Nat Nanotechnol. 2012;7:699. doi: 10.1038/nnano.2012.193. [DOI] [PubMed] [Google Scholar]
- 10.Radisavljevic B, Radenovic A, Brivio J, Giocometti V, Kis A. Nat Nanotechnol. 2011;6:147. doi: 10.1038/nnano.2010.279. [DOI] [PubMed] [Google Scholar]
- 11.Wang H, Yu L, Lee Y, Hsu A, Chin ML, Li L, Dubey M, Kong J, Palacios T. Nano Lett. 2012;12:4674. doi: 10.1021/nl302015v. [DOI] [PubMed] [Google Scholar]
- 12.Splendiani A, Sun L, Zhang Y, Li T, Kim J, Chim C, Galli G, Wang F. Nano Lett. 2010;10:1271. doi: 10.1021/nl903868w. [DOI] [PubMed] [Google Scholar]
- 13.Eda G, Yamaguchi H, Voiry D, Fujita T, Chen M, Chhowalla M. Nano Lett. 2011;11:5111. doi: 10.1021/nl201874w. [DOI] [PubMed] [Google Scholar]
- 14.Duerloo KN, Ong MT, Reed EJ. J Phys Chem Lett. 2012;3:2871. [Google Scholar]
- 15.Martin JM, Donnet C, Le Mogne T. Phys Rev B. 1993;48:10583. doi: 10.1103/physrevb.48.10583. [DOI] [PubMed] [Google Scholar]
- 16.Blumberg A, Keshet U, Zaltsman I, Hod O. J Phys Chem Lett. 2012;3:1936. [Google Scholar]
- 17.Levita G, Cavaleiro A, Molinari E, Polcar T, Righi MC. J Phys Chem C. 2014;118:13809. [Google Scholar]
- 18.Wu C, Jariwala D, Sangwan VK, Marks TJ, Hersam MC, Lauhon LJ. J Phys Chem Lett. 2013;4:2508. [Google Scholar]
- 19.Li Y, Wu D, Zhou Z, Cabrera CR, Chen Z. J Phys Chem Lett. 2012;3:2221. doi: 10.1021/jz300792n. [DOI] [PubMed] [Google Scholar]
- 20.Kou L, Tang C, Zhang Y, Heine T, Chen C, Frauenheim T. J Phys Chem Lett. 2012;3:2934. doi: 10.1021/jz301339e. [DOI] [PubMed] [Google Scholar]
- 21.Sun Z, James DK, Tour JM. J Phys Chem Lett. 2011;2:2425. [Google Scholar]
- 22.Chou SS, Kaehr B, Kim J, Foley BM, De M, Hopkins PE, Huang J, Brinker CJ, Dravid VP. Angew Chem Int Ed. 2013;52:4160. doi: 10.1002/anie.201209229. [DOI] [PMC free article] [PubMed] [Google Scholar]
- 23.Kim J, Byun S, Smith AJ, Yu J, Huang J. J Phys Chem Lett. 2013;4:1227. doi: 10.1021/jz400507t. [DOI] [PubMed] [Google Scholar]
- 24.Bertolazzi S, Brivio J, Kis A. Nano Lett. 2010;10:1271. [Google Scholar]
- 25.Komsa H, Krasheninnikov AV. J Phys Chem Lett. 2012;3:3652. doi: 10.1021/jz301673x. [DOI] [PubMed] [Google Scholar]
- 26.Wang X, Gong Y, Shi G, Chow WL, Keyshar K, Ye G, Vajtai R, Lou J, Ringe E, Tay BK, Ajayan PM. ACS Nano. 2014;8:5125. doi: 10.1021/nn501175k. [DOI] [PubMed] [Google Scholar]
- 27.Shim GW, Yoo K, Seo S, Shin J, Jung DY, Kang I, Ahn C, Cho BJ, Choi S. ACS Nano. 2014;8:6655. doi: 10.1021/nn405685j. [DOI] [PubMed] [Google Scholar]
- 28.Yu Y, Li C, Liu Y, Su L, Zhang Y, Cao L. Sci Rep. 2013;3:1866. doi: 10.1038/srep01866. [DOI] [PMC free article] [PubMed] [Google Scholar]
- 29.Huang J, Pu J, Hsu C, Chiu M, Juang Z, Chang Y, Chang W, Iwasa Y, Takenobu T, Li L. ACS Nano. 2014;8:923. doi: 10.1021/nn405719x. [DOI] [PubMed] [Google Scholar]
- 30.Mahler B, Hoepfner V, Liao K, Ozin GA. J Am Chem Soc. 2014;136:14121. doi: 10.1021/ja506261t. [DOI] [PubMed] [Google Scholar]
- 31.Najmaei S, Liu Z, Zhou W, Zou X, Shi G, Lei S, Yakobson BI, Idrobo J, Ajayan PM, Lou J. Nat Mater. 2013;12:754. doi: 10.1038/nmat3673. [DOI] [PubMed] [Google Scholar]
- 32.Osada M, Sasaki T. J Mater Chem. 2009;19:2503. [Google Scholar]
- 33.Gordon RA, Yang D, Crozier ED, Jiang DT, Frindt RF. Phys Rev B. 2002;65:125407. [Google Scholar]
- 34.Kan M, Wang JY, Li XW, Zhang SH, Li YW, Kawazoe Y, Sun Q, Jena P. J Phys Chem C. 2014;118:1515. [Google Scholar]
- 35.Frey GL, Reynolds KJ, Friend RH, Cohen H, Feldman Y. J Am Chem Soc. 2003;125:5998. doi: 10.1021/ja020913o. [DOI] [PubMed] [Google Scholar]
- 36.Smith RJ, King PJ, Lotya M, Wirtz C, Khan U, De S, O’Neill A, Duesber GS, Grunlan JC, Moriarty G, Chen J, Wang J, Minett AI, Nicolosi V, Coleman JN. Adv Mater. 2011;23:3944. doi: 10.1002/adma.201102584. [DOI] [PubMed] [Google Scholar]
- 37.Coleman JN, Mustafa L, O’Neill A, Bergin SD, King PJ, Khan U, Young K, Gaucher A, De S, Smith RJ, Shvets IV, Arora SK, Stanton G, Kim H, Lee K, Kim GT, Duesberg GS, Hallam T, Boland JJ, Wang JJ, Donegan JF, Grunlan JC, Moriarty G, Shmeliov A, Nicholls RJ, Perkins JM, Grieveson EM, Theuwissen K, McComb DW, Nellist PD, Nicolosi V. Science. 2011;331:568. doi: 10.1126/science.1194975. [DOI] [PubMed] [Google Scholar]
- 38.Zhou K, Mao N, Wang H, Peng Y, Zhang H. Angew Chem Int Ed. 2011;50:10839. doi: 10.1002/anie.201105364. [DOI] [PubMed] [Google Scholar]
- 39.May P, Khan U, Hughes M, Coleman JN. J Phys Chem C. 2012;116:11393. [Google Scholar]
- 40.Quinn MDJ, Ho NH, Notley SM. ACS Appl Mater Interfaces. 2013;5:12751. doi: 10.1021/am404161k. [DOI] [PubMed] [Google Scholar]
- 41.Seo JT, Green AA, Antaris AL, Hersam MC. J Phys Chem Lett. 2011;2:1004. [Google Scholar]
- 42.Duch MC, Budinger GRS, Liang YT, Soberanes S, Urich D, Chiarella SE, Campochiaro LA, Gonzalez A, Chandel NS, Hersam MC, Mutlu GM. Nano Lett. 2011;11:5201. doi: 10.1021/nl202515a. [DOI] [PMC free article] [PubMed] [Google Scholar]
- 43.Mutlu GM, Budinger GRS, Green AA, Urich D, Soberanes S, Chiarella SE, Alheid GF, McCrimmon DR, Szleifer I, Hersam MC. Nano Lett. 2010;10:1664. doi: 10.1021/nl9042483. [DOI] [PMC free article] [PubMed] [Google Scholar]
- 44.Antaris AL, Seo JT, Green AA, Hersam MC. ACS Nano. 2010;4:4725. doi: 10.1021/nn101363m. [DOI] [PubMed] [Google Scholar]
- 45.Bonaccorso F, Hasan T, Tan PH, Sciascia C, Privitera G, DiMarco G, Gucciardi PG, Ferrari AC. J Phys Chem C. 2010;114:17267. [Google Scholar]
- 46.Kang J, Seo JT, Alducin D, Ponce A, Yacaman MJ, Hersam MC. Nat Commun. 2014;5:5478. doi: 10.1038/ncomms6478. [DOI] [PubMed] [Google Scholar]
- 47.Benavente E, Riveros G, Lopez Z, Santa Ana MA, Aliaga J, Gonzalez G. Mol Cryst Liq Cryst. 2010;521:148. [Google Scholar]
- 48.Li Z, Wang Y, Kozbial A, Shenoy G, Zhou F, McGinley R, Ireland P, Morganstein B, Kunkel A, Surwade SP, Li L, Liu H. Nat Mater. 2013;12:925. doi: 10.1038/nmat3709. [DOI] [PubMed] [Google Scholar]
- 49.Eda G, Fujita T, Yamaguchi H, Voiry D, Chen M, Chhowalla M. ACS Nano. 2012;6:7311. doi: 10.1021/nn302422x. [DOI] [PubMed] [Google Scholar]
- 50.Eng AYS, Ambrosi A, Sofer Z, Simek P, Pumera M. ACS Nano. 2014;8:12185. doi: 10.1021/nn503832j. [DOI] [PubMed] [Google Scholar]
- 51.Secor EB, Prabhumirashi PL, Puntambekar K, Geier ML, Hersam MC. J Phys Chem Lett. 2013;4:1347. doi: 10.1021/jz400644c. [DOI] [PubMed] [Google Scholar]
- 52.Sire C, Ardiaca F, Lepilliet S, Seo JT, Hersam MC, Dambrine G, Happy H, Derycke V. Nano Lett. 2012;12:1184. doi: 10.1021/nl203316r. [DOI] [PubMed] [Google Scholar]
Associated Data
This section collects any data citations, data availability statements, or supplementary materials included in this article.