

Abstract
The present study investigated how pitch frequency, a perceptually relevant aspect of periodicity in natural human vocalizations, is encoded in Heschl's gyrus (HG), and how this information may be used to influence vocal pitch motor control. We recorded local field potentials from multicontact depth electrodes implanted in HG of 14 neurosurgical epilepsy patients as they vocalized vowel sounds and received brief (200 ms) pitch perturbations at 100 Cents in their auditory feedback. Event-related band power responses to vocalizations showed sustained frequency following responses that tracked voice fundamental frequency (F0) and were significantly enhanced in posteromedial HG during speaking compared with when subjects listened to the playback of their own voice. In addition to frequency following responses, a transient response component within the high gamma frequency band (75–150 Hz) was identified. When this response followed the onset of vocalization, the magnitude of the response was the same for the speaking and playback conditions. In contrast, when this response followed a pitch shift, its magnitude was significantly enhanced during speaking compared with playback. We also observed that, in anterolateral HG, the power of high gamma responses to pitch shifts correlated with the magnitude of compensatory vocal responses. These findings demonstrate a functional parcellation of HG with neural activity that encodes pitch in natural human voice, distinguishes between self-generated and passively heard vocalizations, detects discrepancies between the intended and heard vocalization, and contains information about the resulting behavioral vocal compensations in response to auditory feedback pitch perturbations.
SIGNIFICANCE STATEMENT The present study is a significant contribution to our understanding of sensor-motor mechanisms of vocal production and motor control. The findings demonstrate distinct functional parcellation of core and noncore areas within human auditory cortex on Heschl's gyrus that process natural human vocalizations and pitch perturbations in the auditory feedback. In addition, our data provide evidence for distinct roles of high gamma neural oscillations and frequency following responses for processing periodicity in human vocalizations during vocal production and motor control.
Keywords: auditory feedback, ECoG, pitch perturbation, sensory-motor integration, vocal production, voice motor control
Introduction
Humans use auditory feedback to continuously monitor and adjust their own voice when speaking. This ability to effortlessly integrate vocal motor and sensory information is an essential attribute of normal human speech; however, the neural processes that mediate this critical function are poorly understood. One prominent hypothesis posits that, during speaking, efference copies (Wolpert et al., 2011) of the vocal motor commands are transmitted to the auditory system to detect and characterize disparities (errors) between the intended vocal output and the actual sensory feedback. Such predictive coding models of speech (Guenther et al., 2006; Hickok and Poeppel, 2007; Houde and Nagarajan, 2011; Houde and Chang, 2015) propose that the output of this comparative analysis provides information that is projected from the auditory back to the motor system to adjust vocal output parameters, such as loudness (Lane and Tranel, 1971; Eliades and Wang, 2012) or pitch (Larson, 1998).
One approach to test this top-down model involves studying how vocalization affects the neural processing of speech sounds within different auditory cortical areas. Previous studies have shown that the motor act of vocalization affects speech sound processing on the posterolateral superior temporal gyrus (STG) (Chang et al., 2013; Greenlee et al., 2013), which is considered a nonprimary (i.e., noncore) region within the auditory cortex (Howard et al., 2000; Nourski et al., 2014). However, little is known about the functional role of other hierarchically organized auditory cortical fields within Heschl's gyrus (HG) (Hackett, 2008; Romanski and Averbeck, 2009; Hackett et al., 2014) for speech sound processing.
Auditory core cortex is comprised of one or more primary and primary-like fields that are located on the posteromedial two-thirds of HG (Hackett et al., 1998; Hackett, 2008). Neural activity within core cortex represents temporal features of auditory stimuli with short latencies and a high degree of temporal precision. Core auditory cortex is capable of robustly encoding transient auditory stimuli presented at repetition rates that are comparable with the range of the human voice fundamental frequency (F0) (Brugge et al., 2008, 2009; Nourski and Brugge, 2011). Areas anterolateral to the core on HG have distinctly different physiological properties that differentiate them from the core based on longer onset and peak latencies and little or no phase locking to click trains or amplitude modulated sounds (Brugge et al., 2009). Like core cortex, the anterolateral belt responds to a wide range of acoustic signals, such as animal vocalizations and human speech (Chevillet et al., 2011; Tsunada et al., 2011; Kuśmierek et al., 2012). The question then arises as to how auditory feedback is processed within human HG, and how it is used for speech motor control.
In human speech, F0 is a particularly important cue that speakers use to monitor and control their voice in response to changes in the auditory feedback (Larson, 1998). Because core auditory areas are capable of precisely representing the temporal structure of this acoustical feature, we hypothesized that this same cortical area plays specialized roles in monitoring and controlling voice F0 during vocal production.
Materials and Methods
Studies were performed in neurosurgical patients with multicontact depth electrodes implanted within HG. Local field potentials were obtained from auditory cortex of HG as subjects vocalized the vowel sound /a/ or listened to a recording of their same vocalizations. During each vocalization, a brief pitch shift was inserted into the auditory feedback signal and the vocal responses were recorded. Data were analyzed to determine whether and to what extent neural activity within auditory cortex of HG represented F0 of speech sound information, distinguished between self-generated and played-back vocalizations, detected discrepancies between the intended and heard vocalization, and correlated with the resulting vocal responses to pitch perturbations.
Subjects.
Results presented here were obtained from 14 neurosurgical patients (12 male, 2 female; mean age 36 years, range 20–48 years; all right-handed except for one, R180) undergoing surgical treatment of medically intractable epilepsy. Written informed consent was obtained from every subject, and all research protocols were approved by the University of Iowa Human Subjects Review Board. As part of the treatment plan, multicontact depth electrodes were implanted into HG for the purpose of localizing the source(s) of seizure events (Howard et al., 1996). Experiments were conducted in a specially designed and electromagnetically shielded private suite in the University of Iowa General Clinical Research Unit.
Extensive presurgical assessment, including neurological examination, brain imaging, neuropsychological evaluation, and audiometric testing, confirmed normal hearing, speech, and language functions for all subjects. No anatomic lesions were detected in the cortical regions of interest to this study. Preoperative sodium amobarbital (Wada) testing revealed left hemispheric dominance for language in 13 subjects and bilateral dominance in one (L162; “L” and “R” prefixes indicate left and right side, respectively, of electrode implant).
Stimuli and tasks.
Experimental design of the present study is illustrated in Figure 1. The experiment consisted of two tasks: speaking and playback. During the speaking task (Fig. 1a), subjects were asked to produce and maintain a steady vocalization of the vowel sound /a/ for ∼2–3 s at their natural conversational pitch and loudness (∼70–75 dB). This vocal task was repeated 30–50 times with subjects vocalizing at their own pace and taking short breaks (1–2 s) between successive utterances. During speaking, the voice sound was captured by a microphone (Beta 87C, Shure) located near the subject's mouth, amplified (10 dB gain; Ultralite MK3, MOTU), and passed through a harmonizer (Eclipse, Eventide) such that intermittent pitch shifts could be inserted into the auditory feedback. During each vocalization, the pitch frequency of the auditory feedback was shifted upward by 100 Cents (1 semitone, ∼5.95% of F0). The duration of pitch-shift stimuli was 200 ms, and their onsets were randomized between 750 and 1250 ms after the onset of vocalizations. The total duration of each block was ∼5–8 min, and subjects were given short breaks (2 min) between successive blocks.
Figure 1.

Experimental design for a single trial of (a) speaking and (b) playback of the self-produced steady vocalization of the vowel sound /a/. An upward pitch-shift stimulus with 100 Cents magnitude was delivered to the auditory feedback. The duration of the stimulus was 200 ms, and its onset was randomized between 750 and 1250 ms relative to the onset of the vocalization.
All sound stimuli were delivered diotically through insert earphones (ER-4, Etymotic) placed in vented ear molds custom-fitted for each subject. A 10 dB feedback amplification was inserted between the voice sound and its auditory feedback to partially mask the potentially confounding effects of bone conduction or the side-tone of the subjects' voice. During the playback task, subjects were instructed to listen to the recorded sound signal of their same self-produced vocalizations (Fig. 1b). The gain of the signal during playback condition was adjusted to be at a nearly equal level to voice feedback during the speaking block.
ECoG data acquisition.
Detailed descriptions of the depth electrodes used in this study and the methods of electrode implantation and subsequent anatomical localization of recording sites have been presented in earlier studies from our laboratory (Howard et al., 1996; Brugge et al., 2008, 2009; Nourski et al., 2009; Reddy et al., 2010). Each depth electrode array used a combination of either micro- and macro-contacts [hybrid-depth electrode (HDE)] or closely spaced macro-contacts alone. The HDE was a linear array of 4 or 6 macro-contacts with 10 mm spacing and 14 micro-contacts distributed between the macro-contacts at 2–4 mm intervals. The micro-contacts consisted of 40 μm wires with exposed ends protruding 0.5 mm from the electrode shaft (Howard et al., 1996). In two subjects (L275 and L282), depth electrodes with 8 macro-contacts with 5 mm interelectrode spacing were used. In all subjects, HG electrodes were guided stereotactically approximately parallel to the long axis of the left HG in 8 subjects (L162, L173, L175, L178, L206, L258, L275, and L282) and the right HG in 6 subjects (R154, R180, R186, R198, R210, and R212). The electrodes remained in place during the hospital stay (typically 2 weeks) during which time the subjects underwent continuous clinical video-EEG monitoring. This high-resolution EEG monitoring showed no abnormal interictal epileptiform activity in the HG cortical areas pertinent to this study.
ECoG analysis.
Electrocorticographic (ECoG) recordings were typically initiated 2–3 d after subjects had recovered from implantation surgery. During recording sessions, the subjects were awake and sitting comfortably in a bed. Data acquisition was performed using a multichannel system (System3, Tucker Davis Technologies). The ECoG signals were bandpass filtered (1.6–1000 Hz, −12 dB/octave anti-aliasing filter) and then digitized with a sampling frequency of 2034.5 Hz. Digitized data were then resampled offline at 2000 Hz and further processed using custom software in MATLAB (The MathWorks). Power line noise was removed using an adaptive notch-filtering procedure (Nourski et al., 2013), and ECoG waveforms were inspected to further ensure that they were not contaminated by epileptiform activity or other electrical artifacts. In addition, the waveforms with voltages exceeding 2.5 SD from the mean were removed from the data to ensure that any remaining sporadic activity generated by electrical interference, epileptiform spikes, or movement artifacts were eliminated before further analysis.
Time-frequency analysis of the ECoG signals was performed on a trial-by-trial basis using a complex Morlet wavelet transform (Oya et al., 2002) with center frequencies ranging from 1 to 300 Hz with 1 Hz spectral resolution. The wavelet constant ratio was defined as fc/σf = 10, where fc is the center frequency of the wavelet and σf is its SD in frequency domain defined as σf = 1/(2πσt). At 100 Hz, this leads to a wavelet width (2σt) of 31.8 ms and to a spectral bandwidth (2σf) of 20 Hz. Event-related band power (ERBP) responses to voice and pitch-shift stimulus were calculated for each frequency using the log transform of power normalized to baseline according to the following formula:
 |
The log transformation function was used to ensure that the data were normally distributed for statistical analysis. For both responses to voice and pitch-shift, ERBP time-series were calculated by normalizing postvocalization spectral power (P) relative to the baseline power (PBaseline) from −500 to −200 ms before vocalization onset (i.e., during silence). The single-trial ERBP time series were then averaged over the total number of trials at each recording site relative to voice and pitch shift onset and were represented as an averaged time-frequency plot for each condition, separately. Statistical analysis of contrasts between neural response components in different experimental conditions were performed by paired t tests, and significant results were corrected for multiple comparisons using the false-discovery rate (FDR) method (Benjamini and Hochberg, 1995). Correlations between ERBP metrics in response to voice and pitch shifts were calculated using Pearson's correlation coefficients.
Electrode localization.
The position of each recording electrode in each subject was localized using a combination of preimplantation and postimplantation MRI scans (0.78 × 0.78 × 1.0 mm voxel size) and CT (0.45 × 0.45 × 1.0 mm voxel size) scans. These scans were coregistered using a 3D rigid-fusion algorithm (Jenkinson et al., 2002). The locations of all recording sites were then examined in serial MRI cross sections and mapped to a 3D rendering of HG. The estimated overall error in localizing recording sites using these techniques did not exceed 2 mm.
ECoG response mapping onto template HG.
The gross anatomical morphology of the human superior temporal plane is complex and varies significantly across subjects. This presents methodological challenges when displaying electrode anatomical locations derived from multiple subjects on a single template brain (Nourski et al., 2014). For example, in some subjects, when MNI coordinates are used to project anatomically confirmed HG electrode contact locations onto a template brain, the assigned locations are depicted as being outside of HG. Another important methodological issue relates to the visualization of HG cortex lying within sulci. Traditional top-down superior temporal plane reconstructions are shown as 2D images with thin lines representing sulci. Those surface-rendered images are not well suited for showing the locations of HG depth electrode contacts positioned within sulcal cortex. To address these limitations, we used a combination of image processing and analytical methods to project individual subject electrode contact locations onto a template 3D gyral surface using the gross anatomical landmarks that define the boundaries of HG as coregistration features.
First, individual structural MRI data were processed using FreeSurfer (http://surfer.nmr.mgh.harvard.edu/). We then focused on the superior temporal plane anatomy. Using spherical representation on the subject's hemisphere, mesh patches of each subject's superior temporal plane were created, and on these we manually delineated Heschl's sulcus, the first transverse temporal sulcus, and the STG. Multiresolution spherical diffeomorphic mapping (Yeo et al., 2010) was applied between each subject's brain mesh and the template brain mesh. We used the International Consortium for Brain Mapping nonlinear asymmetric averaged brain as our template (http://www.bic.mni.mcgill.ca/ServicesAtlases/ICBM152NLin 2009/). In this application, we performed a 4-stage morphing using the information given by the above delineation of the individual sulcal and gyral anatomy. Sulcal depth information was also used for the first stage of the morphing procedure. Anatomical information outside the superior temporal plane and the STG were ignored. We found that using confined anatomical information within the region of interest yielded superior gross anatomical correspondence between HG electrode locations in individual subjects and the projected locations on the template brain. Mesh vertices closest to the electrode contact coordinates were determined and transferred onto the template brain using the nonlinear morphing procedure described above. The ECoG response values were assigned to the transferred vertices on the template. These values were smoothed on the template brain surface using an iterative heat-kernel smoothing algorithm (Chung et al., 2005). Morphing, smoothing, and visualization displays were performed using custom MATLAB software.
Voice response to pitch-shift analysis.
The pitch frequency of the produced voice signals was extracted in Praat (Boersma and Weenink, 2001) using an autocorrelation method and then exported to MATLAB for further processing. The extracted pitch frequencies were segmented into epochs ranging from −200 ms before to 800 ms after the onset of pitch-shift stimuli. Pitch frequencies were then converted from Hertz to Cents scale to calculate vocal compensation in response to the pitch-shift stimulus using the following formula:
 |
Here, F is the poststimulus pitch frequency and FBaseline is the baseline (prestimulus) pitch frequency from −500 to −200 ms in Hz scale. The calculated pitch contours in Cents were averaged across trials separately in each individual subject, and the magnitude of the mean vocal compensation to pitch-shift stimuli was calculated by finding the most prominent peak in a time window from 0 to 400 ms poststimulus.
Results
HG responses to human vocalization
The ERBP responses to voice during speaking and playback conditions are shown in Figure 2 for a subject with right-sided (R198) and a subject with left-sided (L275) electrode implantation. Figure 2a shows the top-down view of the reconstructed superior temporal plane surface in R198 with 14 electrode contacts positioned within HG. The sound waveform and spectrogram of an example sustained vowel sound vocalization are shown in Figure 2b. In Figure 2c, time-frequency plots of the ERBP responses are shown for these 14 contacts. As depicted in these plots, the majority of the contacts exhibited ERBP power increases (relative to prevocalization silent baseline) after voice onset during both speaking and playback conditions. The largest amplitude ERBP power increases were seen in the contacts located in the middle third of HG.
Figure 2.
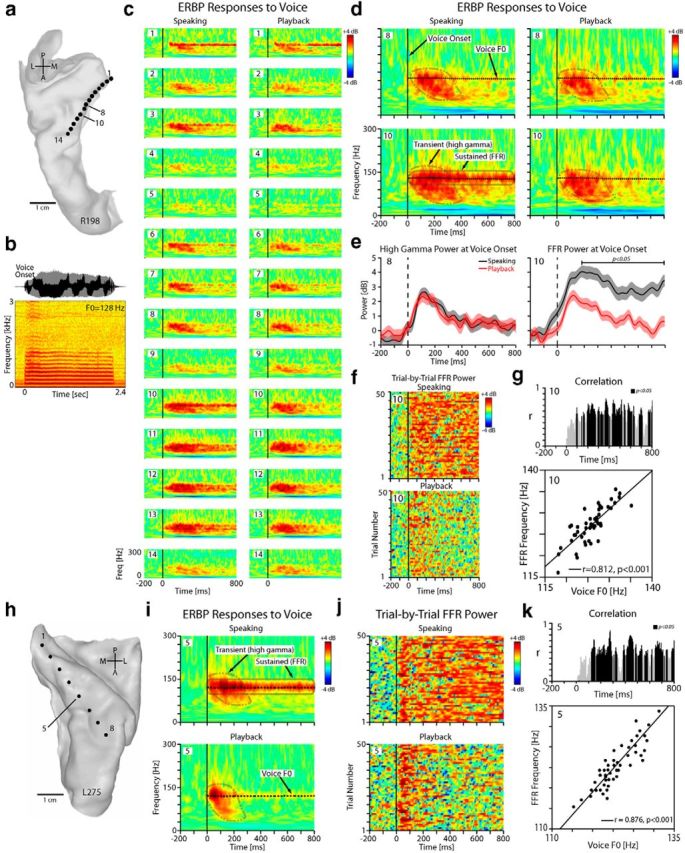
Responses to voice recorded from HG in one right-hemisphere (R198) and one left-hemisphere (L275) subject. a, Top-down view of right superior temporal plane MRI reconstruction showing location of each HDE contact within HG in R198. b, The waveform and spectrogram of a natural vowel sound vocalization for R198. c, Anatomical distribution of ERBP responses (1–300 Hz, ±4 dB) during speaking (left column) and playback (right column) showing strong responses relative to voice onset (time 0, vertical black line) in posteromedial two-thirds of HG in R198. Reference period is −500 to −200 ms before voice onset (i.e., during silence). d, Blown-up time-frequency plots for two representative contacts (#8, #10) in R198 showing transient high gamma responses and sustained FFRs relative to vocalization onset (time 0, solid vertical line). The overlaid dashed black line shows the mean voice F0. e, ERBP profile centered at mean voice F0 (128 ± 5 Hz) in R198 during speaking and playback depicting speaking-induced FFR modulation at contact 10 (right; paired t test, p < 0.05), but no such modulation of FFR is evident at contact 8 (left). f, The raster plot of the trial-by-trial FFR power for contact 10 in R198 during speaking and playback conditions. g, Top, Trajectory of sliding correlation between FFR and voice F0. Bottom, Correlation between trial-by-trial frequency band of the FFR and voice F0 produced for contact 10 during speaking in R198 (r = 0.812, p < 0.001). h, Top-down view of left superior temporal plane in L275. i, Blown-up time-frequency plots for contact 5 in L275 showing transient high gamma responses and sustained FFRs. j, The raster plot of the trial-by-trial FFR power for contact 5 in L275 during speaking and playback conditions. k, Correlation between trial-by-trial frequency band of the FFR and voice F0 produced for contact 5 in L275 during speaking (r = 0.867, p < 0.001).
As highlighted in expanded ERBP plots for two sample recording sites in R198 (contacts #8, #10; Fig. 2d), there were two prominent components of the ERBP responses to voice. The first component was a transient response, which had maximal power within the high gamma frequency range (75–150 Hz) and lasted for ∼400 ms after voice onset. We refer to this as the “high gamma” response. The second response component was a sustained narrow band ERBP increase (bandwidth: 10 Hz) centered on the subject's mean F0 (Fig. 2d, dashed black lines) that persisted throughout the vocalization. We will refer to this as the frequency following response (FFR). The differences in the time courses of the two response types are illustrated in Figure 2e, and FFR modulation by speaking (i.e., speaking-induced alteration of response amplitude) is evident in Figure 2e, f. The trajectory of sliding correlation between FFR and voice F0 is demonstrated in Figure 2g (top). Based on the maximum correlation measure, we found that the FFR responses were significantly correlated with trial-to-trial variation in voice F0 (Fig. 2g, bottom). Likewise, Figure 2h–k shows similar plots for a second example subject (L275), including the reconstructed left HG surface, time-frequency maps of the ERBP responses during speaking versus playback, raster plots of the FFR power, and correlation between FFR frequency and voice F0 for an example contact (#5), respectively.
To begin to understand the implications of each ERBP response type, it is necessary to identify how their respective response patterns were distributed anatomically across HG. Figure 3 shows the group response patterns of both FFR (Fig. 3a) and high gamma (Fig. 3b) responses to voice for all 14 subjects. In each subject, the FFR power was measured by first calculating the voice F0 contours of vowel sound vocalizations within individual trials and then extracting the ERBP around voice F0 (±5 Hz) in the second half of each vocalization epoch (400–800 ms). This time window was chosen so that the overlap between FFR and high gamma responses was minimal (see also Fig. 2d). High gamma responses to voice were calculated as the mean ERBP between 75 and 150 Hz within 0–400 ms after voice onset. To further isolate high gamma responses from FFRs, the extracted FFR power was subtracted from the high gamma responses to voice on a trial-by-trial basis. Responsive sites during speaking and playback (relative to baseline) and those significantly modulated for speaking versus playback were identified for each subject based on the presence of a statistically significant power change in high gamma and FFRs (FDR-corrected paired t test, q < 0.01).
Figure 3.
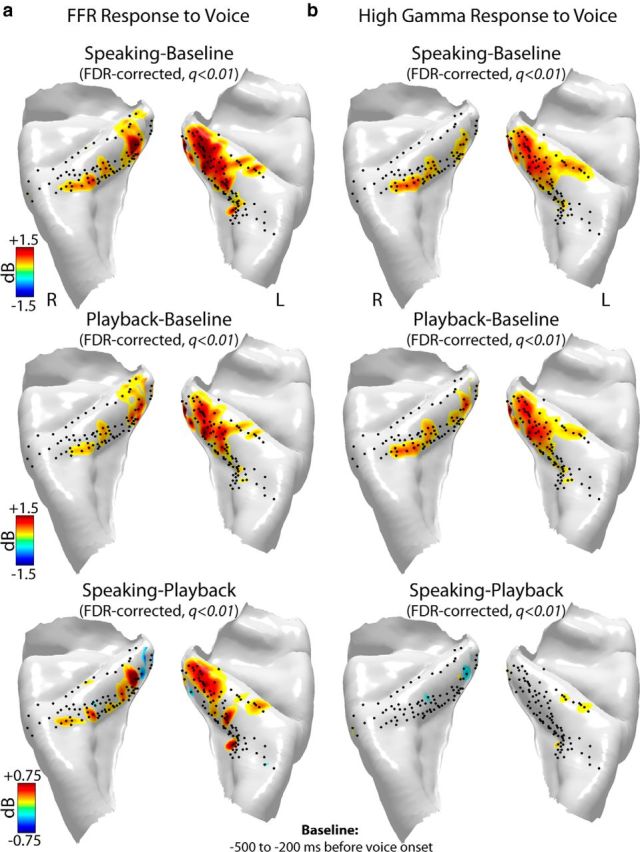
Anatomical distribution of significant (FDR-corrected paired t test, q < 0.01) increases in power of the (a) FFRs and (b) high gamma responses to voice during speaking (top row), playback (middle row), and their contrast (speaking − playback; bottom row) in 14 subjects (8 left and 6 right hemisphere implants) mapped onto a template-reconstructed HG surface. Black dots represent locations of recording contacts in these subjects. High gamma responses were calculated as ERBP increase within 75–150 Hz in a time window at 0–400 ms postvoice onset relative to a prevocalization baseline from −500 to −200 ms. FFRs were calculated as ERBP increase at voice F0 (±5 Hz bandwidth) in a postvocalization time window from 400 to 800 ms relative to the prevocalization baseline period from −500 to −200 ms.
By coregistering all electrode locations from all subjects, it is evident that our recording locations in both left and right-sided implants were heavily biased to the anterior bank and fundus (i.e., dorsal surface) of HG, with limited sampling of the posterior bank. It is also clear that FFR and high gamma response types had significant anatomical overlap with the largest magnitude power increases observed in the medial two-thirds of HG during speaking and playback. A notable difference emerged between FFR and high gamma responses in the degree of response modulation by speaking. By contrasting FFRs during speaking minus those during playback, significant FFR modulations were evident primarily in medial HG (Fig. 3a, lowest panel), whereas very limited or almost no modulation was seen in the high gamma responses (Fig. 3b, lowest panel). These discrepant findings suggest functional parcellation within HG and different roles for FFR and high gamma mechanisms in vocal pitch monitoring during speech production under normal (unaltered) auditory feedback conditions.
As individual depth electrode montages provided sparse anatomic sampling of HG, the amount and location of coverage (e.g., anterior bank, fundus, or posterior bank) differed between left and right sides for the entire series. In addition to the laterality differences visible in Figure 3, Table 1 characterizes HG responses for all subjects. In this table, results are summarized for FFRs and high gamma responses to voice and pitch shift in a total of 107 contacts identified as within the gray matter of left (8 subjects) and 87 contacts in the right HG (6 subjects). For responses to voice, we found that 9 of 14 subjects exhibited significant FFRs in at least one HG contact during speaking or playback conditions. As can be seen in Table 1, the proportion of sites with FFR enhancement (left: 23%; right: 18%) was greater than those that were suppressed (left: 1%; right: 2%) during speaking. The mean magnitude of FFR enhancement during speaking was 0.73 dB (SD 0.06) and 0.68 dB (SD 0.13) in the left and right hemispheres, respectively. In contacts that exhibited FFRs, there was a significant correlation between the frequency of the FFR power increase and voice F0 during both speaking (mean r = 0.786, SD r = 0.113, p < 0.05) and playback (mean r = 0.774, SD r = 0.162, p < 0.05). No significant difference was found for the correlation between FFR and voice F0 during speaking versus playback or left versus right HG.
Table 1.
Summary of vocalization-elicited response patterns observed in HG for all recording contacts and all subjects, as classified by ERBP response typea
| ID | Sex | N | Mean F0 (Hz) | FFR to voice |
High gamma response to voice |
FFR to pitch shift |
High gamma response to pitch shift |
|||||||||||||
|---|---|---|---|---|---|---|---|---|---|---|---|---|---|---|---|---|---|---|---|---|
| SPK | PLY | ENH | SUP | SPK | PLY | ENH | SUP | SPK | PLY | ENH | SUP | SPK | PLY | ENH | SUP | |||||
| Left hemisphere | L162 | Male | 18 | 111 | 7 | 1 | 5 | 1 | 6 | 6 | 1 | 0 | 5 | 1 | 3 | 1 | 5 | 0 | 4 | 2 |
| L173 | Female | 18 | 282 | 0 | 0 | 0 | 0 | 8 | 8 | 0 | 0 | 0 | 0 | 0 | 0 | 7 | 4 | 5 | 0 | |
| L175 | Male | 18 | 114 | 9 | 7 | 5 | 0 | 6 | 6 | 0 | 0 | 6 | 4 | 3 | 0 | 5 | 4 | 3 | 0 | |
| L178 | Male | 18 | 127 | 4 | 4 | 0 | 0 | 7 | 7 | 1 | 0 | 4 | 4 | 0 | 0 | 2 | 2 | 0 | 0 | |
| L206 | Male | 6 | 133 | 0 | 0 | 0 | 0 | 3 | 3 | 0 | 0 | 0 | 0 | 0 | 0 | 1 | 1 | 1 | 0 | |
| L258 | Male | 13 | 132 | 6 | 3 | 5 | 0 | 5 | 5 | 1 | 0 | 5 | 1 | 3 | 0 | 5 | 3 | 2 | 1 | |
| L275 | Male | 8 | 126 | 6 | 4 | 6 | 0 | 6 | 5 | 0 | 0 | 5 | 4 | 5 | 0 | 6 | 5 | 4 | 0 | |
| L282 | Male | 8 | 103 | 8 | 6 | 4 | 0 | 6 | 6 | 0 | 0 | 6 | 3 | 3 | 0 | 4 | 3 | 1 | 0 | |
| Total 107 | 40 | 25 | 25 | 1 | 47 | 46 | 3 | 0 | 31 | 17 | 17 | 1 | 35 | 22 | 20 | 3 | ||||
| 37% | 23% | 23% | 1% | 44% | 43% | 3% | 0% | 29% | 16% | 16% | 1% | 33% | 21% | 19% | 3% | |||||
| Right hemisphere | R154 | Male | 14 | 107 | 9 | 5 | 6 | 2 | 3 | 3 | 0 | 0 | 6 | 2 | 4 | 2 | 0 | 0 | 0 | 1 |
| R180 | Female | 14 | 190 | 0 | 0 | 0 | 0 | 2 | 1 | 1 | 0 | 0 | 0 | 0 | 0 | 4 | 1 | 3 | 0 | |
| R186 | Male | 12 | 110 | 0 | 0 | 0 | 0 | 4 | 4 | 0 | 0 | 0 | 0 | 0 | 0 | 3 | 3 | 1 | 1 | |
| R198 | Male | 14 | 128 | 8 | 5 | 6 | 0 | 7 | 7 | 0 | 0 | 7 | 4 | 4 | 0 | 7 | 0 | 7 | 0 | |
| R210 | Male | 16 | 95 | 6 | 3 | 4 | 0 | 3 | 3 | 0 | 0 | 5 | 1 | 3 | 0 | 4 | 2 | 2 | 0 | |
| R212 | Male | 17 | 140 | 0 | 0 | 0 | 0 | 5 | 8 | 0 | 4 | 0 | 0 | 0 | 0 | 5 | 3 | 3 | 0 | |
| Total 87 | 23 | 13 | 16 | 2 | 24 | 26 | 1 | 4 | 18 | 7 | 11 | 2 | 23 | 9 | 16 | 2 | ||||
| 26% | 14% | 18% | 2% | 27% | 29% | 1% | 5% | 21% | 8% | 13% | 2% | 26% | 10% | 18% | 2% | |||||
aContacts with a significant power increase (paired t test, FDR-corrected at q < 0.01) during speaking (SPK) and playback (PLY) are reported. Responses are identified as enhanced (ENH: speaking > playback) or suppressed (SUP: speaking < playback). FFR power was measured by first calculating the voice F0 contours of vowel sound vocalizations within individual trials and then extracting the ERBP around voice F0 (±5 Hz) in the second half of each vocalization epoch (400–800 ms). This time window was chosen so that the overlap between FFR and high gamma responses was minimal (see Fig. 2d). High gamma responses to voice were calculated as the mean ERBP between 75 and 150 Hz within 0–400 ms after voice onset. High gamma responses to pitch shift were calculated between 0 and 400 ms after pitch-shift onset.
In contrast to FFRs, all 14 subjects showed a significant high gamma response relative to the prevocalization baseline in at least one HG contact during speaking and playback (Table 1). In addition and in contrast to the more commonly observed modulation of FFRs, modulation of high gamma responses to voice during speaking was very rare in HG, and only 3% of contacts in the left and 1% of contacts in the right HG showed significant high gamma enhancement during speaking compared with playback (Table 1). Suppression of high gamma responses to voice was seen only in 5% of right and no left HG contacts.
HG responses to pitch shift
To further probe the role of HG in vocal motor-sensory interactions and feedback control, we used the well-established pitch perturbation paradigm to introduce unexpected pitch shifts in the auditory feedback. Consistent with the responses to voice detailed above, we identified both FFR and high gamma EBRP responses to the pitch-shift stimuli in multiple sites within HG (Fig. 4c). Closer inspection of two exemplary contacts (#8, #10) in Figure 4d shows that both FFRs and high gamma responses were more prominently elicited in response to pitch-shift stimuli during speaking compared with playback. Statistical comparison of the extracted high gamma profiles overlaid for speaking and playback conditions in Figure 4e indicated a significant enhancement of the FFR and high gamma responses to pitch shift during speaking compared with playback (paired t test, p < 0.05). Extraction of the trial-by-trial FFR power revealed its enhancement during speaking (Fig. 4f), and we found that the FFRs were correlated with trial-to-trial pitch shifts in voice auditory feedback (Fig. 4g). Figure 4h–k from a different subject (L275) shows similar time-frequency maps of the ERBP responses to pitch-shift stimulus during speaking versus playback, raster plots of the FFR power, and correlation between FFR frequency and pitch-shifted voice F0 for an example contact (#5).
Figure 4.
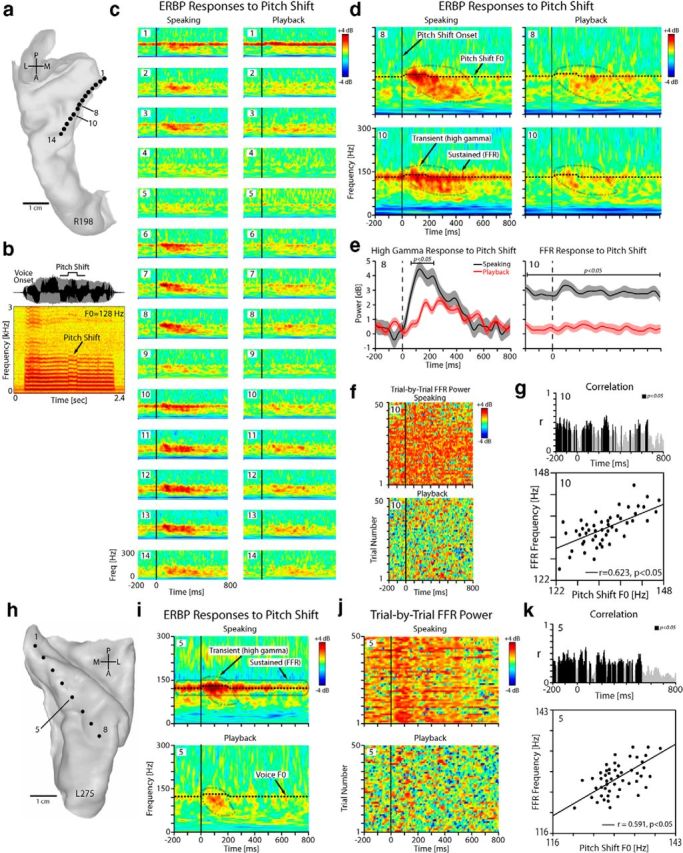
Modulation of HG responses by pitch shift in one right-hemisphere (R198) and one left-hemisphere (L275) subject. a, Top-down view of right superior temporal plane MRI reconstruction showing location of each HDE contact within HG for subject R198. b, The waveform and spectrogram of the pitch-shifted vocalization feedback for R198. c, Time-frequency plots of the ERBP responses to pitch-shifted auditory feedback during speaking (left column) and playback (right column) for all electrode contacts positioned within HG in R198. d, Blown-up version of the time-frequency plots for two representative contacts (#8, #10) in R198 showing transient high gamma power increase in responses to pitch-shift stimulus relative to a reference period from −500 to −200 ms before pitch shift onset. The ongoing FFRs are subtracted out from these plots due to the choice of the reference period. e, The profile of the high gamma responses to pitch shift for contacts 8 and 10 overlaid during speaking and playback in R198. f, The raster plot of the trial-by-trial high gamma power increase in response to pitch-shift stimulus for contact 10 in R198 during speaking and playback conditions. g, Top, Trajectory of sliding correlation between FFR and pitch-shifted voice F0. Bottom, Correlation between trial-by-trial frequency band of the FFR and pitch-shifted voice F0 for contact 10 during speaking in R198 (r = 0.623, p < 0.05). h, Top-down view of left superior temporal plane in L275. i, Time-frequency plots for contact 5 in L275 showing transient high gamma responses and sustained FFRs to pitch-shifted stimulus. j, The raster plot of the trial-by-trial FFR power for contact 5 in L275 during speaking and playback conditions in response to pitch-shift stimulus. k, Correlation between trial-by-trial frequency band of the FFR and pitch-shifted voice F0 for contact 5 in L275 during speaking (r = 0.591, p < 0.05).
Figure 5 shows the anatomical distribution of significant FFR and high gamma responses to pitch-shift stimulus for all subjects during speaking, playback, and their contrast (speaking vs playback). As depicted in Figure 5, similar to responses to voice onset, FFR, and high gamma responses to pitch shifts during speaking and playback were generally of largest magnitude within the posteromedial two-thirds of HG. In addition, the anatomical pattern of speaking-induced modulation of FFRs to pitch shifts was consistent with those in response to voice onset, and it was predominantly observed in contacts within posteromedial HG (Fig. 5a, lowest panel). However, a striking difference emerged as we compared speaking-induced modulation of high gamma responses with pitch shift and voice onset. As can be seen in Figure 3b (lowest panel), high gamma responses to voice onset were not significantly modulated during speaking versus playback; however, we found significant modulation of high gamma responses to pitch shift stimuli prominently in anterolateral HG sites (Fig. 5b, lowest panel). A significant main effect of condition (FDR-corrected paired t test, q < 0.01) in high gamma responses to pitch shift was found in both left and right HG, with a greater proportion of sites showing response enhancement during speaking compared with playback. This difference in pattern of high gamma modulation suggests that the anterolateral HG plays a key role in processing perturbations (errors) in voice auditory feedback for driving subsequent vocal behavior during vocalization.
Figure 5.
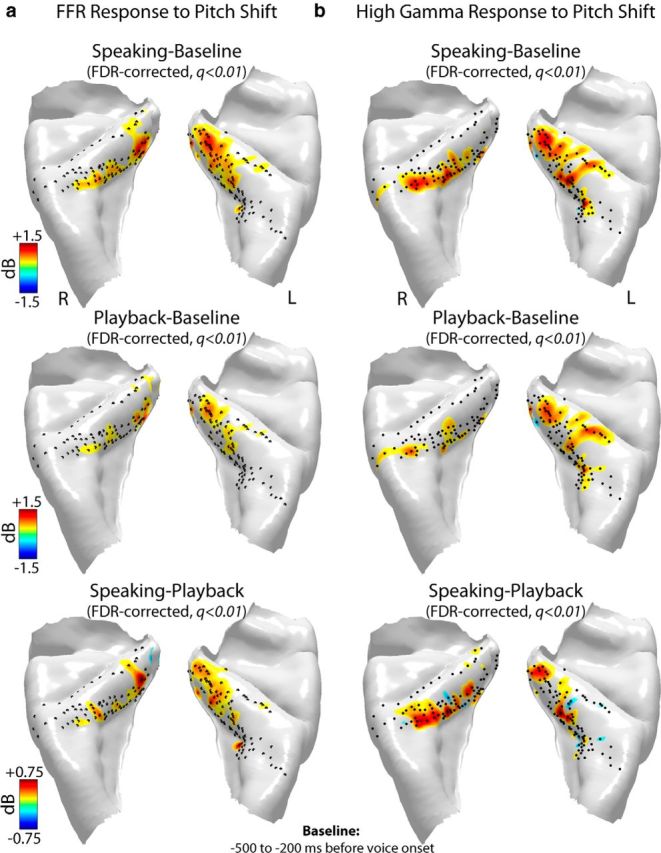
Anatomical distribution of significant (FDR-corrected paired t test, q < 0.01) increases in power of the (a) FFRs and (b) high gamma responses to pitch-shift stimulus during speaking (top row), playback (middle row), and their contrast (speaking − playback; bottom row) in 14 subjects (8 left and 6 right hemisphere implants) mapped onto a template-reconstructed HG surface. Black dots represent locations of recording contacts in these subjects. High gamma responses were calculated as ERBP increase within 75–150 Hz in a time window at 0–400 ms postvoice onset relative to a prevocalization baseline from −500 to −200 ms. FFRs were calculated as ERBP increase at voice F0 (±5 Hz bandwidth) in a postvocalization time window from 400 to 800 ms relative to the prevocalization baseline period from −500 to −200 ms.
We used correlation analyses to further explore the roles of HG FFR and high gamma responses, and augment the visual patterns of anatomical responses evident in contrasting Figures 3 and 5. Figure 6 shows the statistical correlations for each response type (FFR or high gamma) and each condition (speaking, playback, and their contrast). By plotting the magnitude of each response type from each HG contact, we identified strong, significant correlations between magnitudes of FFR and high gamma responses to voice (Fig. 6b), and between amplitudes of FFRs to voice and pitch shift (Fig. 6c). We found no correlation between FFR and high gamma response sizes during pitch shift (Fig. 6d), and correlation of high gamma responses to voice and pitch shift was only significant during the speaking condition (Fig. 6a, left). Collectively, these correlation measures support a dissociation between FFR and high gamma responses and implicate different underlying mechanisms for each. In addition, the correlations combined with the anatomical response patterns suggest that specific subregions of HG subserve different roles in vocal production and motor control.
Figure 6.
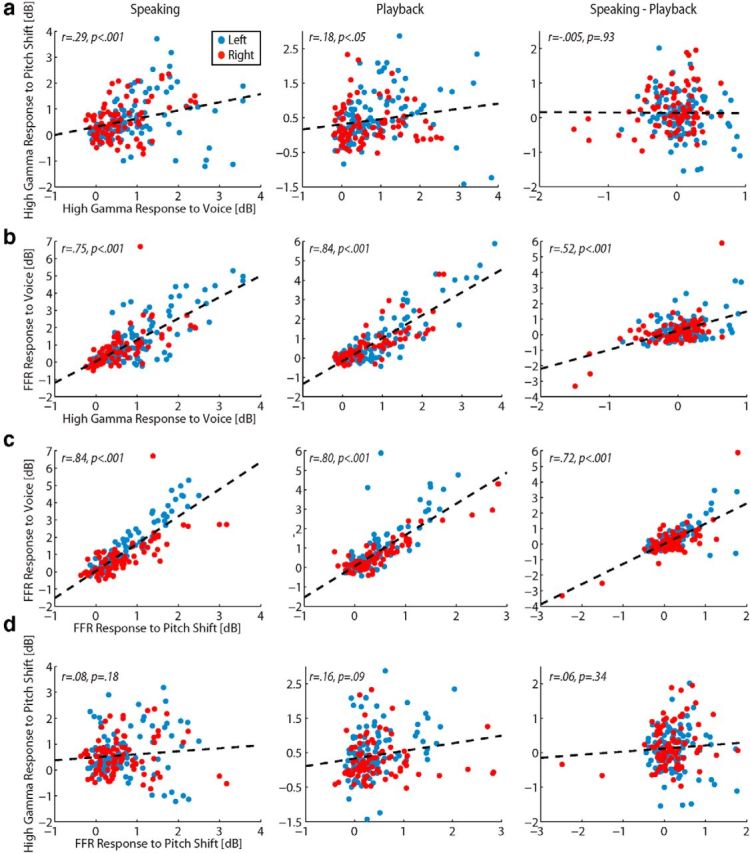
Correlation analyses (Pearson's r method) to examine relationships of FFR and high gamma responses for all conditions. All 107 contacts in the left (blue) and 87 contacts in the right HG (red) for all 14 subjects are shown. a, Correlation of sites showing high gamma responses to pitch shift with high gamma responses to voice only during the speaking condition. b, Strong correlation between sites with FFR responses to voice and high gamma responses to voice. c, Strong correlations between sites with FFRs to voice and pitch shift. No correlation was observed between sites for high gamma responses to pitch shift and FFRs to pitch shift (d).
Correlation between HG activity and vocal compensation to pitch shift
Because pitch-shift stimuli typically cause a speaker to alter his or her speech production (e.g., vocal compensation), we examined the relationship between high gamma activity and degree of vocal compensation to the pitch shift. An example case is summarized in Figure 7 for the same exemplar right (R198) and left (L275) hemisphere subjects. In R198, the peak magnitude and latency of downward compensatory vocal responses to upward 100 Cents pitch-shift stimuli were −33 Cents and 292 ms, respectively (Fig. 7b, bottom). In L275, the peak magnitude and latency of downward compensatory vocal responses were −29 Cents and 274 ms, respectively (Fig. 7d, bottom). Similarly, the group mean magnitude and latency of vocal responses were −24 Cents (SD 8.4) and 318 ms (SD 58.6), respectively, for the 12 of 14 subjects in which we could extract vocal behavior. At a site in the middle third of HG, which demonstrated significant speaking-induced modulation of high gamma response to pitch-shift stimuli (contact 8 in R198 and contact 5 in L275; see also Fig. 3), we found that high gamma power was significantly correlated with the peak magnitude of vocal compensation at multiple time points within a window ranging from 132 to 282 ms in R198 (mean Pearson's r = 0.413, p < 0.05; Fig. 7b, top) and within 105–212 ms in L275 (mean Pearson's r = 0.428, p < 0.05; Fig. 7d, top). We extracted the mean high gamma power within a time window from 100 to 300 ms after pitch-shift stimulus onset and correlated that with the peak magnitude of vocal compensation across all HG contacts in the 12 subjects. Figure 7e shows an example of this analysis for HG contact 8 in subject R198 (top) and for HG contact 5 in L275 (bottom), and illustrates a significant correlation between high gamma power and peak magnitude of vocal compensation (R198: r = 0.45, p = 0.007; L275: r = 0.49, p = 0.002). Unlike the strong correlations we found between high gamma responses and vocal compensation, we observed that no significant correlation was found between vocal compensation peak magnitude and FFRs to pitch-shift stimuli. To determine the anatomical distribution of sites on HG with significant correlation between high gamma response and vocal compensation, we plotted Pearson's r values for all sites for 12 subjects. This summary revealed that the largest degrees of correlation were found at sites located in the anterolateral half of HG (Fig. 7f). Furthermore, this anatomical pattern of correlation closely overlapped with the sites that demonstrated speaking-induced modulation of high gamma power (Fig. 5, bottom row).
Figure 7.
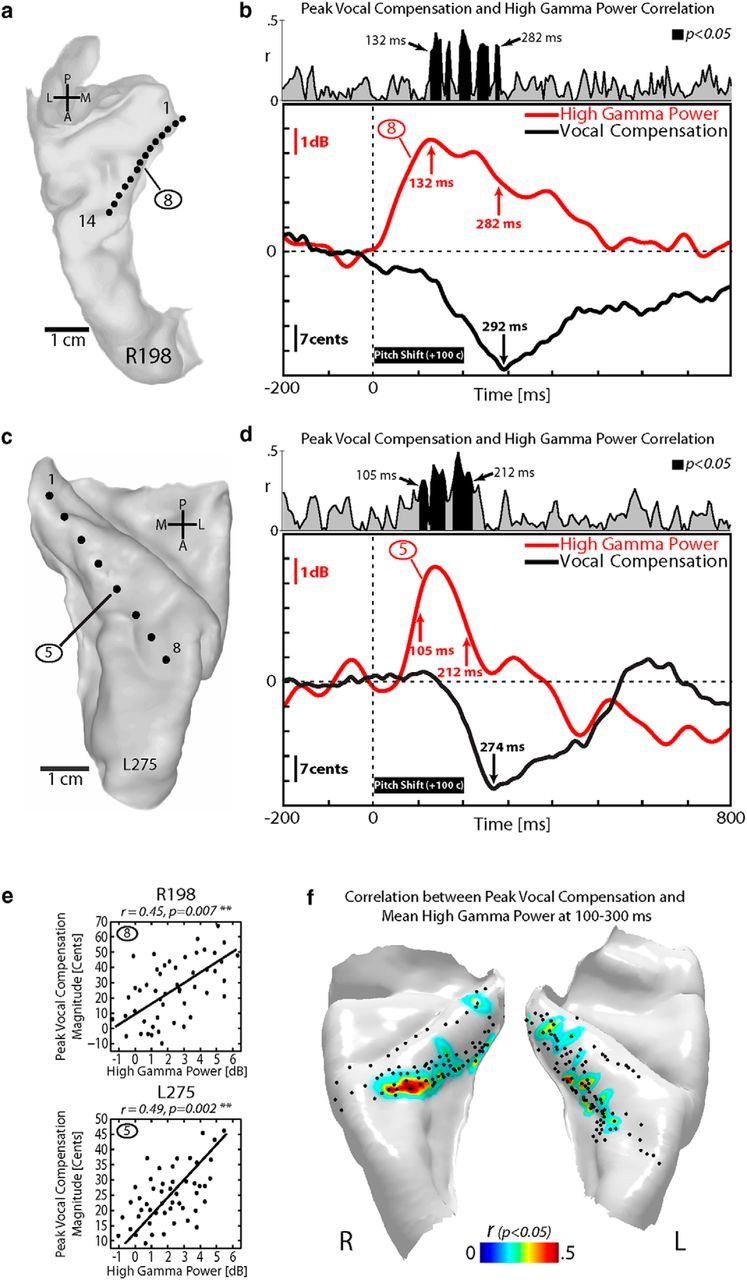
Analysis of behavioral vocal compensation and HG responses to pitch-shift stimulus in one right-hemisphere (R198) and one left-hemisphere (L275) subject. a, Top-down view of right superior temporal plane MRI reconstruction showing HDE recording sites within HG for subject R198. b, Top, Profile of the Pearson's r correlation between high gamma response and the peak magnitude of the compensatory vocal responses to pitch-shift stimuli in R198. Bottom, Mean compensatory vocal response to pitch-shifted auditory feedback during vocalization (black line) overlaid with the profile of high gamma response in a representative HG contact (#8; red line) in R198. Thick black bar represents duration of pitch-shift stimulus (200 ms). c, Top-down view of left superior temporal plane for subject L275. d, Top, Profile of the Pearson's r correlation between high gamma response and the peak magnitude of the compensatory vocal responses to pitch-shift stimuli in L275. Bottom, Mean compensatory vocal response to pitch-shifted auditory feedback during vocalization (black line) overlaid with the profile of high gamma response in a representative HG contact (#5; red line) in L275. e, Single-trial correlation between peak magnitude of vocal responses and high gamma activity for top (the representative HG contact 8 in R198) and bottom (the representative HG contact 5 in L275). f, Anatomical distribution of correlation coefficients between high gamma responses to pitch shifts and peak magnitude of the compensatory vocal responses for all contact in 12 subjects (7 left, 5 right HG) projected onto the average HG template reconstructions.
Discussion
Neural responses to human vocalization in HG
In this study, we present the first findings from direct recordings of neural activity from the human auditory cortex on HG in response to naturally produced vocalizations and pitch-shift stimuli in voice auditory feedback. We identified sustained FFRs that followed the F0 of voice auditory feedback and transient high gamma responses that were correlated with compensatory vocal responses to feedback pitch perturbations. High gamma responses to vocalization onset were predominantly elicited in posteromedial HG during both speaking and playback and were not modulated by the act of speaking. These observations support that high gamma activity in core auditory cortex merely encodes sensory information in voice auditory feedback.
However, in contrast with high gamma responses, we found that the FFRs were significantly modulated by condition, and this modulation was predominantly manifest as a significant increase in FFR power during speaking compared with playback in posteromedial HG. Our data also showed that the speaking-induced enhancement of FFRs was consistently present and did not differ for responses to voice and pitch-shift stimuli. This finding suggests that the functional properties of the neural generators of FFRs to natural human vocalizations differ from those of transient high gamma responses within HG. A possible interpretation for this effect is that the feedforward motor mechanisms alter the frequency tuning of neurons within core auditory cortex to increase their capacity for encoding basic features of natural human vocalizations, such as voice F0. This top-down effect may have important implications for interactions between sensory-motor mechanisms of speech whereby the auditory feedback information is used to monitor and control vocal output parameters for effective vocal communication.
In humans, noninvasive (Houde et al., 2002; Heinks-Maldonado et al., 2005; Behroozmand and Larson, 2011) and invasive (Flinker et al., 2010; Greenlee et al., 2011; Chang et al., 2013) recordings of neural responses from noncore auditory areas within STG have consistently shown suppressive effects during self-vocalization. In those studies, suppression has been discussed within the context of a predictive coding model of speech in which sensory (i.e., auditory) feedback information arising from self-produced vocalizations is cancelled out by top-down vocal motor mechanisms (e.g., efference copies) that provide internal predictions about the incoming feedback. This notion was corroborated by findings indicating that the degree of auditory suppression was maximal when the auditory feedback closely matched internal predictions of the intended self-vocalizations (Behroozmand and Larson, 2011). However, when the auditory feedback was perturbed at voice onset, the suppression was reduced for moderate feedback changes and was almost completely eliminated for large mismatches between self-vocalizations and their auditory feedback (Behroozmand and Larson, 2011). These findings highlighted the importance of top-down vocal motor mechanisms that modulate auditory feedback processing during speech.
Our findings related to the absence of speaking-induced modulation of high gamma responses to voice in HG strengthen the notion that high gamma suppression in the nonprimary auditory cortex is driven by top-down feedforward rather than bottom-up feedback mechanisms. In conjunction with previous findings (Flinker et al., 2010; Greenlee et al., 2011; Chang et al., 2013), our data suggest that speaking suppresses high gamma activity only in noncore (but not core) auditory cortical areas where high-level representation of behaviorally relevant aspects of incoming auditory feedback information is established and used to monitor and control vocal production.
In addition, the observed FFRs to voice onset in this study were similar to those in response to click trains and speech sounds described in earlier studies (Nourski and Brugge, 2011; Steinschneider et al., 2013). Consistent with previous findings (Brugge et al., 2008, 2009), we showed that the FFRs to natural human vocalizations were of greatest magnitude in the posteromedial HG (core) and gradually declined at more anterolateral regions (i.e., noncore belt areas). FFRs were reported to be most prominent for clicks rates at 50–100 Hz but were detectable at rates up to 200 Hz (Brugge et al., 2009). This FFR frequency range encompasses the voice F0 in 12 of 14 subjects in the present study (all males, mean voice F0: 118 Hz; Table 1). For 9 of these subjects, robust FFRs were detected to vocalizations during speaking, playback, or both conditions. Sparse sampling of the cortical tissue and variations in the HG recording locations across subjects are possible reasons for the absence of FFRs in the remaining 3 subjects in the male group. However, the absence of FFRs in the 2 female subjects may be accounted for by the fact that the voice F0s in these subjects (209 and 282 Hz) exceeded the reported frequency range (50–200 Hz) of FFRs to click trains in HG (Brugge et al., 2009). Future study will be needed with to further explore this possible “ceiling” effect and examine speech specificity of HG FFRs.
Results of our analysis indicated that the frequency band of the FFRs was correlated with and tracked the F0 of normal (unaltered) and pitch-shifted voice auditory feedback. In addition, we showed that the power of the FFRs to voice onset was correlated with the power of the FFRs to pitch-shift stimuli, suggesting that these two responses arise from a common neural mechanism that encodes periodicity in voice auditory feedback. Correlation between FFRs and high gamma responses to voice also supports association between these responses.
Neural responses to pitch-shifted auditory feedback in HG
Analysis of ERBP responses to pitch-shift stimuli revealed that the high gamma responses were significantly increased during speaking compared with playback in multiple sites both within and lateral to the core, and this enhancement was independent of the presence or absence of FFRs in a specific HG contact. This speaking-induced enhancement effect is consistent with previous findings in primates (Eliades and Wang, 2008) and humans (Behroozmand et al., 2009; Chang et al., 2013; Greenlee et al., 2013) and indicates that high gamma responses are a neural marker of prediction error signals that are generated as a result of mismatches between internally predicted and actual auditory feedback from vocal pitch output. This notion is further supported by our findings showing that high gamma responses to voice onset were not modulated during speaking in the absence of mismatch between voice and its auditory feedback. Recent models of anatomical connectivity have suggested that high-frequency cortical oscillations (e.g., high gamma) are a compelling candidate for the mechanisms by which prediction error signals are transmitted across different brain regions while humans process mismatches between multiple streams of incoming sensory feedback stimuli (Arnal et al., 2011; Bastos et al., 2012). Consistent with those models, a recent study has demonstrated high gamma coherence between frontal and temporal cortices as a measure of functional connectivity and its modulation during speaking (Kingyon et al., 2015).
In the present study, our data provided evidence that the neural representations of these prediction error signals are enhanced by top-down vocal motor mechanisms and are propagated from the auditory to vocal motor system to drive subsequent compensatory vocal responses that control voice F0 in response to pitch perturbations in the auditory feedback. This notion is supported by our findings indicating a significant correlation between high gamma power and peak magnitude of compensatory vocal responses to pitch-shift stimuli. We showed that the high gamma responses are highly sensitive to acoustic disparities between the intended vocalization F0 and its actual auditory feedback during speaking, and they serve as a robust neural predictor of vocal behavior with stronger high gamma responses associated with larger compensatory vocal reactions for vocal pitch motor control. Based on this property, it can be proposed that, in addition to FFRs, high gamma responses are also involved in representing voice F0 information within HG, supporting the concept of dual processing mechanisms for encoding periodicity in the auditory cortex (Wang, 2007). These combined properties provide evidence for interactions between the vocal motor system and auditory cortex on HG that may play a key functional role in online monitoring and control of voice F0 using auditory feedback information.
In the context of a dual processing system for sensory-motor interaction (Rauschecker and Scott, 2009; Hickok et al., 2011; Rauschecker, 2012), the anteroventral pathway is purported to subserve speech perception functions, whereas the posterodorsal pathway is posited to be related to speech production and motor control. Reciprocal connections between belt and parabelt regions and core auditory cortex, as described in the monkey (Hackett et al., 1998, 2014; Kaas and Hackett, 1999; Hackett, 2008, 2011), if present in humans could potentially transmit top-down motor commands (efference copies) to core auditory cortex, providing an interface for sensory-motor interactions to monitor and correct vocal output using the auditory feedback. Human ECoG studies have shown robust functional connectivity between core auditory cortex and surrounding auditory fields (Brugge et al., 2003) as well as between auditory cortex on HG and ventral prefrontal cortex (Garell et al., 2013; Kingyon et al., 2015). Thus, although the data from the present study do not delineate the anatomical pathways that are engaged to modulating auditory feedback processing during vocal production, they are consistent with available evidence for functional interactions between sensory-motor cortical networks considered to be involved in speech motor control.
Footnotes
This work was supported by the National Institute of Health Grants K23DC009589 and R01DC04290. We thank Richard Reale, Ariane Rhone, Haiming Chen, and Rachel Gold for help with data collection and analysis.
The authors declare no competing financial interests.
References
- Arnal LH, Wyart V, Giraud AL. Transitions in neural oscillations reflect prediction errors generated in audiovisual speech. Nat Neurosci. 2011;14:797–801. doi: 10.1038/nn.2810. [DOI] [PubMed] [Google Scholar]
- Bastos AM, Usrey WM, Adams RA, Mangun GR, Fries P, Friston KJ. Canonical microcircuits for predictive coding. Neuron. 2012;76:695–711. doi: 10.1016/j.neuron.2012.10.038. [DOI] [PMC free article] [PubMed] [Google Scholar]
- Behroozmand R, Larson CR. Error-dependent modulation of speech-induced auditory suppression for pitch-shifted voice feedback. BMC Neurosci. 2011;12:54. doi: 10.1186/1471-2202-12-54. [DOI] [PMC free article] [PubMed] [Google Scholar]
- Behroozmand R, Karvelis L, Liu H, Larson CR. Vocalization-induced enhancement of the auditory cortex responsiveness during voice F0 feedback perturbation. Clin Neurophysiol. 2009;120:1303–1312. doi: 10.1016/j.clinph.2009.04.022. [DOI] [PMC free article] [PubMed] [Google Scholar]
- Benjamini Y, Hochberg Y. Controlling the false discovery rate: a practical and powerful approach to multiple testing. J R Stat Soc Series B Stat Methodol. 1995;57:289–300. [Google Scholar]
- Boersma P, Weenink D. Praat, a system for doing phonetics by computer. Glot Int. 2001;5:341–345. [Google Scholar]
- Brugge JF, Volkov IO, Garell PC, Reale RA, Howard MA., 3rd Functional connections between auditory cortex on Heschl's gyrus and on the lateral superior temporal gyrus in humans. J Neurophysiol. 2003;90:3750–3763. doi: 10.1152/jn.00500.2003. [DOI] [PubMed] [Google Scholar]
- Brugge JF, Volkov IO, Oya H, Kawasaki H, Reale RA, Fenoy A, Steinschneider M, Howard MA., 3rd Functional localization of auditory cortical fields of human: click-train stimulation. Hear Res. 2008;238:12–24. doi: 10.1016/j.heares.2007.11.012. [DOI] [PMC free article] [PubMed] [Google Scholar]
- Brugge JF, Nourski KV, Oya H, Reale RA, Kawasaki H, Steinschneider M, Howard MA., 3rd Coding of repetitive transients by auditory cortex on Heschl's gyrus. J Neurophysiol. 2009;102:2358–2374. doi: 10.1152/jn.91346.2008. [DOI] [PMC free article] [PubMed] [Google Scholar]
- Chang EF, Niziolek CA, Knight RT, Nagarajan SS, Houde JF. Human cortical sensorimotor network underlying feedback control of vocal pitch. Proc Natl Acad Sci U S A. 2013;110:2653–2658. doi: 10.1073/pnas.1216827110. [DOI] [PMC free article] [PubMed] [Google Scholar]
- Chevillet M, Riesenhuber M, Rauschecker JP. Functional correlates of the anterolateral processing hierarchy in human auditory cortex. J Neurosci. 2011;31:9345–9352. doi: 10.1523/JNEUROSCI.1448-11.2011. [DOI] [PMC free article] [PubMed] [Google Scholar]
- Chung MK, Robbins SM, Dalton KM, Davidson RJ, Alexander AL, Evans AC. Cortical thickness analysis in autism with heat kernel smoothing. Neuroimage. 2005;25:1256–1265. doi: 10.1016/j.neuroimage.2004.12.052. [DOI] [PubMed] [Google Scholar]
- Eliades SJ, Wang X. Neural substrates of vocalization feedback monitoring in primate auditory cortex. Nature. 2008;453:1102–1106. doi: 10.1038/nature06910. [DOI] [PubMed] [Google Scholar]
- Eliades SJ, Wang X. Neural correlates of the Lombard effect in primate auditory cortex. J Neurosci. 2012;32:10737–10748. doi: 10.1523/JNEUROSCI.3448-11.2012. [DOI] [PMC free article] [PubMed] [Google Scholar]
- Flinker A, Chang EF, Kirsch HE, Barbaro NM, Crone NE, Knight RT. Single-trial speech suppression of auditory cortex activity in humans. J Neurosci. 2010;30:16643–16650. doi: 10.1523/JNEUROSCI.1809-10.2010. [DOI] [PMC free article] [PubMed] [Google Scholar]
- Garell PC, Bakken H, Greenlee JD, Volkov I, Reale RA, Oya H, Kawasaki H, Howard MA, Brugge JF. Functional connection between posterior superior temporal gyrus and ventrolateral prefrontal cortex in human. Cereb Cortex. 2013;23:2309–2321. doi: 10.1093/cercor/bhs220. [DOI] [PMC free article] [PubMed] [Google Scholar]
- Greenlee JD, Jackson AW, Chen F, Larson CR, Oya H, Kawasaki H, Chen H, Howard MA., 3rd Human auditory cortical activation during self-vocalization. PLoS One. 2011;6:e14744. doi: 10.1371/journal.pone.0014744. [DOI] [PMC free article] [PubMed] [Google Scholar]
- Greenlee JD, Behroozmand R, Larson CR, Jackson AW, Chen F, Hansen DR, Oya H, Kawasaki H, Howard MA., 3rd Sensory-motor interactions for vocal pitch monitoring in non-primary human auditory cortex. PLoS One. 2013;8:e60783. doi: 10.1371/journal.pone.0060783. [DOI] [PMC free article] [PubMed] [Google Scholar]
- Guenther FH, Ghosh SS, Tourville JA. Neural modeling and imaging of the cortical interactions underlying syllable production. Brain Lang. 2006;96:280–301. doi: 10.1016/j.bandl.2005.06.001. [DOI] [PMC free article] [PubMed] [Google Scholar]
- Hackett TA. Anatomical organization of the auditory cortex. J Am Acad Audiol. 2008;19:774–779. doi: 10.3766/jaaa.19.10.5. [DOI] [PubMed] [Google Scholar]
- Hackett TA. Information flow in the auditory cortical network. Hear Res. 2011;271:133–146. doi: 10.1016/j.heares.2010.01.011. [DOI] [PMC free article] [PubMed] [Google Scholar]
- Hackett TA, Stepniewska I, Kaas JH. Subdivisions of auditory cortex and ipsilateral cortical connections of the parabelt auditory cortex in macaque monkeys. J Comp Neurol. 1998;394:475–495. doi: 10.1002/(SICI)1096-9861(19980518)394:4%3C475::AID-CNE6%3E3.0.CO%3B2-Z. [DOI] [PubMed] [Google Scholar]
- Hackett TA, de la Mothe LA, Camalier CR, Falchier A, Lakatos P, Kajikawa Y, Schroeder CE. Feedforward and feedback projections of caudal belt and parabelt areas of auditory cortex: refining the hierarchical model. Front Neurosci. 2014;8:72. doi: 10.3389/fnins.2014.00072. [DOI] [PMC free article] [PubMed] [Google Scholar]
- Heinks-Maldonado TH, Mathalon DH, Gray M, Ford JM. Fine-tuning of auditory cortex during speech production. Psychophysiology. 2005;42:180–190. doi: 10.1111/j.1469-8986.2005.00272.x. [DOI] [PubMed] [Google Scholar]
- Hickok G, Poeppel D. 2007;8:393–403. doi: 10.1038/nrn2113. processing. [DOI] [PubMed] [Google Scholar]
- Hickok G, Houde J, Rong F. Sensorimotor integration in speech processing: computational basis and neural organization. Neuron. 2011;69:407–422. doi: 10.1016/j.neuron.2011.01.019. [DOI] [PMC free article] [PubMed] [Google Scholar]
- Houde JF, Chang EF. The cortical computations underlying feedback control in vocal production. Curr Opin Neurobiol. 2015;33:174–181. doi: 10.1016/j.conb.2015.04.006. [DOI] [PMC free article] [PubMed] [Google Scholar]
- Houde JF, Nagarajan SS. Speech production as state feedback control. Front Hum Neurosci. 2011;5:82. doi: 10.3389/fnhum.2011.00082. [DOI] [PMC free article] [PubMed] [Google Scholar]
- Houde JF, Nagarajan SS, Sekihara K, Merzenich MM. Modulation of the auditory cortex during speech: an MEG study. J Cogn Neurosci. 2002;14:1125–1138. doi: 10.1162/089892902760807140. [DOI] [PubMed] [Google Scholar]
- Howard MA, 3rd, Volkov IO, Abbas PJ, Damasio H, Ollendieck MC, Granner MA. A chronic microelectrode investigation of the tonotopic organization of human auditory cortex. Brain Res. 1996;724:260–264. doi: 10.1016/0006-8993(96)00315-0. [DOI] [PubMed] [Google Scholar]
- Howard MA, Volkov IO, Mirsky R, Garell PC, Noh MD, Granner M, Damasio H, Steinschneider M, Reale RA, Hind JE, Brugge JF. Auditory cortex on the human posterior superior temporal gyrus. J Comp Neurol. 2000;416:79–92. doi: 10.1002/(SICI)1096-9861(20000103)416:1%3C79::AID-CNE6%3E3.0.CO%3B2-2. [DOI] [PubMed] [Google Scholar]
- Jenkinson M, Bannister P, Brady M, Smith S. Improved optimization for the robust and accurate linear registration and motion correction of brain images. Neuroimage. 2002;17:825–841. doi: 10.1006/nimg.2002.1132. [DOI] [PubMed] [Google Scholar]
- Kaas JH, Hackett TA. “What” and “where” processing in auditory cortex. Nat Neurosci. 1999;2:1045–1047. doi: 10.1038/15967. [DOI] [PubMed] [Google Scholar]
- Kingyon J, Behroozmand R, Kelley R, Oya H, Kawasaki H, Narayanan NS, Greenlee JD. High-gamma band fronto-temporal coherence as a measure of functional connectivity in speech motor control. Neuroscience. 2015;305:15–25. doi: 10.1016/j.neuroscience.2015.07.069. [DOI] [PMC free article] [PubMed] [Google Scholar]
- Kuśmierek P, Ortiz M, Rauschecker JP. Sound-identity processing in early areas of the auditory ventral stream in the macaque. J Neurophysiol. 2012;107:1123–1141. doi: 10.1152/jn.00793.2011. [DOI] [PMC free article] [PubMed] [Google Scholar]
- Lane H, Tranel B. The Lombard sign and the role of hearing in speech. J Speech Hear Res. 1971;14:677–709. doi: 10.1044/jshr.1404.677. [DOI] [Google Scholar]
- Larson CR. Cross-modality influences in speech motor control: the use of pitch shifting for the study of F0 control. J Commun Disord. 1998;31:489–502. doi: 10.1016/S0021-9924(98)00021-5. quiz 502–503; 553. [DOI] [PubMed] [Google Scholar]
- Nourski KV, Brugge JF. Representation of temporal sound features in the human auditory cortex. Rev Neurosci. 2011;22:187–203. doi: 10.1515/RNS.2011.016. [DOI] [PubMed] [Google Scholar]
- Nourski KV, Reale RA, Oya H, Kawasaki H, Kovach CK, Chen H, Howard MA, 3rd, Brugge JF. Temporal envelope of time-compressed speech represented in the human auditory cortex. J Neurosci. 2009;29:15564–15574. doi: 10.1523/JNEUROSCI.3065-09.2009. [DOI] [PMC free article] [PubMed] [Google Scholar]
- Nourski KV, Brugge JF, Reale RA, Kovach CK, Oya H, Kawasaki H, Jenison RL, Howard MA., 3rd Coding of repetitive transients by auditory cortex on posterolateral superior temporal gyrus in humans: an intracranial electrophysiology study. J Neurophysiol. 2013;109:1283–1295. doi: 10.1152/jn.00718.2012. [DOI] [PMC free article] [PubMed] [Google Scholar]
- Nourski KV, Steinschneider M, McMurray B, Kovach CK, Oya H, Kawasaki H, Howard MA., 3rd Functional organization of human auditory cortex: investigation of response latencies through direct recordings. Neuroimage. 2014;101:598–609. doi: 10.1016/j.neuroimage.2014.07.004. [DOI] [PMC free article] [PubMed] [Google Scholar]
- Oya H, Kawasaki H, Howard MA, 3rd, Adolphs R. Electrophysiological responses in the human amygdala discriminate emotion categories of complex visual stimuli. J Neurosci. 2002;22:9502–9512. doi: 10.1523/JNEUROSCI.22-21-09502.2002. [DOI] [PMC free article] [PubMed] [Google Scholar]
- Rauschecker JP. Ventral and dorsal streams in the evolution of speech and language. Front Evol Neurosci. 2012;4:7. doi: 10.3389/fnevo.2012.00007. [DOI] [PMC free article] [PubMed] [Google Scholar]
- Rauschecker JP, Scott SK. Maps and streams in the auditory cortex: nonhuman primates illuminate human speech processing. Nat Neurosci. 2009;12:718–724. doi: 10.1038/nn.2331. [DOI] [PMC free article] [PubMed] [Google Scholar]
- Reddy CG, Dahdaleh NS, Albert G, Chen F, Hansen D, Nourski K, Kawasaki H, Oya H, Howard MA., 3rd A method for placing Heschl gyrus depth electrodes. J Neurosurg. 2010;112:1301–1307. doi: 10.3171/2009.7.JNS09404. [DOI] [PMC free article] [PubMed] [Google Scholar]
- Romanski LM, Averbeck BB. The primate cortical auditory system and neural representation of conspecific vocalizations. Annu Rev Neurosci. 2009;32:315–346. doi: 10.1146/annurev.neuro.051508.135431. [DOI] [PMC free article] [PubMed] [Google Scholar]
- Steinschneider M, Nourski KV, Fishman YI. Representation of speech in human auditory cortex: is it special? Hear Res. 2013;305:57–73. doi: 10.1016/j.heares.2013.05.013. [DOI] [PMC free article] [PubMed] [Google Scholar]
- Tsunada J, Lee JH, Cohen YE. Representation of speech categories in the primate auditory cortex. J Neurophysiol. 2011;105:2634–2646. doi: 10.1152/jn.00037.2011. [DOI] [PMC free article] [PubMed] [Google Scholar]
- Wang X. Neural coding strategies in auditory cortex. Hear Res. 2007;229:81–93. doi: 10.1016/j.heares.2007.01.019. [DOI] [PubMed] [Google Scholar]
- Wolpert DM, Diedrichsen J, Flanagan JR. Principles of sensorimotor learning. Nat Rev Neurosci. 2011;12:739–751. doi: 10.1038/nrn3112. [DOI] [PubMed] [Google Scholar]
- Yeo BT, Sabuncu MR, Vercauteren T, Ayache N, Fischl B, Golland P. Spherical demons: fast diffeomorphic landmark-free surface registration. IEEE Trans Med Imaging. 2010;29:650–668. doi: 10.1109/TMI.2009.2030797. [DOI] [PMC free article] [PubMed] [Google Scholar]