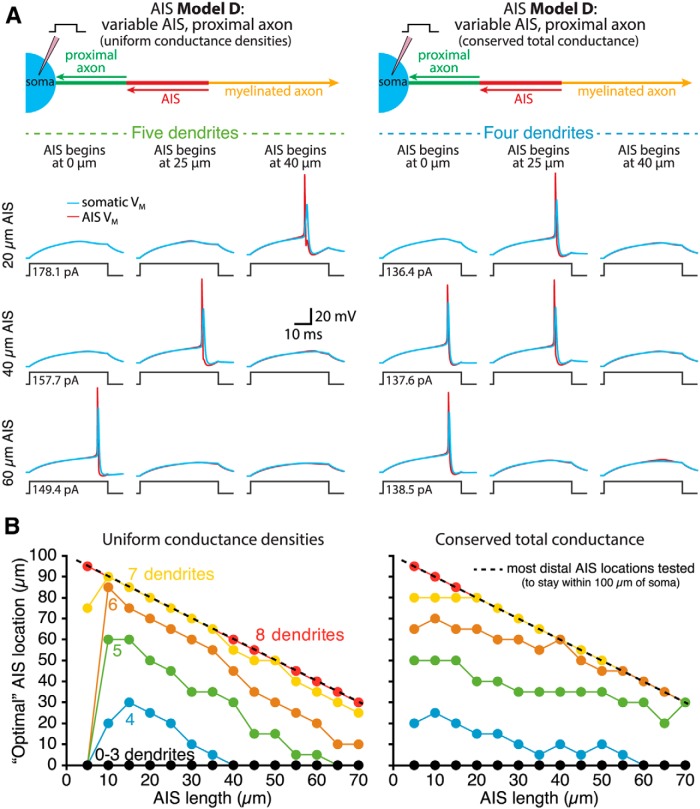
Figure 6.
Interaction of AIS length and location in setting neuron excitability. A, Diagrams (top) of the proximal axons of ball-and-stick neurons having variable-length AISs located at different distances from the soma (AIS Model D). The AISs had either uniform sodium and potassium conductance densities (i.e., sodium and potassium conductances increased with length; left) or conserved total sodium and potassium conductances (i.e., length-independent conductances; right). Voltage traces show somatic (blue) and AIS (red) responses to somatic current injections in model neurons having the indicated AIS lengths and locations. Note that in the 40-µm-long AIS model with conserved total conductances, rheobase (to the nearest 100 fA) was identical in models having the AIS beginning at 0 or 25 µm from the soma (minimal rheobase in this model occurred when the AIS was 10 µm from the soma). B, Plots of optimal (i.e., lowest rheobase current) AIS position for each AIS length in models having “uniform conductance densities” (left) or “conserved total conductances” (right) in the AIS.

