Abstract
A fast (up to video rate) two-photon excited fluorescence lifetime imaging system based on interleaved digitization is demonstrated. The system is compatible with existing beam-scanning microscopes with minor electronics and software modification. Proof-of-concept demonstrations were performed using laser dyes and biological tissue.
Fluorescence lifetime imaging (FLIM) is now routinely employed for studies inside living cells and biological tissues in different fields of science including cell biology [1], tissue imaging [2], drug delivery [3], and forensic science and law enforcement [4]. Fluorescence lifetime provides an environment-specific contrast mechanism that complements intensity-based information, extending the range of applications using fluorescence measurement. For example, fluorescence lifetime multiplexing strategy distinguishes different probes based on lifetime. While traditional intensity-based measurements suffer from signal cross-talk and signal bleeding problems, lifetime-based multiplexing can use fluorescence probes with similar spectral characteristics with each other or with the auto-fluorescing species in the biological sample to avoid the aforementioned problems [5]. FLIM is sensitive to local environmental conditions such as pH, temperature, and ion concentration [6]. Additionally, FLIM is well suited for studying cell dynamics and functions, as fluorescence lifetime is influenced by protein orientation or binding events [1]. For example, FLIM has been employed to measure the lifetime difference between free (short lifetime) and bound (long lifetime) forms of NADH, which is used to assess brain functions [7]; FRET-induced lifetime attenuation of dyes has been applied to DNA analysis [8]. FLIM is also relatively robust against both variations in concentration and nonuniform fluorescence collection efficiency.
Despite these advantages in lifetime imaging over traditional intensity-based imaging, many challenges remain for routine application of FLIM in practical in vivo applications. Most notably, conventional fluorescence imaging from single-photon excitation typically has a limited penetration depth within biological tissues. Multiple scattering events in the visible spectral window increase blurring and reduce penetration depths, typically allowing analysis no greater than 100 μm below the surface [9].
A substantial improvement in penetration depths is realized by coupling two-photon excitation with FLIM [9]. Molecules are typically excited by a pulsed laser in the near-infrared (NIR) region and emit in visible region. Two-photon excited fluorescence has the distinct advantage of enabling high-resolution imaging in scattering media by localizing the fluorescence excitation to just the focal volume. The use of a NIR laser source further reduces scattering losses of the excitation laser. Two-photon excited fluorescence lifetime imaging (TPE-FLIM) is typically performed using fast single-channel photodetectors (e.g., photomultiplier tube, PMT, or avalanche photodiode, APD) that can be easily parallelized for multi-channel detection and can detect low levels of light with high-quantum efficiency.
Despite the promise of TPE-FLIM for enabling imaging through turbid media, live-sample imaging requires frame rates difficult to achieve in conventional raster beam-scanning approaches. The speed of data acquisition is advantageous for in vivo imaging to capture the fast dynamics within the biological system and correct for sample motion associated with cardiovascular and respiratory activity. However, with time-correlated single photon counting (TCSPC), the most commonly used detection technique for time-domain lifetime measurement, the data acquisition speed is limited by Poisson statistics. A histogram of photon arrival time is typically built from hundreds to thousands of single-photon events, with the probability of photon detection usually maintained at less than 1%–5% to avoid biasing toward shorter lifetimes [10]. Consequently, to generate a lifetime map from a single exponential decay data for a 512 by 512 pixels image, the data acquisition time can require more than an hour for recovery of high-precision lifetime values. While much higher speeds can be obtained by parallelization of the lifetime measurements across whole lines or even entire images [11], such strategies are incompatible with beam-scanning configurations typically used in TPEF. Therefore, improvements to increase measurement speed and reduce data acquisition time would expand the scope of applications of TPE-FLIM for in vivo imaging.
We propose here a new instrumental approach for fast (up to video rate) TPE-FLIM based on interleaved digitization of continuously streamed data. Fast digital oscilloscope cards digitize using a clock derived directly from the laser and stream data continuously. By introducing a beat pattern between the laser repetition rate and the digitization times (i.e., interleaved synchronous digitization), temporal resolution was improved from 2 to 0.5 ns in acquisition electronics. This approach has the distinct advantage of being directly compatible with existing TPEF microscopes through relatively simple modification of the data acquisition electronics and data analysis methods.
The work flow of the imaging system presented in this Letter is depicted in Fig. 1. A titanium:sapphire laser system (Spectra-Physics, Mountain View, California) was used as the two-photon excitation source. Beam scanning was performed using a galvanometer-driven mirror (Cambridge Technologies) for the slow-scan axis and a resonantly driven mirror (EOPC) at approximately 8 kHz for the fast-scan axis. The minimum perpixel dwell time was 50 ns in the central field of view and slightly longer at the edges due to the sinusoidal trajectory of the resonant scanner. Long-wavelength light leads to heat deposition as the dominant damage mechanism, rather than multiphoton absorption at visible wavelength. At this wavelength with fast scanning, perturbations are minimal. Fluorescence signal was collected in the epi-direction (i.e., back through the same objective) utilizing a fast photomultiplier tube (PMT, Hamamatsu, H10721-210). Data from model dye systems were acquired with 940-nm excitation, and a 525 ± 25 nm bandpass filter was used to reject unwanted spectral responses. Measurements of collagen samples were acquired using a 700-nm source and a band pass filter centered at 450 nm (±50 nm). The laser power for excitation was typically 150 mW at the sample for the studies of dyes and 200 mW for the video-rate measurements and imaging of collagen. The movie was acquired and displayed at 15 frames per second. Precise timing control was maintained to enable the reconstruction of high-resolution images. An external 10-MHz phase-lock loop (PLL) synchronous with the 80-MHz master clock from the Ti:sapphire laser was fed to a custombuilt resonant mirror control box that drove the resonant mirror at 10240 clock ticks, corresponding to 7.8 KHz. The output of the 10-MHz PLL was also sent to PCI Express digital oscilloscope cards (AlazarTech, ATS 9350), which allowed for continuous streaming of every individual detection event simultaneously relative to the firing of the laser on up to 4 channels, although only 2 channels were used to perform the experiments described herein.
Fig. 1.

Work flow for the FLIM system based on interleaved digitization.
In the imaging system demonstrated in this Letter, a 4× interleaved digitization strategy was used, illustrated in Fig. 1. The PCI express digital oscilloscope cards were operating at 500 MHz, corresponding to 6.25 digitization windows for every fluorescence decay initiated by the 80-MHz laser. At each pixel, the initiation of the digitization was synchronized with the first laser pulse at time 0 in Fig. 1, and 25 unique intensity points from a total of four fluorescence decays were sampled at 2-nanosecond time intervals. Synchronization between digitization and fluorescence events was reestablished at the fifth laser pulse due to the interleave pattern induced by the disparity of the operating frequencies of the laser (80 MHz) and the PCI Express digital oscilloscope cards (500 MHz). The time-traces from four fluorescence decays were then pooled to reconstruct the full fluorescence decay at each pixel with a temporal resolution fourfold greater than the digitization rate. Using an approach developed previously [12], binomial photon counting was performed in each bin using a software threshold selected based on measurement of the detector single-photon response. Binomial counting incorporates simultaneous multiple-photon events to extend the dynamic range of conventional photon counting.
Lifetime was recovered by fitting the fluorescence intensity decay to a single exponential function. However, at 500-MHz digitization rate, the response times of the PMTs are nonnegligible. The decays were recovered by deconvolution with the impulse response function (IRF) (vide infra). Alternatively, a computationally faster approach was taken for the analysis of lifetime images and movie, in which lifetimes were evaluated by simply excluding the data points corresponding to the rise time of the PMT response, provided the measurements are performed with sufficient signal to noise.
Fluorescein and coumarin 6 (Alfa Aesar) and all solvents (Mallinckrodt chemicals) were used without further purification. The final concentrations of fluorescein (in water) and coumarin 6 (in chloroform) solutions were 30 and 40 μM, respectively. An immiscible mixture was produced by combining 200 μL of each solution with ∼1 mg of sodium dodecyl sulfate (SDS) added to the mixture. Both pure solutions and the mixture were examined. A 30-μm-thick mouse tail specimen was prepared using a cryostat then transferred to the imaging system.
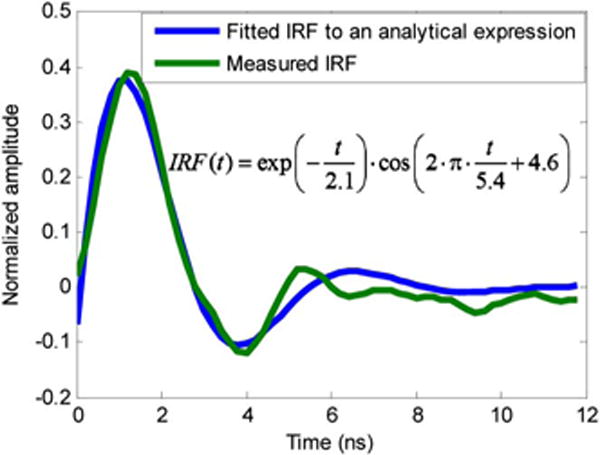
To assess the performance of the proposed imaging system using dyes with established decay behaviors, lifetime images of a heterogeneous mixture of a fluorescein aqueous solution and a coumarin 6 (in chloroform) solution were acquired as well as the measured lifetime of each individual solution. The recovered lifetime of coumarin 6 and fluorescein were 3.44 ± 0.04 ns and 5.34 ± 0.06 ns, respectively, while the previously reported lifetimes for coumarin 6 and fluorescein are 2.5 ns [13] and 4 ns [14] (in butanol). This disparity in measured lifetime is tentativly attributed to convolution of the fluorescence decay with the IRF. To assess this mechanism, the IRF was independently measured using a 5 Gs∕s oscilloscope (Tektronix TDS 3054B) and was subsequently fit to the product of an exponential decay with a cosine function, as shown in Fig. 2. This functional form was chosen to represent the combination of a resistance/capacitance (RC) decay combined with reflections resulting in ringing from subtle impedance mismatch at the oscilloscope, and was in good agreement with the experimentally determined IRF. Upon performing the analytical fit to the IRF, the exponential decay form the IRF was then incorporated into the nonlinear fit to recover the fluorescence lifetime of both coumarin 6 and fluorescein pure solutions. The recovered lifetimes for coumarin 6 and fluorescein are 2.5 and 3.8 ns, respectively, agreeing well with the previously reported lifetimes [13,14]. For the lifetime images and movie reported in this Letter, the simplified approach was chosen to balance accuracy against the need for fast analysis time given the sheer number of times the fitting is performed to generate the lifetime maps.
Fig. 2.

Nonlinear fit of the experimentally measured IRF to an analytical expression.
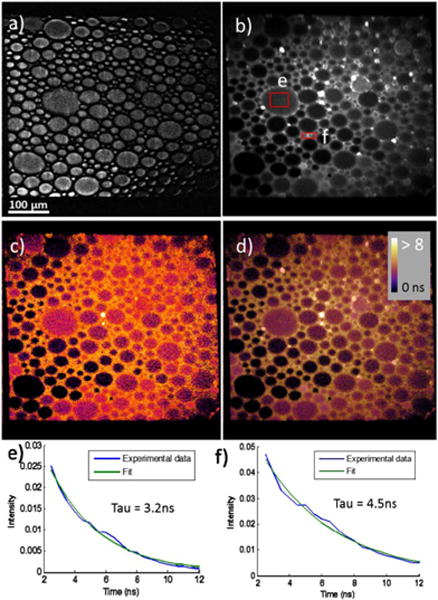
The lifetime map of the mixture is shown in Fig. 3. 150 frames were averaged to generate the lifetime map with all the data acquired in 10 s. The sample system contained three components; (i) coumarin 6 solution (in chloroform) located within the hydrophobic droplets formed by SDS, (ii) aqueous fluorescein in the surrounding solution, and (iii) air bubbles introduced by the mixing process located at the lower left of the image. Figure 3(a) shows the laser-transmittance image of the mixture where air bubbles and coumarin 6 droplets are difficult to discriminate based on bright-field imaging alone. However, the lifetime maps show clear differences between the locations corresponding to fluorescein-rich solution, coumarin-rich droplets, and air bubbles. The average lifetime for coumarin 6 droplets was measured to 3.4 ± 0.6 ns and 4.7 ± 0.9 ns for fluorescein solution. Compared to the measurement of the individual solutions, the mean lifetimes are consistent while the uncertainties are higher. The relatively high uncertainties are attributed to the reduced signal to noise limited by the need of imaging speed as well as the sample variation across the image.
Fig. 3.

Images of dye mixture. (a) Bright-field images, (b) fluorescence-intensity image, (c) fluorescence lifetime map, (d) an overlap of lifetime map over intensity, and (e), (f) representative fit from the indicated areas in (b).
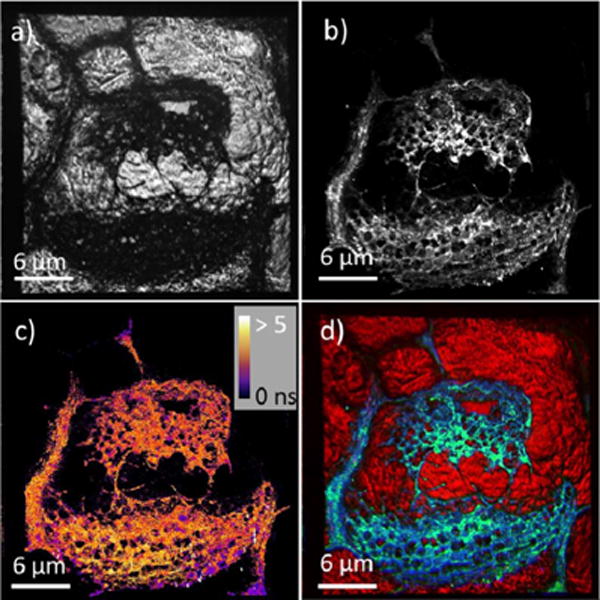
To demonstrate that the imaging system in this Letter may be applicable for more complicated biological sample system, we applied this instrument to measure the autofluorescence present in a mouse tail section. The results are shown in Fig. 4. Due to its relatively low optical transparency, collagen in the mouse tail is much darker compared to the surrounding components in the bright-field image shown in Fig. 4(a). However, fluorescence-based measurement can provide detailed contrast on the features within the collagen-rich structure. Comparing the fluorescence intensity-based image [Fig. 4(b)] and lifetime-based image [Fig. 4(c)], it is readily apparent that the lifetime measurements are largely independent of the absolute brightness. The measured lifetime of collagen is 2.7–3.1 ns, while the previously reported lifetime for collagen was 1.7 ns [15].
Fig. 4.

Fluorescence image of mouse tail section. (a) Bright-field images, (b) fluorescence-intensity image, (c) fluorescence lifetime map, and (d) three-color overlay of bright-field (red), intensity image (green), and lifetime image (blue).
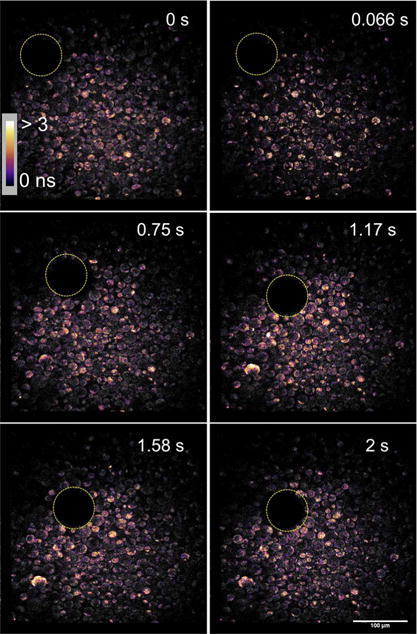
Finally, video-rate TPE-FLIM was acquired and displayed at 15 frames per second (FPS), with representative frames shown in Fig. 5. The full video is available in the Supporting Information. Given the relatively low signal-to-noise ratio in each individual frame, the measured lifetimes are associated with relatively high uncertainties. However, the ability to capture and recover the lifetime map of the sample at video rate provides valuable physiological contrast of the sample movement. From comparisons between the results in Figs. 3 and 4, the accuracy of lifetime measurement can be significantly improved through signal averaging over multiple frames.
Fig. 5.

Six representative frames of a 15 FPS video (Visualization 1) demonstrating the sample translation of an air bubble.
In conclusion, we have shown a novel instrumental approach for video rate TPE-FLIM system based on interleaved digitization. The interleave pattern yielded a fourfold improvement in temporal resolution. The proposed imaging system is straightforward to integrate into beam-scanning microscopes routinely used for TPEF, second-harmonic generation, stimulated Raman scattering, and coherent anti-Stokes Raman scattering, with minor electronics and software modification. The accuracy of the measured lifetime and imaging performance were demonstrated by resolving the lifetime difference between coumarin 6 and fluorescein. The fluorescence lifetime of mouse tail and the representative FLIM video further demonstrated the ability of the system to visualize the inherent contrast based on fluorescence lifetime along with intensity. The ability to perform FLIM measurement at video rate opens up the possibilities of performing 3D FLIM with multi-focal microscopy configuration and high-throughput measurements.
Supplementary Material
Acknowledgments
The authors would like to acknowledge AlazarTech for helpful discussions of the intrinsic bandwidth of the digitizer cards.
Funding. National Institutes of Health (NIH) (R01GM-103401, R01GM-103910).
Footnotes
OCIS codes: (170.2520) Fluorescence microscopy; (170.3650) Lifetime-based sensing.
References
- 1.Sun Y, Day RN, Periasamy A. Nat Protoc. 2011;6:1324. doi: 10.1038/nprot.2011.364. [DOI] [PMC free article] [PubMed] [Google Scholar]
- 2.Rice WL, Kumar AT. Biomedical Optics. Optical Society of America; 2014. paper BM3A.50. [Google Scholar]
- 3.Romero G, Qiu Y, Murray RA, Moya SE. Macromol Biosci. 2013;13:234. doi: 10.1002/mabi.201200235. [DOI] [PubMed] [Google Scholar]
- 4.Chia TH, Levene MJ. Opt Express. 2009;17:22054. doi: 10.1364/OE.17.022054. [DOI] [PubMed] [Google Scholar]
- 5.Chen J, Venugopal V, Intes X. Biomed Opt Express. 2011;2:871. doi: 10.1364/BOE.2.000871. [DOI] [PMC free article] [PubMed] [Google Scholar]
- 6.Berezin MY, Achilefu S. Chem Rev. 2010;110:2641. doi: 10.1021/cr900343z. [DOI] [PMC free article] [PubMed] [Google Scholar]
- 7.Chia TH, Williamson A, Spencer DD, Levene MJ. Opt Express. 2008;16:4237. doi: 10.1364/oe.16.004237. [DOI] [PubMed] [Google Scholar]
- 8.Pelet S, Previte MJR, So PTC. J Biomed Opt. 2006;11:034017. doi: 10.1117/1.2203664. [DOI] [PubMed] [Google Scholar]
- 9.Helmchen F, Denk W. Nat Methods. 2005;2:932. doi: 10.1038/nmeth818. [DOI] [PubMed] [Google Scholar]
- 10.Becker W, Bergmann A, Hink M, König K, Benndorf K, Biskup C. Microsc Res Tech. 2004;63:58. doi: 10.1002/jemt.10421. [DOI] [PubMed] [Google Scholar]
- 11.McCarthy A, Collins RJ, Krichel NJ, Fernández V, Wallace AM, Buller GS. Appl Opt. 2009;48:6241. doi: 10.1364/AO.48.006241. [DOI] [PubMed] [Google Scholar]
- 12.Muir RD, Kissick DJ, Simpson GJ. Opt Express. 2012;20:10406. doi: 10.1364/OE.20.010406. [DOI] [PMC free article] [PubMed] [Google Scholar]
- 13.Raikar U, Renuka C, Nadaf Y, Mulimani B, Karguppikar A, Soudagar M. Spectrochim Acta Part A. 2006;65:673. doi: 10.1016/j.saa.2005.12.028. [DOI] [PubMed] [Google Scholar]
- 14.Hammer M, Schweitzer D, Richter S, Königsdörffer E. Physiol Meas. 2005;26:N9. doi: 10.1088/0967-3334/26/4/N01. [DOI] [PubMed] [Google Scholar]
- 15.Dowling K, Dayel M, Lever M, French P, Hares J, Dymoke-Bradshaw A. Opt Lett. 1998;23:810. doi: 10.1364/ol.23.000810. [DOI] [PubMed] [Google Scholar]
Associated Data
This section collects any data citations, data availability statements, or supplementary materials included in this article.


