

Abstract
Background
To compare the apparent diffusion coefficient (ADC) on diffusion-weighted imaging (DWI) with the standardized uptake values (SUV) measured by18F-FDG-PET/CT in naïve hepatocellular carcinoma (HCC) nodules, and to determine whether these markers are associated with tumours at high-risk of aggressiveness.
Methods
From 2007 to 2010, all patients with HCC on the waiting list for liver transplantation and who underwent both FDG-PET/CT and 1.5-T DWI-MRI (b values: 0, 200, 400, and 800 s/mm2) were included in this institutional review board-approved retrospective study. Tumour size, tumour ADC, tumour-to-liver ADC ratio (ADCT/L), maximal tumour SUV and tumour-to-liver SUV ratio (SUVT/L) were measured and compared to serum alpha-fetoprotein (AFP) levels, tumour size and differentiation grade on explanted specimens.
Results
A total of 37 HCC nodules in 28 patients were available for correlation between MRI and PET/CT, 7 of which (in 7 patients) showed a SUVT/L > 1.15. We did not find any correlation between tumour ADC or ADCT/L and tumour SUV or SUVT/L. To note, SUVT/L was positively correlated with AFP levels (R = 0.95, P ≤ 0.0001), while ADCT/L was not (P = 0.73). Twenty-four patients (with 32 nodules) underwent liver transplantation. In this subgroup, an increased SUVT/L ratio was associated with larger tumours (average size, 32 ± 14 mm; range, 18–60 mm; P < 0.0001) and with poor differentiation on pathology (grades 3 and 4; P = 0.04), while ADCT/L was neither associated with tumour size or differentiation grade.
Conclusions
ADC and SUV measures in HCC nodules are not correlated. SUVT/L ratio correlates with AFP levels, tumour size and poor differentiation, and should probably be integrated as a co-variable in a predictive outcome model of patients on the waiting-list for liver transplantation.
Keywords: Hepatocellular carcinoma, Positron emission tomography, Diffusion-weighed imaging
Background
While the prognosis of hepatocellular carcinoma (HCC) without treatment is sombre, with 5-year life expectancy below 7 %, optimal outcome is obtained in patients with low tumour burden, eligible for liver transplantation (LT) [1], especially within the Milan criteria [2]. Several studies have reported that patients transplanted beyond the Milan criteria can achieve long-term recurrence-free survival: pathological features of HCC tumours appear to play an important role as prognostic markers of disease-free survival; increased alpha-fetoprotein (AFP) levels, micro vascular invasion (MVI), differentiation grade, and satellite nodules all appear to be associated with impaired outcome following LT [3–9]. As a result, the sole assessment of the number and size of HCC lesions in LT candidates is unable to precisely address the risk of cancer recurrence after LT. As some pathological prognostic markers such as MVI cannot be assessed on biopsy specimens, growing interest has raised for the evaluation of HCC using functional imaging as an adjunct to biology and conventional imaging for optimal tumour grading.
Several studies have reported that pre-LT PET/CT with [18F] 2- deoxy-2-fluoro-D-glucose (FDG) may play a role in predicting tumour recurrence [10–15] in high-grade HCC tumours, which have a reduced glucose-6-phosphatase activity, resulting in progressive accumulation of the tracer within tumour cells as compared to adjacent liver. Hence, FDG standardized uptake value (SUV) in HCC, as compared to adjacent normal liver (tumour-to-liver ratio), reflects tumour aggressiveness, including histological tumour grade and AFP levels, which in turn correlate with outcome. For Lee et al., a longer disease-free survival was observed after LT in patients with a tumour-to-liver ratio < 1.15, i.e., with less than 15 % higher FDG uptake above normal liver background [16]. These data were later confirmed by Kornberg et al., demonstrating the pejorative predictive value of FDG-positive HCC [17].
Diffusion-weighted imaging (DWI) provides information on the random Brownian motion of water molecules within tissues, which reflects their cellularity. Some authors have reported that high-grade HCC tended to show decreased apparent diffusion coefficient (ADC) values, as compared to well-differentiated tumours [18], although this remains to-date debated [19]. Hence, both SUV and ADC could be considered as biomarkers of HCC tumours at risk of recurrence following LT, and could thereafter be tested as diagnostic and prognostic tools for HCC management. To the best of our knowledge, however, there have been no reports correlating both markers in HCC. The aim of our study was to measure and compare the ADC values on DWI with SUVs measured by FDG-PET/CT in naïve HCC patients on waiting-list for LT, and to determine whether these markers can be associated with tumours at high risk of aggressiveness using the pathology of explanted specimens as the reference standard.
Methods
Patients
The local patient database was searched retrospectively to identify all consecutive patients with HCC referred to our institution for LT between 2007 and 2010, who underwent both liver MRI and FDG-PET/CT prior to LT as part of their work-up. During this period, 78 patients met the inclusion criteria. We excluded patients in whom DWI sequences were not performed (n = 15), patients bearing liver lesions all < 10 mm on MRI (n = 13) and patients who underwent percutaneous tumour ablation or chemoembolization prior to either PET/CT or liver MRI (n = 22). As a result, 28 patients were eligible, including 23 men and 5 women, with a median age of 59 years (range, 46 to 69 years); 9 patients were Child-Pugh A, 15 Child-Pugh B, and 4 Child-Pugh C; the underlying liver disease in the study population is shown in Table 1. Based on pre-LT imaging data, 67.8 % (19/28) patients fulfilled the Milan criteria (2), and 82.1 % (23/28) fulfilled the UCSF criteria [20]. All were included in clinical trials, which were active at this time, and signed informed written consent, in accordance with our Institutional Review Board (Comité de Protection de Personnes, Ile-de-France IX).
Table 1.
Patient population features
| Patients (n) | 28 |
|---|---|
| Age (years) [Mean (±SD)] | 59 ± 6 |
| Sex ratio (Male/Female) | 23/5 |
| Underlying liver disease (n): | |
| Alcohol | 10 |
| Hepatitis B | 5 |
| Hepatitis C | 4 |
| NASH | 2 |
| NASH + alcohol | 2 |
| Hepatitis C + alcohol | 2 |
| Hepatitis C + alcohol + hemochromatosis | 1 |
| Hemochromatosis + hepatitis C | 1 |
| NASH + hemochromatosis | 1 |
NASH Non Alcoholic Steato-Hepatitis
Fifteen patients underwent neo-adjuvant treatments before LT, all of which were performed after both the liver MRI and PET/CT: 13 patients underwent lipiodol-doxorubicin based chemoembolization, either alone (n = 8) or combined with radiofrequency ablation (n = 3) and surgery (n = 2); 2 patients underwent radiofrequency ablation prior to LT. MRI and PET/CT comparisons were performed on treatment-naive HCC patients.
Magnetic resonance imaging
All MRI images were acquired on a 1.5-T MR imaging system (Avanto®, Siemens Healthcare, Erlangen, Germany) with Super Quantum gradients (maximum gradient amplitude 40 mT/m, maximal gradient slope 200 mT/m), and an 18-channel total imaging matrix system. The liver MRI protocol included transverse gradient recalled echo (GRE) in and out-of-phase T1 sequences (TR/TE/α: 119 ms/2.4–4.8 ms/70°; slice thickness 5 mm), and breath-hold fat suppressed transverse turbo spin echo (TSE) T2 sequences (TR/TE/α: 2400 ms/82 ms/150°; slice thickness 5 mm; echo train length = 23). The DWI sequence was based on standard single-shot diffusion-weighted spin echo planar imaging with 4 b-values (0, 200, 400 and 800 s/mm2), and was acquired prior to Gd-chelates injection. The DWI sequence was acquired with respiratory gating (Prospective Acquisition Correction [PACE] system, average TR = 1500 ms, TE = 78 ms; slice thickness 5 mm; matrix 148x112; FOV 300x250 mm; Nex = 3; BW = 1342 Hz/pixel; generalized autocalibrating partially parallel acquisition factor 2). A dynamic breath-hold 3D volumetric interpolated breath-hold examination (VIBE) T1WI (TR/TE/α: 3.17 ms/1.33 ms/20°; slice thickness 3 mm; mean acquisition time of 19 ± 3 s) was repeated before and 4 times after injection of a total of 0.2 mL/kg gadoteric acid (Dotarem®, Guerbet, Aulnay, France). Each 3D VIBE was acquired at a 20 s interval.
All MR images were analyzed by 2 observers (SB, ALu), blinded to PET/CT results. For each patient, the number of lesions fulfilling the European Association for the Study of Liver Disease and American Association for the Study of Liver Disease (EASL-AASLD) [21] diagnostic criteria on MRI was determined, thereafter defining whether each patient fulfilled the Milan and UCSF criteria [2, 20]. Analyses were performed on a commercially available Siemens Workstation (Syngo MMWP, Siemens Healthcare, Forchheim, Germany). In addition, for each HCC nodule, the following parameters were measured: size, location according to Couinaud liver segmentation, T1 signal intensity (SI) relative to muscle, T2SI relative to spleen. ADC maps were obtained using a mono-exponential fit of the signal decrease on the 4 b values on a voxel-by-voxel basis. A region of interest (ROI) encompassing the entire lesion was placed on the b0 image, and then, propagated to the ADC map to provide the mean tumour ADC (ADCT). The ADC of the normal liver parenchyma (ADCL) was also measured on the right posterior segment of the liver, using a 20 mm ROI positioned away from tumours, vessels, and bile ducts. The tumour-to-liver ratio (ADCT/L) was computed for each HCC lesion.
PET/CT imaging
The median delay between PET/CT and MRI was 3 days (range, −181 to 245 days). All images were acquired using an integrated PET/CT scanner (Gemini GXL16, Philips, Da Best, The Netherlands). After fasting for at least 6 h, patients were injected with an average 5.2 MBq/kg FDG, and images were acquired 1 h later. A low-dose CT scan was obtained for attenuation correction and localization purposes (100 kV, 80 mAs), followed by an emission scan from the top of the skull to mid-thigh with 9–11 bed shifts of 2 min each. Images were reconstructed using a line-of-response row action maximum likelihood algorithm (LOR-RAMLA) with matrix size of 144x144, and corrections for attenuation, scatter and random coincidences. CT was obtained without contrast enhancement.
PET, CT, and fused PET/CT images were analyzed on a proprietary workstation (Syntegra, Philips, Milpitas, CA). SUV was defined as tissue concentration of FDG (kBq/mL) divided by the injected activity per weight (MBq/kg). All images were analyzed by 2 observers (EI, EE) blinded to MRI analysis. For each FDG-avid HCC nodule, the following parameters were collected: location of the tumour according to Couinaud liver segmentation, maximum SUV of the tumour (SUVT) and maximum SUV of the normal liver parenchyma (SUVL). ROIs were drawn on 5 contiguous slices around each focus of tumour uptake in order to capture the maximum SUV; in the normal liver parenchyma, ROIs were drawn at mid height, making sure that VOI outlines were restricted to areas of physiologic uptake and avoiding neighbouring sites of disease. The tumour-to-liver ratio (SUVT/L) was calculated for each lesion; when no clear focus of uptake was identified, SUVT was considered equal to SUVL, and SUVT/L was set at 1.
Liver transplantation
Of the 28 patients, 24 were transplanted during the study period, while 2 patients showed tumour progression and were dropped from the waiting list, 1 patient was excluded of LT owing to aortic stenosis and 1 patient declined LT after registration. The median delay between MRI and LT was 117 days (range 1 to 446 days). The median delay between PET/CT and LT was 104 days (range, 23 to 394 days). In all cases, a bilateral subcostal incision with an upper midline extension was performed. LT was performed using preservation of the inferior vein cava (IVC) and temporary porto-caval anastomosis except when IVC resection was necessary. Reconstruction was performed in the piggyback fashion with end-to-side cava-caval anastomosis on the joined stump of the three main hepatic veins. Portal, arterial and biliary reconstructions were performed using standard techniques.
Pathology examination – Correlation with imaging findings
Explanted liver specimens were cross-sectioned and analyzed by a pathologist (JCa) blinded from imaging results. After formalin fixation, each liver slice was further pared to less than 5 mm thickness. All liver nodules, whether benign or consistent with HCC lesions, were macroscopically located according to Couinaud classification. The largest macroscopic diameter of each HCC lesion was recorded. For all HCC, at least a complete slice of the tumour including both the centre and the periphery was sampled for microscopic analysis. After hematoxylin-eosin-saffran staining, each nodule was analyzed for the presence of tumour cells. Microscopic evaluation of all tumours included the assessment of the following: tumour differentiation according to Edmondson-Steiner classification, presence of a capsule, quantification of necrosis, presence of MVI, and presence of satellite nodules. Patients with aggressive HCC were defined as presenting either an undifferentiated HCC (Edmondson-Steiner grades 3 and 4), and/or a micro vascular invasion, or beyond Milan criteria on the explanted specimen. Then, radiologists, nuclear medicine physicians and pathologist ensured adequate correlation between imaging and pathological data in a consensus meeting. Co-localization of tumours on pathology and imaging was not only based on segmental classification but also on the identification of specific landmarks such as hepatic veins, portal branches and central or peripheral location. Only HCC nodules retrieved simultaneously on pathology and on MRI were considered for statistical analyses.
Statistics
The correlation between DWI-MRI and PET/CT variables (ADCT, ADCL, ADCT/L, T1SI relative to muscle, T2SI relative to spleen, SUVT, SUVL, SUVT/L) was analyzed using Pearson’s correlation coefficients based on pair wise complete data (37 nodules in 28 patients). In addition, because of possible erroneous ADC measures within the left lobe, induced by cardiac motion, this correlation analysis was repeated only for right lobe lesions. The association between imaging features and pathological outcomes (32 nodules in 24 LT patients) were analyzed using the following methods: 1) dichotomous outcomes (within/beyond Milan criteria, absence/presence of MVI, differentiated/undifferentiated HCC) vs. dichotomous FDG uptake (PET/CT was considered positive if the ratio SUVT/L was > 1.15 [16]) were analyzed based on categorical analyses using Fisher exact test; 2) dichotomous outcomes vs. continuous imaging features (DWI-MRI and PET/CT variables) were analyzed based on univariate logistic regression; 3) continuous outcomes (differentiation status) vs. all imaging features were analyzed based on univariate linear regression. A P-value < 0.05 was considered statistically significant. All analyses were conducted using R statistics software package.
Results
DWI-MRI analysis
All 37 HCC nodules were > 10 mm on MRI with a mean tumour size of 24 ± 10 mm (range, 11 to 60 mm), and the mean ROI size for ADC measurements was 5 ± 19 voxels. The mean ADCT value of these lesions was 1.39 × 10⁻³ ± 0.35 × 10⁻³ mm2/s (range, 0.41 to 1.89 × 10⁻³ mm2/s). The mean ADCL value was 1.36 × 10⁻³ ± 0.37 × 10⁻³ mm2/s (range, 0.25 to 2.33 × 10⁻³ mm2/s). The mean ADCT/L ratio was 1.13 ± 0.63 (range, 0.32 to 4.44).
PET/CT analysis
The mean SUVT of the 37 HCC lesions retrieved on MRI was 2.9 ± 0.7 (range, 2.3 to 6.3). The mean SUVL was 2.7 ± 0.3 (range, 2.3 to 3.6). The mean SUVT/L was 1.08 ± 0.28 (range, 1.00 to 2.63). Overall, using the SUVT/L cut-off value of 1.15, PET/CT was considered positive in 7 HCC in 7 patients: the mean SUVT was 3.8 ± 1.2 in these nodules, accounting for a mean SUVT/L ratio of 1.44 ± 0.53 (range, 1.19 to 2.63, Fig. 1).
Fig. 1.
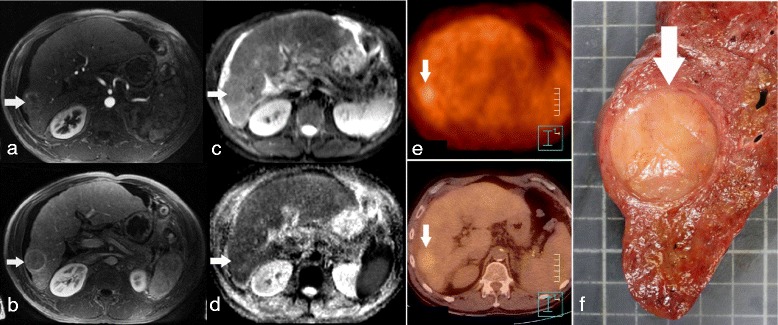
Poorly differentiated HCC in a patient with alcoholic cirrhosis, showing restricted ADC on DWI-MRI and increased uptake on the FDG-PET/CT. Transverse dynamic contrast-enhanced initial post contrast MR image shows a 30 mm large nodular enhancing lesion in the right liver on 3D GE arterial phase imaging (a, arrow) with wash-out on portal-venous phase (b, arrow). The lesion is mildly hyper intense on transverse DW image (b = 800 s/mm2; c, arrow) and has a low ADC (1.06 × 10⁻³ mm2/s) on the ADC map (d, arrow). FDG-PET/CT shows an increased tumour uptake with a SUVT = 4.1 and SUVT/L = 1.24 (e, arrow). The explanted liver showed an Edmondson-Steiner grade 4 HCC (f, arrow)
Correlation between DWI-MRI and PET/CT
ADCT was not correlated with either SUVT, SUVL, or SUVT/L ratio (Table 2, Figs. 2 and 3). ADCL did not correlate either with SUVL, SUVT, or SUVT/L ratio. ADCT/L ratio did not correlate with either SUVT/L ratio, SUVT, or SUVL. Because ADC measurements may be less reliable in the left lobe of the liver due to cardiac motion, we considered in a second analysis only lesions located within the right lobe (n = 28): ADCT was not correlated with either SUVT (R = 0.25, P = 0.3) or SUVT/L ratio (R = 0.29, P = 0.21). ADCL did not correlate either with SUVT (R = 0.24, P = 0.4) or SUVT/L ratio (R = 0.15, P = 0.57). ADCT/L ratio did not correlate with either SUVT (R = −0.18, P = 0.46) or SUVT/L ratio (R = −0.12, P = 0.6).
Table 2.
Correlations between ADC and SUV values. Pearson’s correlation coefficients (R) and P-values (P) do not show any correlation between pair wise parameters
| SUVL | SUVT | SUVT/L | ||||
|---|---|---|---|---|---|---|
| R | P | R | P | R | P | |
| ADCL | 0. 17 | 0.36 | 0.14 | 0.44 | 0.04 | 0.81 |
| ADCT | 0.03 | 0.87 | −0.01 | 0.98 | −0.09 | 0.58 |
| ADCT/L | −0.09 | 0.61 | −0.12 | 0.5 | −0.1 | 0.58 |
Fig. 2.
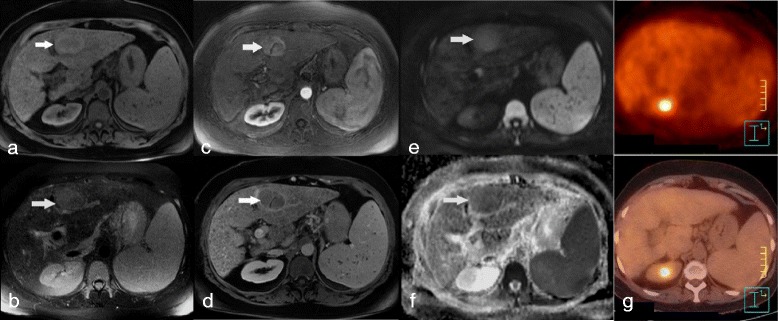
Moderately differentiated (grade 2) HCC in a patient with hepatitis B-induced cirrhosis, showing restricted ADC on DWI-MRI and no significant uptake on FDG-PET/CT. MR imaging showed a left lobe HCC with high T1 (a, arrow), high T2 (b, arrow) signal intensity, with arterial enhancement (c, arrow) followed by washout (d, arrow). The HCC showed high signal intensity on DWI image (b = 800 s/mm2; e, arrow) consistent with low ADC (1.26 × 10⁻³ mm2/s) on the ADC map (f, arrow). The lesion showed no significant FDG uptake on FDG-PET/CT (g)
Fig. 3.
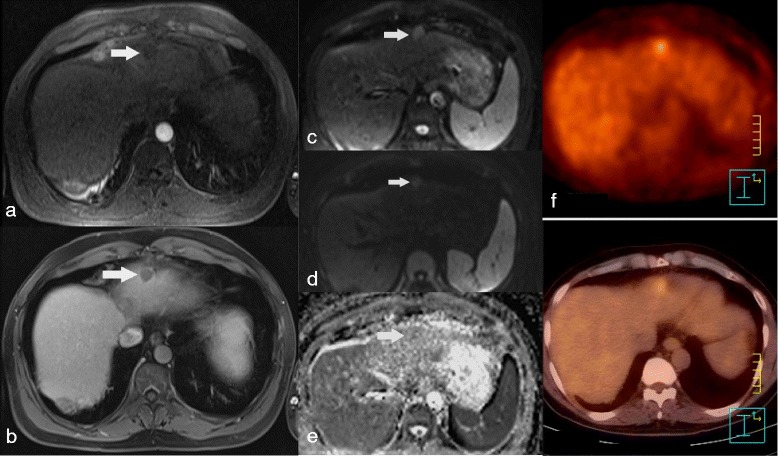
Poorly differentiated HCC in a patient with left lobe HCC, showing no restricted ADC on DWI-MRI and increased uptake on FDG-PET/CT. Dynamic 3D gradient echo T1 WI shows a non enhancing nodule on arterial phase (a, arrow), remaining hypo intense on portal phase (b, arrow) but associated to a thin peripheral enhanced rim. The nodule shows high signal intensity on DWI image with b = 0 s/mm2 (c, arrow) decreasing on DWI b = 800 s/mm2 images (d, arrow), although its signal intensity remained higher than the liver. The tumour ADC was 1.38 × 10⁻³ mm2/s (e, arrow), similar to that of the adjacent liver. The lesion proved positive on FDG-PET/CT (f)
Pathology
Gross examination revealed 32 HCC nodules in the 24 LT patients, accounting for a mean number of 1.3 lesions per patient (17 patients had 1 nodule, 6 had 2 nodules, and 1 had 3 nodules). The mean size of these HCC nodules was 21 ± 11 mm (range, 4 to 47 mm). Overall, 11 patients (46 %) met the Milan criteria based on the pathological analysis of the explanted specimens. Eight patients (33 %) showed at least one HCC lesion with MVI. The Edmondson-Steiner histological grade for LT was as follows: 2 lesions were grade 1, 7 lesions were grade 2, 17 lesions were grade 3, and 2 lesions were grade 4; four lesions could not be graded because of significant tumour necrosis.
Correlation between imaging variables and criteria of aggressiveness
In the 28 patients on the waiting list, the median AFP level for all Child Pugh stages was 4.7 ng/mL (range, 0.7 to 13,469.0 ng/mL). The median AFP levels did not differ between Child-Pugh stages A, B and C: 5.0 ng/mL (range, 0.7 to 283.0 ng/mL), 4.6 ng/ml (range, 2.0 to 13,469.0 ng/mL), and 13.0 ng/mL (range, 2.2 to 33.0 ng/mL), respectively (P = NS). SUVT/L ratio significantly correlated with the AFP level (R = 0.95, P < 0.0001) whereas no apparent correlation was detected between AFP and ADCT or ADCT/L ratio (P = 0.08 and P = 0.73, respectively). The mean AFP level was significantly higher in patients with SUVT/L ratio > 1.15 than in PET/CT-negative patients (1951.9 ± 5078.9 ng/mL vs. 26.3 ± 64.0 ng/mL, respectively; P < 0.0001). In the 24 transplanted patients, the mean HCC tumour size was also significantly larger in patients with SUVT/L ratio > 1.15 than in PET/CT-negative patients (32 ± 14 mm vs. 23 ± 7 mm; P < 0.0001). Tumour size did not correlate with ADCT values (P = 0.25). In addition, positive PET/CT with SUVT/L ratio > 1.15 was associated with poor differentiation on pathology (P = 0.04), but not with MVI or Milan criteria (P = NS). None of the MRI variables - including ADCT, ADCT/L, T1SI relative to muscle, and T2SI relative to spleen - correlated with pathological outcomes, including differentiation grade, MVI and Milan criteria.
Discussion
DWI-MRI and FDG-PET/CT provide distinct functional and morphological information. To date, MRI or enhanced CT are essential for HCC lesion detection and characterization according to practice recommendations, while FDG-PET/CT is not. This study sought to evaluate the correlation between metabolic and DWI parameters, and to compare these parameters with established biomarkers of tumour aggressiveness and prognostic assessment. Increased FDG uptake within HCC nodules was associated with larger and less differentiated tumours, whereas ADC values observed in this study population appear not to correlate with AFP, differentiation on pathology and Milan criteria.
Duvoux et al. have suggested that AFP levels could predict tumour recurrence and correlated with vascular invasion and differentiation with a significant increase in 5-year risk of recurrence (50.6 %). Among patients within the Milan criteria, a subgroup of patients with AFP levels > 1000 ng/mL showed at high risk of recurrence [9]. Our study confirms that PET/CT findings correlate with AFP levels. PET/CT was considered positive if the SUVT/L ratio was > 1.15, which occurred in 7 patients on the waiting list (25 %), of whom 2 demonstrated tumour progression and did not undergo LT. Higher-grade and less-differentiated tumours (according to Edmondson-Steiner classification) were associated with higher levels of FDG accumulation. Decreased levels of glucose-6-phosphatase observed in poorly differentiated HCC lead to increased FDG accumulation [10, 22]. Our results confirm the performance of FDG-PET/CT in predicting tumour aggressiveness using the explanted specimen as the reference standard. In addition, PET/CT performed once as a screening tool even as far as a median 104 days prior to LT still correlates with pathological features of HCC.
The ADC value, measured by DWI, usually reflects tumour cellularity as well as interstitial tissue assessment. The mean ADCT values observed in this study are comparable to those reported in the literature [18, 23]. Similarly, ADCT/L ratios observed in this study are not high, reflecting the low contrast between the tumour lesions and adjacent liver on ADC maps [24–26]. This could be partly explained by the restricted diffusion observed in liver fibrosis [27]. There have been conflicting reports regarding the link between ADC values and HCC differentiation: for some, although differences are not significant in terms of parametric ADC values, a higher signal intensity of HCC lesions in DWI is usually associated with higher pathological grades [18, 19]. However, the reasons accounting for an increase in mean ADC values vary: tumour necrosis is responsible for reduced cellularity and increased ADC [28]; on the opposite, increased necrosis is also observed in highly aggressive HCC lesions with active portions of the tumour mostly located at the periphery of the lesions [29]. Last, tumour vascularization impacts ADC measurements, especially when low b-values are included, such as in this study where 4 b-values were used, including b = 0 s/mm2. As multiple b-value acquisitions were not studied, the specific influence of the perfusion component of diffusion in predicting tumour aggressiveness could not be tested here. In addition, the ADC measurements encompassed the entire HCC lesions, reflecting all components of the tumour observed on a single slice rather than on the entire tumour volume, which could also have limited the performances of ADC measurements. FDG uptake on the other hand correlates with the metabolic activity of viable tumour cells. Although necrosis decreases the overall tumour uptake, the SUV is measured from the area of highest uptake within the lesion set; the SUV only considers the most aggressive tumour components. Comparing mean ADC to maximum SUV does not reflect a true comparison of the most active component of each lesion. Moreover, a majority of HCC lesions observed in our study showed similar SUV values as compared to the adjacent liver, thus reducing the dispersion of SUV values as compared to ADC measurements. The use of novel tracers such as 18F-fluoromethylcholine (FCH) could allow a better distribution of uptake values in HCC lesions even in well-differentiated HCC lesions.
In contrast with previous publications, this study focused on patients on waiting list for LT, using pathology of explanted specimens as the reference standard in a large majority of them. Moreover, there have been conflicting reports on the correlation between DWI and PET/CT in HCC, as tissue cellularity and glucose metabolism may represent 2 different facets of tumour biology [30]: some studies have suggested a positive correlation between tumour SUVs and ADC values [31–37]. Other authors have reported an inverse relationship between these parameters, especially when discriminating malignant from benign lesion, or when predicting the aggressiveness of some tumours [31, 33–39]. Hypercellular areas could increase impedance to water diffusion, resulting in low ADC values and high FDG uptake, while lower cellularity areas could show increased ADC with decreased FDG uptake. These relationships were reported mainly in extra-digestive tumours possibly because the influence of motion on ADC measurements is more limited in this setting. This further suggests the need to test DWI-MRI together with multitracer PET (FDG and/or FCH) in dedicated PET/MR platforms allowing simultaneous acquisitions and limited influence of motion on parametric imaging analysis [40].
Several limitations of the presented study have to be mentioned. First, the patient population was small in this monocentric retrospective study. There is currently no national recommendation for systematic FDG-PET/CT in routine before LT. Second, only patients on LT waiting list were considered eligible, which prevented inclusion of more aggressive and larger tumours. The study design further excluded patients who were treated with chemoembolization, radiofrequency, and chemotherapy before DWI-MRI because these treatments alter ADC measures [41, 42]. Interestingly, 15 patients were treated between MRI and LT, which could possibly have impacted the correlation between imaging and pathology [41, 42]. However, this did not affect the SUV and ADC correlation as all correlations were made on imaging examinations performed prior to any treatment. There was no image fusion between PET/CT and DWI-MRI; however, to our knowledge and to-date, no software enables the correct simultaneous fusion between b-maps, ADC maps and PET/CT images.
PET/CT was obtained without contrast. However this did not impact the co-registration of MRI images: all MRI lesions were detected on both FDG-PET/CT and on pathology. Additionally, it is important to note that only patients meeting the EASL-AASLD criteria were included, limiting the analysis to lesions larger than 10 mm with early enhancement on arterial phase. However, the aim of this study was not to assess the performance of each modality for the detection of HCC in patients on waiting list for LT, for which MRI plays a key role, but to study the possible predictive nature of FDG-PET/CT or DWI sequences on tumour aggressiveness. The median delay between FDG-PET/CT and MRI-DWI was 3 days with a maximum of 245 days. FDG-PET/CT and DWI-MRI datasets were evaluated separately without knowledge of the findings of the other imaging modality and without knowledge of histopathology findings.
Conclusions
Although mean ADC and FDG-PET/CT maximum SUV of HCC in patients on waiting list for LT are not correlated, both tumour size, poor differentiation and AFP levels correlate with SUVT/L, suggesting that FDG-PET/CT can predict tumour aggressiveness and should probably be integrated as a covariable in a predictive outcome model of patients with HCC candidate to LT, while MRI must be used for lesion detection and characterization.
Footnotes
Competing interests
The authors declare that they have no competing interests.
Authors’ contributions
Conception and design (EI, TD, CD, ALu), acquisition of data (EI, TD, EE, JCa, ALa, ALu), data analysis and interpretation (SB, EI, SJL, EE, JCa, CC, ALu), manuscript drafting or revising for important intellectual content (all authors), final approval of the version to be published (all authors), agree to be accountable for all aspects of the work (SB, EI, JCa, CD, ALu).
Contributor Information
Samia Boussouar, Email: samiaboussouar@gmail.com.
Emmanuel Itti, Phone: +33 1 49 81 27 80, Email: emmanuel.itti@aphp.fr.
Shih-Jui Lin, Email: shihjui@gmail.com.
Thomas Decaens, Email: tdecaens@chu-grenoble.fr.
Eva Evangelista, Email: eva.evangelista@aphp.fr.
Melanie Chiaradia, Email: melanie.chiaradia@aphp.fr.
Julia Chalaye, Email: julia.chalaye@aphp.fr.
Laurence Baranes, Email: laurence.baranes@aphp.fr.
Julien Calderaro, Email: julien.calderaro@aphp.fr.
Alexis Laurent, Email: alexis.laurent@aphp.fr.
Frederic Pigneur, Email: frederic.pigneur@aphp.fr.
Christophe Duvoux, Email: christophe.duvoux@aphp.fr.
Daniel Azoulay, Email: daniel.azoulay@aphp.fr.
Charlotte Costentin, Email: charlotte.costentin@aphp.fr.
Alain Rahmouni, Email: alain.rahmouni@aphp.fr.
Alain Luciani, Email: alain.luciani@aphp.fr.
References
- 1.Allen J, Venook A. Hepatocellular carcinoma: epidemic and treatment. Curr Oncol Rep. 2004;6:177–83. doi: 10.1007/s11912-004-0047-9. [DOI] [PubMed] [Google Scholar]
- 2.Mazzaferro V, Regalia E, Doci R, Andreola S, Pulvirenti A, Bozzetti F, et al. Liver transplantation for the treatment of small hepatocellular carcinomas in patients with cirrhosis. New Engl J Med. 1996;334:693–9. doi: 10.1056/NEJM199603143341104. [DOI] [PubMed] [Google Scholar]
- 3.Klintmalm GB. Liver transplantation for hepatocellular carcinoma: a registry report of the impact of tumor characteristics on outcome. Ann Surg. 1998;228:479–90. doi: 10.1097/00000658-199810000-00005. [DOI] [PMC free article] [PubMed] [Google Scholar]
- 4.Jonas S, Bechstein WO, Steinmüller T, Herrmann M, Radke C, Berg T, et al. Vascular invasion and histopathologic grading determine outcome after liver transplantation for hepatocellular carcinoma in cirrhosis. Hepatology. 2001;33:1080–6. doi: 10.1053/jhep.2001.23561. [DOI] [PubMed] [Google Scholar]
- 5.Molmenti EP, Klintmalm GB. Liver transplantation in association with hepatocellular carcinoma: an update of the International Tumor Registry. Liver Transplant. 2002;8:736–48. doi: 10.1053/jlts.2002.34879. [DOI] [PubMed] [Google Scholar]
- 6.Marsh JW, Finkelstein SD, Demetris AJ, Swalsky PA, Sasatomi E, Bandos A, et al. Genotyping of hepatocellular carcinoma in liver transplant recipients adds predictive power for determining recurrence-free survival. Liver Transplant. 2003;9:664–71. doi: 10.1053/jlts.2003.50144. [DOI] [PubMed] [Google Scholar]
- 7.Han K, Tzimas GN, Barkun JS, Metrakos P, Tchervenkov JL, Hilzenrat N, et al. Preoperative alpha-fetoprotein slope is predictive of hepatocellular carcinoma recurrence after liver transplantation. Can J Gastroenterol Hepatol. 2007;21:39–45. doi: 10.1155/2007/206383. [DOI] [PMC free article] [PubMed] [Google Scholar]
- 8.Kim H, Park M-S, Choi JY, Park YN, Kim M-J, Kim KS, et al. Can microvessel invasion of hepatocellular carcinoma be predicted by pre-operative MRI? Eur Radiol. 2009;19:1744–51. doi: 10.1007/s00330-009-1331-8. [DOI] [PubMed] [Google Scholar]
- 9.Duvoux C, Roudot-Thoraval F, Decaens T, Pessione F, Badran H, Piardi T, et al. Liver transplantation for hepatocellular carcinoma: a model including α-fetoprotein improves the performance of Milan criteria. Gastroenterology. 2012;143:986–94. doi: 10.1053/j.gastro.2012.05.052. [DOI] [PubMed] [Google Scholar]
- 10.Torizuka T, Tamaki N, Inokuma T, Magata Y, Sasayama S, Yonekura Y, et al. In vivo assessment of glucose metabolism in hepatocellular carcinoma with FDG-PET. J Nucl Med. 1995;36:1811–7. [PubMed] [Google Scholar]
- 11.Lam MGEH, Kwee TC, Basu S, Alavi A. Underestimated role of 18F-FDG PET for HCC evaluation and promise of 18F-FDG PET/MR imaging in this setting. J Nucl Med. 2013;54:1510–1. doi: 10.2967/jnumed.113.123273. [DOI] [PubMed] [Google Scholar]
- 12.Cheung TT, Ho CL, Chen S, Chan SC, Poon RTP, Fan ST, et al. Reply: Underestimated role of 18F-FDG PET for HCC evaluation and promise of 18F-FDG PET/MR imaging in this setting. J Nucl Med. 2013;54:1511–2. doi: 10.2967/jnumed.113.126185. [DOI] [PubMed] [Google Scholar]
- 13.Pant V, Sen IB, Soin AS. Role of 18F-FDG PET CT as an independent prognostic indicator in patients with hepatocellular carcinoma. Nucl Med Commun. 2013;34:749–57. doi: 10.1097/MNM.0b013e3283622eef. [DOI] [PubMed] [Google Scholar]
- 14.Song J-Y, Lee YN, Kim YS, Kim SG, Jin SJ, Park JM, et al. Predictability of preoperative 18F-FDG PET for histopathological differentiation and early recurrence of primary malignant intrahepatic tumors. Nucl Med Commun. 2015;36:319–27. doi: 10.1097/MNM.0000000000000254. [DOI] [PubMed] [Google Scholar]
- 15.Wang S-B, Wu H-B, Wang Q-S, Zhou W-L, Tian Y, Li H-S, et al. Combined early dynamic (18)F-FDG PET/CT and conventional whole-body (18)F-FDG PET/CT provide one-stop imaging for detecting hepatocellular carcinoma. Clin Res Hepatol Gastroenterol. 2015;39:324–30. doi: 10.1016/j.clinre.2014.10.010. [DOI] [PubMed] [Google Scholar]
- 16.Lee JW, Paeng JC, Kang KW, Kwon HW, Suh K-S, Chung J-K, et al. Prediction of tumor recurrence by 18F-FDG PET in liver transplantation for hepatocellular carcinoma. J Nucl Med. 2009;50:682–7. doi: 10.2967/jnumed.108.060574. [DOI] [PubMed] [Google Scholar]
- 17.Kornberg A, Küpper B, Tannapfel A, Büchler P, Krause B, Witt U, et al. Patients with non-[18F] fludeoxyglucose-avid advanced hepatocellular carcinoma on clinical staging may achieve long-term recurrence-free survival after liver transplantation. Liver Transplant. 2012;18:53–61. doi: 10.1002/lt.22416. [DOI] [PubMed] [Google Scholar]
- 18.Nasu K, Kuroki Y, Tsukamoto T, Nakajima H, Mori K, Minami M. Diffusion-weighted imaging of surgically resected hepatocellular carcinoma: imaging characteristics and relationship among signal intensity, apparent diffusion coefficient, and histopathologic grade. Am J Roentgenol. 2009;193:438–44. doi: 10.2214/AJR.08.1424. [DOI] [PubMed] [Google Scholar]
- 19.Heo SH, Jeong YY, Shin SS, Kim JW, Lim HS, Lee JH, et al. Apparent diffusion coefficient value of diffusion-weighted imaging for hepatocellular carcinoma: correlation with the histologic differentiation and the expression of vascular endothelial growth factor. Korean J Radiol. 2010;11:295–303. doi: 10.3348/kjr.2010.11.3.295. [DOI] [PMC free article] [PubMed] [Google Scholar]
- 20.Mazzaferro V, Llovet JM, Miceli R, Bhoori S, Schiavo M, Mariani L, et al. Predicting survival after liver transplantation in patients with hepatocellular carcinoma beyond the Milan criteria: a retrospective, exploratory analysis. Lancet Oncol. 2009;10:35–43. doi: 10.1016/S1470-2045(08)70284-5. [DOI] [PubMed] [Google Scholar]
- 21.Bruix J, Sherman M, Diseases AAftSoL Management of hepatocellular carcinoma: an update. Hepatology. 2011;53:1020–2. doi: 10.1002/hep.24199. [DOI] [PMC free article] [PubMed] [Google Scholar]
- 22.Khan MA, Combs CS, Brunt EM, Lowe VJ, Wolverson MK, Solomon H, et al. Positron emission tomography scanning in the evaluation of hepatocellular carcinoma. J Hepatol. 2000;32:792–7. doi: 10.1016/S0168-8278(00)80248-2. [DOI] [PubMed] [Google Scholar]
- 23.Vivarelli M, Cucchetti A, Piscaglia F, La Barba G, Bolondi L, Cavallari A, et al. Analysis of risk factors for tumor recurrence after liver transplantation for hepatocellular carcinoma: key role of immunosuppression. Liver Transplant. 2005;11:497–503. doi: 10.1002/lt.20391. [DOI] [PubMed] [Google Scholar]
- 24.Le Bihan D, Breton E, Lallemand D, Aubin ML, Vignaud J, Laval-Jeantet M. Separation of diffusion and perfusion in intravoxel incoherent motion MR imaging. Radiology. 1988;168:497–505. doi: 10.1148/radiology.168.2.3393671. [DOI] [PubMed] [Google Scholar]
- 25.Lewin M, Poujol-Robert A, Boëlle P-Y, Wendum D, Lasnier E, Viallon M, et al. Diffusion-weighted magnetic resonance imaging for the assessment of fibrosis in chronic hepatitis C. Hepatology. 2007;46:658–65. doi: 10.1002/hep.21747. [DOI] [PubMed] [Google Scholar]
- 26.Koinuma M, Ohashi I, Hanafusa K, Shibuya H. Apparent diffusion coefficient measurements with diffusion-weighted magnetic resonance imaging for evaluation of hepatic fibrosis. J Magn Reson Imaging. 2005;22:80–5. doi: 10.1002/jmri.20344. [DOI] [PubMed] [Google Scholar]
- 27.Luciani A, Vignaud A, Cavet M, Nhieu JTV, Mallat A, Ruel L, et al. Liver cirrhosis: intravoxel incoherent motion MR imaging--pilot study. Radiology. 2008;249:891–9. doi: 10.1148/radiol.2493080080. [DOI] [PubMed] [Google Scholar]
- 28.Mannelli L, Kim S, Hajdu CH, Babb JS, Clark TWI, Taouli B. Assessment of tumor necrosis of hepatocellular carcinoma after chemoembolization: diffusion-weighted and contrast-enhanced MRI with histopathologic correlation of the explanted liver. Am J Roentgenol. 2009;193:1044–52. doi: 10.2214/AJR.08.1461. [DOI] [PubMed] [Google Scholar]
- 29.Kirimlioglu H, Dvorchick I, Ruppert K, Finkelstein S, Marsh JW, Iwatsuki S, et al. Hepatocellular carcinomas in native livers from patients treated with orthotopic liver transplantation: biologic and therapeutic implications. Hepatology. 2001;34:502–10. doi: 10.1053/jhep.2001.26633. [DOI] [PMC free article] [PubMed] [Google Scholar]
- 30.Ahn SJ, Park M-S, Kim KA, Park JY, Kim I, Kang WJ, et al. 18F-FDG PET metabolic parameters and MRI perfusion and diffusion parameters in hepatocellular carcinoma: a preliminary study. PloS One. 2013;8:e71571. doi: 10.1371/journal.pone.0071571. [DOI] [PMC free article] [PubMed] [Google Scholar]
- 31.Punwani S, Taylor SA, Saad ZZ, Bainbridge A, Groves A, Daw S, et al. Diffusion-weighted MRI of lymphoma: prognostic utility and implications for PET/MRI? Eur J Nucl Med Mol Imaging. 2013;40:373–85. doi: 10.1007/s00259-012-2293-7. [DOI] [PubMed] [Google Scholar]
- 32.Olsen JR, Esthappan J, DeWees T, Narra VR, Dehdashti F, Siegel BA, et al. Tumor volume and subvolume concordance between FDG-PET/CT and diffusion-weighted MRI for squamous cell carcinoma of the cervix. J Magn Reson Imaging. 2013;37:431–4. doi: 10.1002/jmri.23830. [DOI] [PMC free article] [PubMed] [Google Scholar]
- 33.Gong N-J, Wong C-S, Chu Y-C, Gu J. Treatment response monitoring in patients with gastrointestinal stromal tumor using diffusion-weighted imaging: preliminary results in comparison with positron emission tomography/computed tomography. NMR biomed. 2013;26:185–92. doi: 10.1002/nbm.2834. [DOI] [PubMed] [Google Scholar]
- 34.Regier M, Derlin T, Schwarz D, Laqmani A, Henes FO, Groth M, et al. Diffusion weighted MRI and 18F-FDG PET/CT in non-small cell lung cancer (NSCLC): does the apparent diffusion coefficient (ADC) correlate with tracer uptake (SUV)? Eur J Radiol. 2012;81:2913–8. doi: 10.1016/j.ejrad.2011.11.050. [DOI] [PubMed] [Google Scholar]
- 35.Wong CS, Gong N, Chu Y-C, Anthony M-P, Chan Q, Lee HF, et al. Correlation of measurements from diffusion weighted MR imaging and FDG PET/CT in GIST patients: ADC versus SUV. Eur J Radiol. 2012;81:2122–6. doi: 10.1016/j.ejrad.2011.09.003. [DOI] [PubMed] [Google Scholar]
- 36.Park SH, Moon WK, Cho N, Chang JM, Im S-A, Park IA, et al. Comparison of diffusion-weighted MR imaging and FDG PET/CT to predict pathological complete response to neoadjuvant chemotherapy in patients with breast cancer. Eur Radiol. 2012;22:18–25. doi: 10.1007/s00330-011-2236-x. [DOI] [PubMed] [Google Scholar]
- 37.Wu X, Kellokumpu-Lehtinen P-L, Pertovaara H, Korkola P, Soimakallio S, Eskola H, et al. Diffusion-weighted MRI in early chemotherapy response evaluation of patients with diffuse large B-cell lymphoma--a pilot study: comparison with 2-deoxy-2-fluoro- D-glucose-positron emission tomography/computed tomography. NMR Biomed. 2011;24:1181–90. doi: 10.1002/nbm.1689. [DOI] [PubMed] [Google Scholar]
- 38.Rahmouni A, Luciani A, Itti E. MRI and PET in monitoring response in lymphoma. Cancer Imaging. 2005;5 Spec No A:S106–12. doi:10.1102/1470-7330.2005.0038. [DOI] [PMC free article] [PubMed]
- 39.Ho K-C, Lin G, Wang J-J, Lai C-H, Chang C-J, Yen T-C. Correlation of apparent diffusion coefficients measured by 3T diffusion-weighted MRI and SUV from FDG PET/CT in primary cervical cancer. Eur J Nucl Med Mol Imaging. 2009;36:200–8. doi: 10.1007/s00259-008-0936-5. [DOI] [PubMed] [Google Scholar]
- 40.Catalano OA, Rosen BR, Sahani DV, Hahn PF, Guimaraes AR, Vangel MG, et al. Clinical impact of PET/MR imaging in patients with cancer undergoing same-day PET/CT: initial experience in 134 patients--a hypothesis-generating exploratory study. Radiology. 2013;269:857–69. doi: 10.1148/radiol.13131306. [DOI] [PubMed] [Google Scholar]
- 41.Li SP, Padhani AR. Tumor response assessments with diffusion and perfusion MRI. J Magn Reson Imaging. 2012;35:745–63. doi: 10.1002/jmri.22838. [DOI] [PubMed] [Google Scholar]
- 42.Bonekamp S, Corona-Villalobos CP, Kamel IR. Oncologic applications of diffusion-weighted MRI in the body. J Magn Reson Imaging. 2012;35:257–79. doi: 10.1002/jmri.22786. [DOI] [PubMed] [Google Scholar]