Abstract
A granular bed was designed to collect nanoparticles as an alternative to nylon mesh screens for use in a nanoparticle respiratory deposition (NRD) sampler. The granular bed consisted of five layers in series: a coarse mesh, a large-bead layer, a small-bead layer, a second large-bead layer, and a second coarse mesh. The bed was designed to primarily collect particles in the small-bead layer, with the coarse mesh and large-bead layers designed to hold the collection layer in position. The collection efficiency of the granular bed was measured for varying depths of the small-bead layer and for test particles with different shape (cuboid, salt particles; and fractal, and stainless steel and welding particles). Experimental measurements of collection efficiency were compared to estimates of efficiency from theory and to the nanoparticulate matter (NPM) criterion, which was established to reflect the total deposition in the human respiratory system for particles smaller than 300 nm. The shape of the collection efficiency curve for the granular bed was similar to the NPM criterion in these experiments. The collection efficiency increased with increasing depth of the small-bead layer: the particle size associated with 50% collection efficiency, d50, for salt particles was 25 nm for a depth of 2.2 mm, 35 nm for 3.2 mm, and 45 nm for 4.3 mm. The best-fit to the NPM criterion was found for the bed with a small-bead layer of 3.2 mm. Compared to cubic salt particles, the collection efficiency was higher for fractal-shaped particles larger than 50 nm, presumably due to increased interception. Copyright 2015 American Association for Aerosol Research
1. INTRODUCTION
Nanoparticles (particles smaller than 100 nm) are in widespread commercial use in products, from metal oxides (ZnO and TiO2) in cosmetics and paints to carbon nanotubes (CNTs) in airplane parts. The toxicity of nanoparticles can be substantially greater than that of larger particles of the same composition (Oberdörster et al. 1992; Karlsson et al. 2009). Workers are handling these nanoparticles in substantial quantities during the manufacture of hundreds of commercial products (Hansen et al. 2008). However, no standardized methods are available to assess or quantify their presence in the workplace. The National Institute of Occupational Health and Safety (NIOSH) recommends mapping of the workplace with direct-reading nanoparticle monitors followed by identification of particle size and chemical species with transmission electron microscopy (TEM) (NIOSH 2009, 2011). Mapping provides only a brief snapshot of the workplace and may not accurately reflect personal exposures because nanoparticles tend to rapidly decrease in concentration away from a source. In more specific guidance, NIOSH recommend that personal exposures to nanoparticle titanium dioxide (TiO2) be quantified from two simultaneously collected respirable samples using a combination of gravimetric, spectroscopic, and microscopic methods (NIOSH method 0600 1998; NIOSH method 7300 2003). In addition, analysis of particles by microscopy is neither standardized (therefore subject to great uncertainty) nor automated (therefore costly, at approximately $300 per sample). The lack of cost-efficient and standard sampling methodologies specific to nanoparticles hinders development of practical and effective personal exposure assessment strategies. Consequently, the extent to which workers are exposed to nanoparticles is unknown and the effectiveness of control measures is difficult to evaluate.
Size-selective samplers are generally used to measure workplace particle exposures in order to infer the biologically relevant particle concentration. For example, inhalable samplers are designed to collect particles that enter into and are available to deposit anywhere in the respiratory system, while respirable samplers collect only smaller particles that are capable of entering into the pulmonary region of the lung (Vincent 1999). Respirable samplers are designed to match the respirable particle sampling criterion, which must eliminate particles larger than 10 μm from entering the sample, collect 4 μm particles with 50% efficiency, and collect particles of 1 μm with 100% efficiency (ACGIH 2014). By this definition, respirable samplers prevent the collection of larger particles (>10 μm) that may exist in the environment, while selectively sampling only those smaller particles at the specified collection efficiencies.
The respirable sampler has limited usefulness in quantifying nanoparticle exposures since the mass measured from a sample collected using the respirable sampler can be dominated by particles larger than 100 μm, which are outside the range of nanoparticles. Area samplers are available to quantify nanoparticle concentrations by excluding larger particles from analysis, including low-pressure impactors (LPIs) (Hering et al. 1978) or microorifice impactors (e.g., the nano Micro-Orifice Uniform Deposition Impactor, nano-MOUDI, MSP, USA). A differential mobility analyzer (DMA) (Knutdon and Whitby 1975) can also be used to classify nanomaterials, with the collection of classified particles on a filter for subsequent analysis. However, these devices are bulky and expensive, making them impractical for wide adoption in the field and limited to area (room) sampling rather than personal, breathing-zone sampling.
Recently, researchers have developed personal samplers to collect nanoparticles. A personal nanoparticle sampler (PENS), which enables the collection of both respirable particles and nanoparticles simultaneously, was developed by Tsai et al. (2012). The PENS consists of a respirable cyclone followed by a microorifice impactor with the 50% cutoff diameter (d50) of 100 nm and a filter. The PENS is designed that 100% of particles ranging from 100 nm to 4 μm are collected on the impaction plate while particles smaller than 100 nm are collected by the final filter. The PENS is 107 mm (length) × 44 mm (width) × 44 mm (depth) and weighs 240 g. A sampling pump (600 g) is required to take nanoparticles at the airflow rate of 2 L/min.
A lightweight (60 g) nanoparticle respiratory deposition (NRD) sampler was recently developed by Cena et al. (2011). In this work, Cena et al. (2011) established a nanoparticulate matter (NPM) criterion to serve as a rational target for nanoparticle sampler development. The criterion links sampler performance to the fractional deposition of particles smaller than 300 nm in all regions of the human respiratory tract and thus opens the possibility for the development of diffusion-based samplers. The NRD sampler (ZNRD001, Zefon, USA) operates at the airflow rate of 2.5 L/min and incorporates an impactor (d50 of 300 nm) and a diffusion stage containing eight nylon meshes (d50 of approximately 40 nm). The NRD sampler is used with the respirable cyclone similar to PENS. However, in subsequent studies of the NRD sampler, the mesh substrates were found to contain titanium, presumably a whitener for the nylon. The presence of titanium has prompted the search for diffusion substrates alternative to nylon mesh, particularly to use the NRD sampler as an alternative for the NIOSH exposure assessment protocol.
A granular bed might be a suitable substitute for the diffusion substrate. Under ordinary conditions, particles are captured onto granular materials mainly by mechanical collection mechanisms, such as inertial impaction, Brownian diffusion, gravitational settling, and interception (Tien and Ramarao 2007). Granular materials offer chemical and thermal resistance important in the treatment of hot and corrosive gases where filters cannot be used (Gal et al. 1985). Moreover, these beds can be made of low-cost granular material, such as glass beads. Gebhart et al. (1973) used a glass bead granular bed to collect aerosol particles with diameters ranging from 0.1 to 2 μm. D’Ottavio and Goren (1983) used glass beads, alumina beads, and pea gravel to collect aerosol particles with size range of 0.6–4.5 μm. Gebhart and Heyder (1985) used a granular bed composed of glass beads to simulate particle deposition in the human respiratory tract. Saini et al. (2002) developed a physical lung model using glass beads to study the lung deposition of charged aerosol particles.
The objective of this work was to develop a granular bed using glass beads as an alternative to nylon mesh screens for use in the NRD sampler. Experimental collection efficiencies were measured over a range of bed depths of the glass beads to assess which provided the best fit to NPM criterion for salt aerosol. The collection efficiency was then measured for highly fractal stainless steel and simulated welding particles. A theoretical model was also used to estimate the collection efficiency of the granular bed. The collection efficiencies measured experimentally were compared to those estimated from theory and to NPM criterion.
2. METHODS
2.1. Granular Bed Collection Substrate
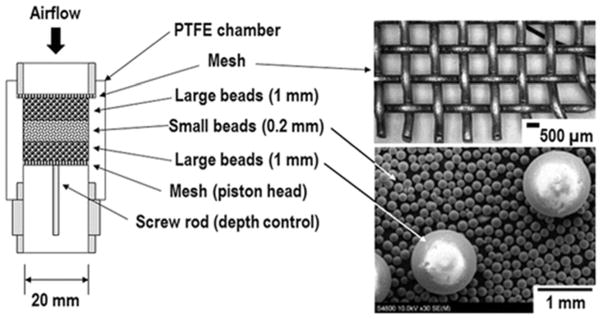
A granular bed substrate was designed to connect downstream of the impactor in the NRD sampler (25 mm inside diameter) and provide collection of particles similar to the NPM criterion at an airflow of 2.5 L/min. The new substrate consisted of five layers (Figure 1): a coarse mesh (US20 mesh; 85385T73, McMaster-Carr, USA), a large-bead (1 mm; Z273619, Sigma-Aldrich, USA) layer, a small-bead (200 μm; G9018, Sigma-Aldrich, USA) layer, a second large-bead (1 mm) layer, and a second coarse mesh. Specifications of mesh screens and glass beads are provided in Table 1. The large-bead layers and coarse mesh were designed to hold in place the small-bead layer, which served as the site of most particle collection. Meshes and glass beads were packed in a cylindrical polytetrafluoroethylene (PTFE) chamber. The inside diameter of PTFE chamber was fixed at 20 mm. The granular bed was lightweight (200 g) and able to fit into a universal lapel mount for personal samplers (ZA0061, Zefon, USA).
FIG. 1.
Granular bed sampler.
TABLE 1.
Specification of the granular bed
| Layer | Material | Weight, g | Depth, mm | Solidity | Pressure drop, Pa @ 0.13 m/s |
|---|---|---|---|---|---|
| 1. Mesh | Stainless steel | 0.85 | 0.8 | 0.27 | 0.8 |
| 2. Large beads (1 mm) | Borosilicate | 2.6 | 6.6 | 0.57 | 18.7 |
| 3. Small beads (0.2 mm) | Soda-lime | 1.0 | 2.2 | 0.60 | 250 |
| 1.5 | 3.2 | 353 | |||
| 2.0 | 4.3 | 444 | |||
| 4. Large beads (1 mm) | Same as Layer 2 | ||||
| 5. Mesh | Same as Layer 1 | ||||
The PTFE chamber was loaded with beads after measuring weights of large and small beads. The weight of small beads was increased from 1 g to 2 g to optimize the small-bead depth to attain a collection efficiency similar to the NPM criterion. The weights of each layer and the resulting bed depths are reported in Table 1. The depth of both large-bead layers was fixed at 2.6 mm, but the depth of the small-bead layer was varied to 2.2, 3.2, and 4.3 mm. Electrical charge on the beads and walls of the chamber was neutralized by passing clean air at the flow rate of 2.5 L/min over two polonium-210 strips (2U500, Staticmaster, USA) and then through the granular bed for 30 min. The total pressure drop through the granular bed ranged from 290 to 480 Pa.
2.2. Experiment
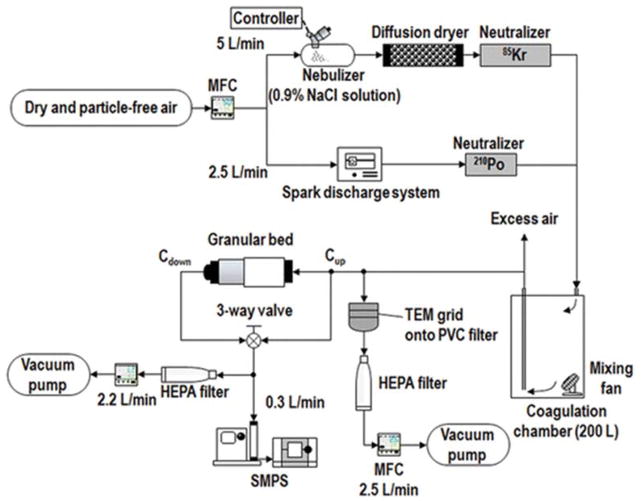
The experimental setup, shown schematically in Figure 2, was used to measure the particle collection characteristics of the granular bed substrate. Dry and particle-free air, controlled by a mass flow controller (MFC; MPC20, Porter Instrument, USA), was delivered to the test particle generation system. Two particle generation methods were used in independent tests to generate test particles of substantially different shape: cubical salt and fractal metal agglomerates.
FIG. 2.
Experimental setup.
Cubical shaped particles were produced by nebulizing (Aeroneb Solo System, Aerogen, Ireland) a 0.9% NaCl solution by weight (NDC 0338-0049-04, Baxter, USA) to produce salt-water droplets, which were then dried by passing them through a diffusion dryer. The nebulizer was turned on and off (30 Hz frequency and 100% duty cycle) to control the initial concentration of salt particles before coagulation. The dry salt particles were passed through a Kr-85 charge neutralizer (3054, TSI, USA) to neutralize their charge to Boltzmann equilibrium.
Fractal agglomerates composed of stainless steel and simulated welding particles were produced by spark discharge following Park et al. (2014). A spark discharge was formed in an air environment between two identical metal electrodes: stainless steel rod (303 alloy; 2EXC7, Grainger, USA) to generate stainless steel particles; and welding rods (H544051-RDP, Hobart, USA) to produce simulated welding particles. The electrical circuit included a resistance of 0.5 M (two 1 M resistors arranged in parallel; GS10LC105G, KOA Speer Electronics, USA), a capacitance of 1 nF (DHRB34A102M2BB, Murata Electronics North America, USA), a loading current of 3 mA, and an applied voltage of 6 kV (Power supply; 10C24-P125, UltraVolt, USA). Metal agglomerate particles were passed through a polonium-210 aerosol neutralizer (2U500, Staticmaster, USA) to neutralize their charge to a Boltzmann equilibrium.
The neutralized test particles were delivered to a coagulation chamber (200 L) to increase their size. Polydispersed particles were produced and their median sizes were maintained near 100 nm by controlling initial concentration. Total number concentration of test particles were controlled and maintained at least 5×10⁵ particles/cm3. After passing through the coagulation chamber, test particles were sampled onto a TEM grid (Cu-400-mesh, Ultrathin Carbon Type-A, Ted Pella, USA) placed on the polyvinyl chloride (PVC) membrane filter (225-5-37, SKC, USA). Sampled particles were analyzed by TEM (JEM-1230, JEOL, Japan) to evaluate their morphology.
Particle number concentrations, by electrical mobility size (dm) from 20 nm to 500 nm (64 channels per decade, Total 90 discrete dms), were measured up- and downstream of the granular bed using a scanning mobility particle sizer (SMPS; 3936, TSI, USA), consisting of a classifier controller (3080, TSI, USA), an aerosol neutralizer (3077, TSI, USA), a DMA (3081, TSI, USA), and a condensation particle counter (CPC; 3776, TSI, USA). The fractional particle collection efficiency, ηc(dm), was defined using the following equation:
| [1] |
where Cdown(dm) and Cup(dm) are the number concentrations of down- and upstream of the granular bed, respectively. The measurement occurred in the following sequence: Cup1-Cdown1- Cup2-Cdown2-Cup3-Cdown3-Cup4. For Equation (1), values of (Cup1 + Cup2)/2, (Cup2 + Cup3)/2 and (Cup3 + Cup4)/2 were used and then average of three ηcs was calculated. All the tests for the collection efficiencies were performed in the same method. To evaluate the size distribution of test particles, average values of four Cups were used.
Because the granular bed substrate was designed to operate downstream of NRD impactor (d50 of 300 nm), the experimental collection efficiency of the granular bed was adjusted to account for the penetration through the impactor. From the experimental results of Cena et al. (2011), empirical equations for penetration through the NRD impactor were determined as (see details in the online supplementary information):
| [2] |
| [3] |
where da is the aerodynamic diameter. The da in the Equations (2) and (3) was converted to the dm on the basis of the equations below:
| [4] |
| [5] |
where CC is the Cunningham slip correction factor, χ is the dynamic shape factor (χ was assumed to be 1.08 for salt particles and 1.4 for stainless steel and welding particles [Hinds 1999]), ρ0 is the unit density ( = 1000 kg/m3), and ρp is the particle density. The ρp was assumed to be 2200 kg/m3 for salt particles and 3400 kg/m3 for stainless steel and welding particles (Hewett 1995).
Using Equations (1)–(5), the overall collection efficiency of the substrate adjusted for the presence of the impactor was defined as:
| [6] |
2.3. Theory
Collection efficiency through a granular bed of spheres was estimated from theoretical considerations of particle diffusion and interception. The effects of inertial impaction and gravitational settling were neglected because particles of interest were smaller than 300 nm. Deposition due to electrostatic forces was ignored because charges of test particles and glass beads were neutralized prior to conducting experiments. The collection efficiency for the different layers of the granular bed substrate was calculated as:
| [7] |
where dv is the equivalent volume diameter of particle, Pm(dv) is the penetration of stainless steel mesh, and Pg,L(dv) and Pg,S(dv) are the penetration of large and small beads layers, respectively. Pm(dv) was calculated as (Cheng and Yeh 1980):
| [8] |
where αm, lm, and dmesh are the solidity, thickness, and wire diameter of stainless steel mesh, respectively. Pem is the Peclet number of mesh (= dmesh×U/D(dv)). U is the superficial velocity, and D(dv) is the diffusion coefficient of test particles (Hinds 1999). The constant B, which is the function of geometric arrangement for parallel staggered cylinder model, is given by (Cheng and Yeh 1980):
| [9] |
Penetration of each layer consisted of glass beads sized dg, was calculated as following equation (Lee 1981):
| [10] |
where αg and lg are the solidity and depth of beads layer, respectively. dg is the diameter of bead. ED(dv) and ER(dv) are the collection efficiencies of a single sphere due to diffusion and interception, respectively. ED(dv) and ER(dv) were calculated as follows (Lee 1981):
| [11] |
| [12] |
where Peg is the Peclet number of glass beads ( = dg×u/D(dv)), and u is the flow velocity in the beads layer ( = U/(1–αg)). Kuwabara's hydrodynamic factor, K, is defined as:
| [13] |
The dv in Equations (7)–(12) was converted to the dm to compare estimated values from theory to experimental results.
2.4. Data Analysis
The overall collection efficiency of the substrate adjusted for the presence of the impactor was calculated from Equation (6). The ηadj from experiment and theory were compared to the NPM criterion, as presented in Cena et al. (2011). The R2 of ηadj and NPM curve was calculated as follows:
| [14] |
where ηadj,avg is the mean of the collection efficiency. The R2 of ηadj from experiment and theory was also calculated as follows:
| [15] |
3. RESULTS AND DISCUSSION
3.1. Size Distribution and Shape of Test Particles
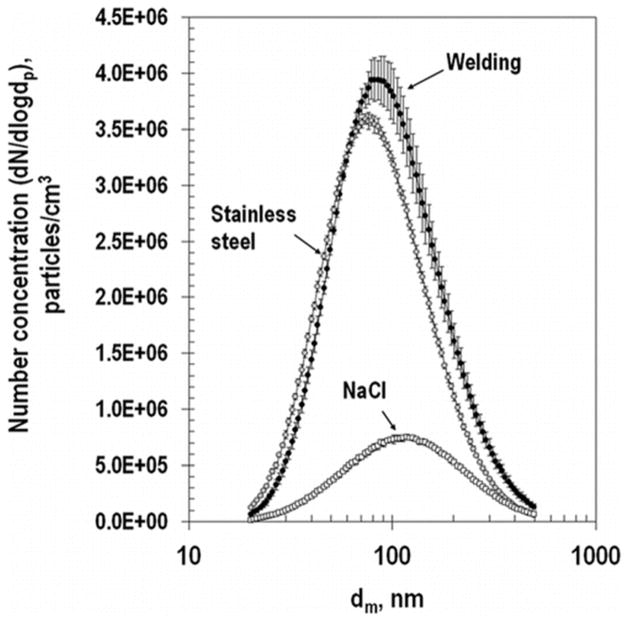
The size distribution of the test particles obtained by SMPS is shown in Figure 3 with summary details provided in Table 2. Size distributions of test particles were log-normally distributed with a geometric standard deviation ranging from 1.8 to 1.9. The coefficients of variation of the total number concentration were: 2.5% for salt, 0.8% for stainless steel particles, and 4.2% for welding particles, which indicates that concentrations of test particles were stable during the experiment. The geometric mean diameters of test particles were near 100 nm. The coefficients of variation of the geometric mean diameter were: 1.5% for salt, 0.8% for stainless steel particles, and 3.0% for welding particles.
FIG. 3.
Size distributions of test particles. Error bars represent the standard deviation of four measurements.
TABLE 2.
Characteristics of test particles (values in parentheses represent the standard deviation of four measurements)
| Test particles | Geometric mean diameter, nm | Geometric standard deviation | Total number concentration, particles/cm3 | Shape |
|---|---|---|---|---|
| Salt | 114 (±2) | 1.9 (±0) | 5.4 × 10⁵ (±1.4 × 10⁴) | Cube |
| Stainless steel | 83 (±1) | 1.8 (±0) | 2.3 × 10⁶ (±1.8 × 10⁴) | Fractal |
| Welding | 94 (±3) | 1.8 (±0) | 2.5 × 10⁶ (±1.1 × 10⁵) | Fractal |
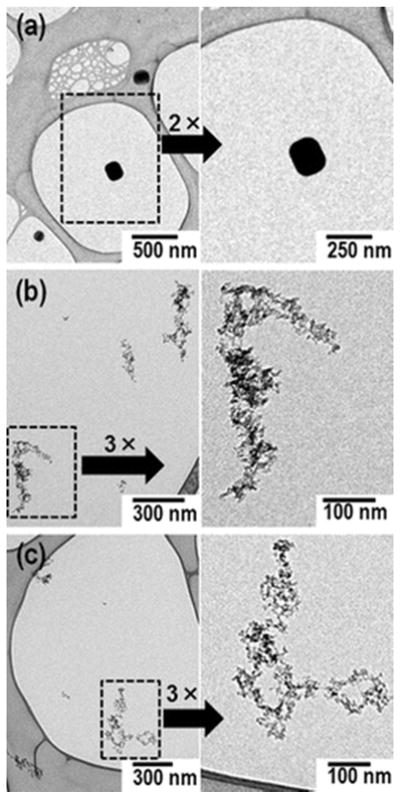
Images showing the morphology and size of the generated test particles are shown in Figure 4. Salt particles were confirmed to have cubic shape with rounded edges, whereas stainless steel and welding particles were clusters and chain-like agglomerates formed from coagulation of much smaller primary particles. The shape of stainless steel and welding particles were similar to one of particles generated by Park et al. (2014).
FIG. 4.
TEM images of salt (a), stainless steel (b), and welding particles (c).
3.2. Collection Efficiency as a Function of Depth of the Small-Bead Layer
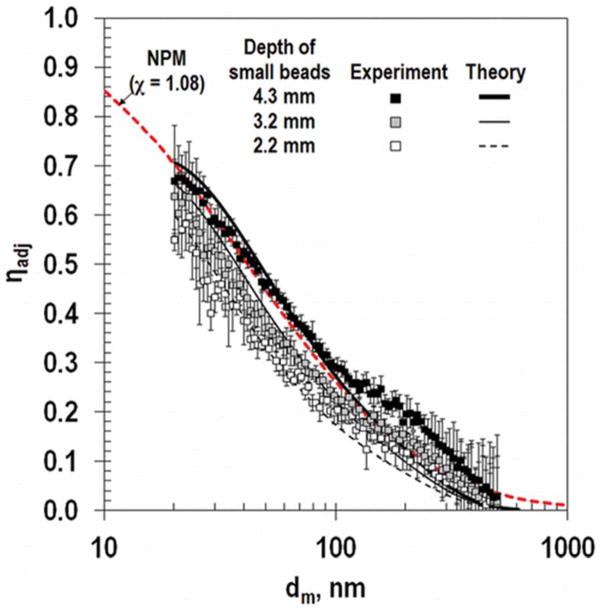
The experimentally measured and theoretical collection efficiencies of the granular bed adjusted for the presence of the impactor were compared to the NPM criterion. The χ was assumed 1.08 for salt particles. The adjusted collection efficiencies with three bed depths for salt particles are shown in Figure 5. As expected, collection efficiencies decreased with decreasing bed depth. The shapes of the collection efficiency curves were similar to the target NPM criterion. Collection efficiencies were lowest (<5%) for the largest (500-nm) particles and gradually increased with decreasing particle size. The d50 and R2 are in Table 3.
FIG. 5.
Adjusted collection efficiency of salt particles for the granular bed sampler for varying depths of the small-bead layer. Error bars represent the standard deviation of three measurements.
TABLE 3.
d50 and R2 for the granular bed with varying depths of the small-bead layer
| Test particles | Depth of small-bead, mm | d50, nm | R2, ηadj-NPM | R2, ηadj,exp-ηadj,th | ||
|---|---|---|---|---|---|---|
| Experiment | Theory | Experiment | Theory | |||
| Salt | 2.2 | 25 | 27 | 0.78 | 0.77 | 0.96 |
| Salt | 3.2 | 35 | 35 | 0.95 | 0.97 | 0.96 |
| Salt | 4.3 | 45 | 45 | 0.94 | 0.99 | 0.95 |
| Stainless steel | 3.2 | 33 | — | 0.91 | — | — |
| Welding | 3.2 | 35 | — | 0.75 | — | — |
For the NaCl particles, the adjusted experimental collection efficiency, ηadj, for a small-bead bed depth of 3.2 mm was slightly lower than the NPM curve, whereas the one with a depth of 4.3 mm was slightly higher than the NPM curve. The experimental d50 for the depth of 3.2 mm was 35 nm, close to d50 = 40 nm from the NPM criterion. The small-bead depth of 3.2 mm was selected for testing additional aerosol types because it had the lowest deviation from the NPM criterion as expressed by R2.
The same trends from experimental collection efficiency were observed in theoretical estimates, particularly for particles smaller than 100 nm (Figure 5). The shapes of theoretical collection efficiencies were similar to those of experimental results (R2 = 0.95–0.96). The theoretical ηadj for small-bead bed depth of 3.2 mm (solid line) was slightly lower than the NPM curve while the one with a depth of 4.3 mm (thicker solid line) was slightly higher than the NPM curve. The theoretical ηadj for the depth of 4.3 mm had the highest coefficient of determination (R2 = 0.99).
The theoretical d50 for the small-bead bed depth of 3.2 mm was same as one of the experimental results. However, the gap of experimental and theoretical ηadj was increased to maximum 0.09 for particles larger than 100 nm. This observation indicates that theory underestimated the collection efficiency for particles larger than 100 nm that could be affected by increased interception effects. The other possible reason is that captured particles formed porous structures between the glass beads and worked as secondary collection. These structures would enhance interception and result in the increased collection efficiency observed.
3.3. Collection Efficiency for Particles of Different Shape
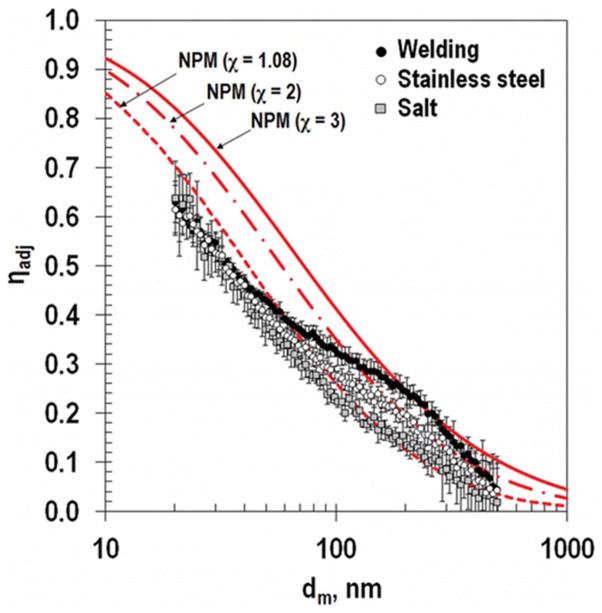
The adjusted collection efficiencies of granular bed with small-bead depth of 3.2 mm for salt, stainless, and welding particles are shown in Figure 6. NPM curves with constant values for χ of 1.08, 2, and 3 are also plotted. The shapes of the ηadj curves for salt, stainless steel, and welding particles were similar to the target NPM curve with χ of 1.08. The d50 for salt, stainless steel, and welding particles were similar to d50 = 40 nm of the NPM criterion with χ of 1.08. However, the ηadj for stainless steel and welding particles had larger deviations from NPM curve with χ of 1.08 than one for salt particles, particularly as the electric mobility particle size increased. Collection efficiencies of metal particles were similar to those of salt particles smaller than 50 nm, whereas they increasingly diverged for progressively larger particles. The ηadj for stainless steel and welding particles larger than 50 nm were increased with increasing particle size. One reason could be that aggregated particles have a better chance of being collected than sphere particles due to increasing interception (Cheng et al. 1991; Kim et al. 2009). As shown in Figure 3, salt had cubic shape but stainless steel and welding particles had highly fractal shapes. From Figure 6, the χ of stainless steel and welding particles at 200 nm can be expected as 2 and 3, respectively. This finding is attributed to the fact that metal fume particles transition from near-spherical for primary particles (χ = 1 for dm < 5 nm), to compact aggregates (χ 1 for 5 nm < dm < 50 nm), and to highly fractal (χ > 1 for dm > 50 nm) as pointed out by Rogak et al. (1993) and Kim et al. (2009). At this time, sufficient information is not available from microscopic imaging to compute the varying shape factor by size but will be the subject of future work.
FIG. 6.
Adjusted collection efficiency of different test particles for the granular bed sampler with a small-bead layer of 3.2 mm. Error bars represent the standard deviations of three measurements.
The deposition amount of fractal particles in human respiratory tract is higher than one of their equivalent volume spheres (Broday and Rosenzweig 2011). For spherical particles smaller than 50 nm, diffusion is the predominant mechanism for deposition in all the airways. However, particle aggregation increases interception and inertial impaction which results in increasing deposition in the upper airways (Asgharian and Yu 1990). Consequently, total deposition of aggregated particles increases with an increasing size and morphological complexity. The NPM criterion was designed for spherical particles and may not reflect the deposition of particles with fractal structure, such as diesel soot, or high aspect ratio, such as carbon nanotubes. Thus, the NPM criterion needs to consider particle shape. The shape factor can be used to modify the NPM curves for particles with various shapes.
3.4. Limitations and Next Steps
The granular bed in this part of the study consisted of five layers. The proportion of particle deposition on the mesh and larger supporting bead layer surfaces compared to that of the small-bead layer was not specifically examined in this study: it is still unclear whether particles deposited only on the bed of the 0.2 mm glass beads. However, the coarse mesh and larger glass beads could possibly be eliminated in future granular beds if the small-bead layer could be fixed by some way, such as by sintering the glass beads.
At present, there is no standard method to extract the particles collected onto glass beads for analysis using standard analytical methods, such as inductively coupled plasma (ICP); method development, particularly sample recovery, is still needed. Future research will focus on development of a method for chemical analysis.
Overall, this study indicates that granular beds show promise as a particle collection substrate for nanoparticle samplers. Nearly round particles were collected by the granular bed at efficiencies similar to the NPM criterion. The depth of the beads layer, size, and material of beads can be modified using theory to match desired collection efficiencies as the NPM criterion specifications change to accommodate new understanding of respiratory deposition of nanomaterials of various shapes.
4. CONCLUSION
This study was the first to report a size-selective sampling method using a granular bed sampler. The granular bed was designed and investigated as a nanoparticle collection substrate alternative to nylon mesh screens for use in the NRD sampler. The collection performance of a granular bed using glass beads was examined over three small-bead bed depths and three test particles (salt, stainless steel, and welding particles). The collection efficiency for salt particles was matched well to the NPM curve that is the same as collection efficiency of the NRD sampler, but collection efficiencies for stainless steel and welding particles increased over salt particle collection efficiencies, where particle shape factor may be more influential in particle deposition within the granular bed.
Supplementary Material
Acknowledgments
Funding
This research was funded by generous support from the National Institute for Occupational Safety and Health (Training Grant T42OH008491 and R01OH010238).
Footnotes
Supplemental data for this article can be accessed on the publisher's website.
References
- 1.ACGIH. TLVs and BEIs. American Conference of Governmental Industrial Hygienists; Cincinnati, OH: ACGIH; 2014. [Google Scholar]
- 2.Asgharian B, Yu CP. Deposition of straight chain aggregates in the human lung. Aerosol Sci Technol. 1990;12(3):777–785. [Google Scholar]
- 3.Broday DM, Rosenzweig R. Deposition of Fractal-Like Soot Aggregates in the Human Respiratory Tract. J Aerosol Sci. 2011;42(6):372–386. [Google Scholar]
- 4.Cena LG, Anthony TR, Peters TM. A Personal Nanoparticle Respiratory Deposition (NRD) Sampler. Environ Sci Technol. 2011;45(15):6483–6490. doi: 10.1021/es201379a. [DOI] [PMC free article] [PubMed] [Google Scholar]
- 5.Cheng MT, Xie GW, Fu TH, Shaw DT. Filtration of Ultrafine Chain Aggregate Aerosols by Nuclepore Filters. Aerosol Sci Technol. 1991;15(1):30–35. [Google Scholar]
- 6.Cheng YS, Yeh HC. Theory of a Screen-Type Diffusion Battery. J Aerosol Sci. 1980;11(3):313–320. [Google Scholar]
- 7.D’Ottavio T, Goren SL. Aerosol Capture in Granular Beds in the Impaction Dominated Regime. Aerosol Sci Technol. 1983;2(2):91–108. [Google Scholar]
- 8.Gal E, Tardos G, Pfeffer R. Study of Inertial Effects in Granular Bed Filtration. AIChE J. 1985;31(7):1093–1104. [Google Scholar]
- 9.Gebhart J, Roth C, Stahlhofen W. Filtration Properties of Glass Bead Media for Aerosol Particles in the 0· 1–2 μm Size Range. J Aerosol Sci. 1973;4(5):355–371. [Google Scholar]
- 10.Gebhart J, Heyder J. Removal of Aerosol Particles from Stationary Air Within Porous Media. J Aerosol Sci. 1985;16(2):175–187. [Google Scholar]
- 11.Hansen SF, Michelson ES, Kamper A, Borling P, Stuer-Lauridsen F, Baun A. Categorization Framework to Aid Exposure Assessment of Nanomaterials in Consumer Products. Ecotoxicology. 2008;17(5):438–447. doi: 10.1007/s10646-008-0210-4. [DOI] [PubMed] [Google Scholar]
- 12.Hinds WC. Aerosol Technology: Properties, Behavior, and Measurement of Airborne Particles. 2. John Wiley & Sons, Inc; New York, NY: 1999. [Google Scholar]
- 13.Hering SV, Flagan RC, Friedlander SK. Design and Evaluation of New Low-Pressure Impactor, 1. Environ Sci Technol. 1978;12(6):667–673. [Google Scholar]
- 14.Karlsson HL, Gustafsson J, Cronholm P, Moller L. Size-Dependent Toxicity of Metal Oxide Particles—A Comparison Between Nano- and Micrometer Size. Toxicol Lett. 2009;188(2):112–118. doi: 10.1016/j.toxlet.2009.03.014. [DOI] [PubMed] [Google Scholar]
- 15.Kim SC, Wang J, Emery MS, Shin WG, Mulholland GW, Pui DY. Structural Property Effect of Nanoparticle Agglomerates on Particle Penetration Through Fibrous Filter. Aerosol Sci Technol. 2009;43(4):344–355. [Google Scholar]
- 16.Knutdon EO, Whitby KT. Aerosol Classification by Electric Mobility: Apparatus, Theory, and Application. J Aerosol Sci. 1975;6(6):443–451. [Google Scholar]
- 17.Lee KW. Maximum Penetration of Aerosol Particles in Granular Bed Filters. J Aerosol Sci. 1981;12(1):79–87. [Google Scholar]
- 18.NIOSH method 0600. NIOSH Manual of Analytical Methods. Cincinnati, OH: U.S. Department of Health and Human Services, Public Health Service Centers for Disease Control and Prevention, National Institute for Occupational Safety and Health; 1998. Particulates not otherwise regulated, respirable. Method 0600 (supplement issued January 15, 1998) DHHS (NIOSH) Publication No. 94-113. http://www.cdc.gov/niosh/nmam/pdfs/0600.pdf. [Google Scholar]
- 19.NIOSH method 7300. NIOSH Manual of Analytical Methods. 4. Cincinnati, OH: U.S. Department of Health and Human Services, Public Health Service, Centers for Disease Control and Prevention, National Institute for Occupational Safety and Health; 2003. Elements by ICP (Nitric/Perchloric acid ashing) Method 7300 (supplement issued May 15, 2003. DHHS (NIOSH) Publication 94-113. http://www.cdc.gov/niosh/nmam/pdfs/7300.pdf. [Google Scholar]
- 20.NIOSH. Approaches to Safe Nanotechnology: Managing the Health and Safety Concerns Associated with Engineered Nanomaterials. Department of Health and Human Services, Centers for Disease Control and Prevention, National Institute for Occupational Safety and Health, NIOSH; 2009. http://www.cdc.gov/niosh/docs/2009-125/pdfs/2009-125.pdf. [Google Scholar]
- 21.NIOSH. Current Intelligence Bulletin 63: Occupational Exposure to Titanium Dioxide. Department of Health and Human Services, Centers for Disease Control and Prevention, National Institute for Occupational Safety and Health, NIOSH; 2011. http://www.cdc.gov/niosh/docs/2011-160/pdfs/2011-160.pdf. [Google Scholar]
- 22.Oberdörster G, Ferin J, Gelein R, Soderholm SC, Finkelstein J. Role of the Alveolar Macrophage in Lung Injury: Studies with Ultrafine Particles. Environ Health Persp. 1992;97:193–199. doi: 10.1289/ehp.97-1519541. [DOI] [PMC free article] [PubMed] [Google Scholar]
- 23.Park JH, Mudunkotuwa IA, Kim JS, Stanam A, Thorne PS, Grassian VH, Peters TM. Physicochemical Characterization of Simulated Welding Fume from a Spark Discharge System. Aerosol Sci Technol. 2014;48(7):768–776. doi: 10.1080/02786826.2014.925536. [DOI] [PMC free article] [PubMed] [Google Scholar]
- 24.Rogak SN, Flagan RC, Nguyen HV. The Mobility and Structure of Aerosol Agglomerates. Aerosol Sci Technol. 1993;18(1):25–47. [Google Scholar]
- 25.Saini D, Yurteri CU, Grable N, Sims RA, Mazumder MK. Drug Delivery Studies on Electrostatically Charged Dry Powder Inhaler Aerosols Using a Glass Bead Lung Model. EEE Industry Applications Conference. 37th IAS Annual Meeting; Pittsburgh, PA. 2002. pp. 2451–2453. [Google Scholar]
- 26.Tien Chi, Ramarao BV. Granular Filtration of Aerosols and Hydrosols. 2. Elsevier/Butterworths-Heinemann; Boston, MA: 2007. [Google Scholar]
- 27.Tsai CJ, Liu CN, Hung SM, Chen SC, Uang SN, Cheng YS, Zhou Y. Novel Active Personal Nanoparticle Sampler for the Exposure Assessment of Nanoparticles in Workplaces. Environ Sci Technol. 2012;46(8):4546–4552. doi: 10.1021/es204580f. [DOI] [PubMed] [Google Scholar]
- 28.Vincent JH. Particle Size-Selective Sampling for Particulate Air Contaminants. American Conference of Governmental Industrial Hygienists; Cincinnati, OH: ACGIH; 1999. [Google Scholar]
Associated Data
This section collects any data citations, data availability statements, or supplementary materials included in this article.


