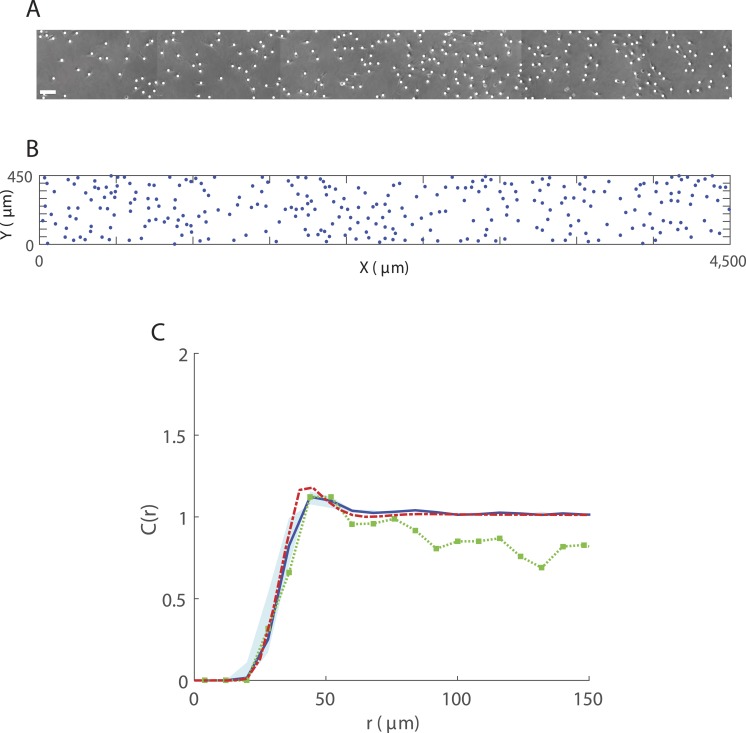
Figure 4. Spatial structure in 3T3 fibroblast cells for 286 cells in a 4,500 μm × 450 μm region.
(A) Sample image (obtained from a well containing cell suspension of approximate initial density 30,000 cells/ml) showing superimposed markers (white dots). Scale bar corresponds to 100 µm; (B) Cell locations (blue dots) at t = 15 h from a single IBM simulation. Parameters are α = 0h−1, β = 1,000μm, σw = σv = 10μm, m = 5h−1, λμ = 0.1μm−1, σμ = 2.5μm; (C) PCF CIBM(r) (blue solid line) obtained from averaging results from 200 simulations of the IBM at t = 15 h. PCFs computed from the IBM using values of β within the range ±75% of β = 1,000μm, lie within the region indicated by the blue shaded area. PCF Cexp(r) (green squares-dotted line) generated from experimental image, for δr = 8μm. PCF CSM(r) (red dashed line) approximated by spatial moment model at t = 15 h, for Δ = 5μm and ξmax = 150μ m.

