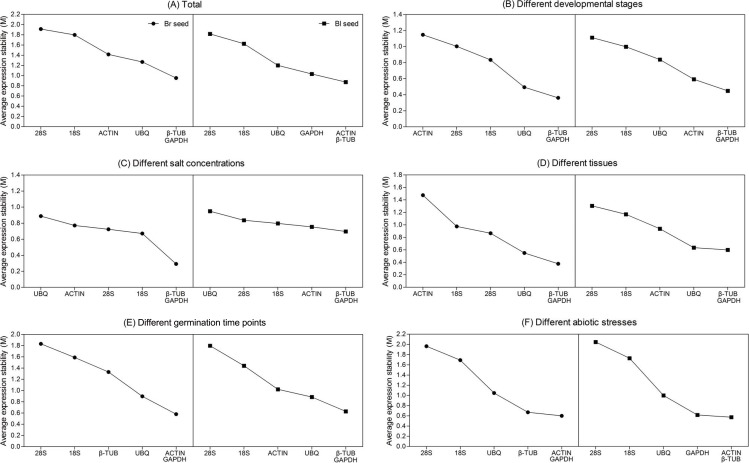
Figure 3. Gene expression stability and ranking of six reference genes based on geNorm algorithm.
The cutoff M value is proposed to be 1.5, a lower M value indicates more stable expression. The least stable genes are on the left, and the most stable ones are on the right. (A) All tested samples; (B) different developmental stages; (C) different salt concentrations; (D) different seedling tissues (root, stem, and leaf); (E) different germination time points; (F) different abiotic stresses. Bl, black; Br, brown.

