

Abstract
Diabetic nephropathy (DN) is one of the most serious microvascular complications of diabetes. The study aims to evaluate the diagnostic value of serum neutrophil gelatinase-associated lipocalin (NGAL) and retinol-binding protein 4 (RBP4) as biomarkers for early detection of nephropathy in type 2 diabetic patients. The current study was performed on 150 type 2 diabetic patients. These patients were classified into three equal groups according to their albumin/creatinine ratio (ACR), including patients with normoalbuminuria (ACR <30 mg/g creatinine), patients with microalbuminuria (ACR = 30–300 mg/g creatinine), and patients with macroalbuminuria (ACR >300 mg/g creatinine). Fifty apparently healthy subjects matching the same age and socioeconomic status with diabetic subjects were selected as a control group. The plasma glucose, insulin, glycosylated hemoglobin (HbA1c), homeostasis model assessment of insulin resistance (HOMA-IR), lipid profile, urea, creatinine, cystatin C, glomerular filtration rate (GFR), NGAL, and RBP4 were measured in the studied groups. Significantly elevated NGAL and RBP4 levels were observed in micro- and macroalbuminuric diabetic groups when compared to the control and normoalbuminuric diabetic groups. NGAL and RBP4 were found to correlate positively with duration of diabetes, systolic and diastolic blood pressure, glucose, HbA1c, HOMA-IR, triacylglycerol, and ACR, but correlate inversely with GFR in DN groups. Receiver operating characteristic curves revealed that for early detection of DN, the best cutoff values to discriminate DN and diabetic without nephropathy groups were 91.5 ng/mL for NGAL with 87% sensitivity, 74% specificity, and area under the curve (AUC) = 0.881; 24.5 ng/mL for RBP4 with 84% sensitivity, 90% specificity, and AUC = 0.912; and 37.5 mg/g creatinine for ACR with 89% sensitivity, 72% specificity, and AUC = 0.819. RBP4 is more specific (90% specificity) than NGAL (74% specificity) and ACR (72% specificity). Therefore, RBP4 marker may serve as a tool to follow-up clinical monitoring of the development and progression of DN.
Keywords: NGAL, RBP4, type 2 diabetic nephropathy, albuminuria, GFR
Introduction
Diabetes is a widespread disease with multiple complications that affect both micro- and macrovasculature.1 Diabetic nephropathy (DN) is one of the most serious microvascular complications of diabetes. It is characterized by elevated urinary albumin excretion rate, increase in blood pressure, and decline in renal function leading to end-stage renal disease. In addition, these patients have a high risk of cardiovascular disease,2 which further increases with deteriorating renal function.3
DN is a rapidly increasing problem in the developing countries with the epidemic of type 2 diabetes mellitus (T2DM).4 A study in 2008 considered DN to be the most prevalent chronic complication among type 2 diabetic patients in Saudi Arabia, accounting for 32.1%.5
Currently, changes in albuminuria are considered a hallmark of onset or progression of DN. However, some diabetic patients suffer from advanced renal pathological changes and the decline of kidney function progression even if urinary albumin levels are in the normal range, indicating that albuminuria is not the perfect marker for the early detection of DN.6 It has been widely proposed that other biomarkers are needed for early detection of renal dysfunction.
Glomerular and tubulointerstitial injury plays a role in the pathogenesis of DN,7 and several tubular damage markers have been investigated for early detection.8 Among them is neutrophil gelatinase-associated lipocalin (NGAL), which is produced in epithelial cells and neutrophils.9 Previous studies have shown NGAL to be one of the most significantly upregulated proteins in the kidney tubules following ischemic injury, indicating that it is a sensitive marker for acute kidney injury.10,11 The urinary NGAL level in a number of type 1 diabetic patients was found to be already elevated, irrespective of whether micro- or macroalbuminuria was apparent, indicating that tubular damage may occur independently and earlier than glomerular dysfunction.9
In a cohort of 158 adults with stage 3 or 4 coronary kidney disease, urinary NGAL to creatinine ratio was associated with mortality and renal replacement therapy, and this risk was independent of kidney and cardiovascular risk factors.12 Similar results were found in a cohort of 96 coronary kidney disease patients followed for 18.5 months where plasma and urinary NGAL predicted coronary kidney disease progression after adjustment for glomerular filtration rate (GFR).13 Thus far, there is evidence to support that NGAL levels either in plasma or urine can predict kidney disease progression independent of GFR; however, the data are limited by the number of participants and larger studies are needed before establishing this biomarker in clinical practice.14
Retinol-binding protein 4 (RBP4) had been initially studied as an adipokine that binds specifically to vitamin A, belongs to the lipocalin family, transports small hydrophobic molecules,15 and is produced mainly in the liver and mature adipocytes (20%–40%).16 Its role in insulin resistance (IR) is not clearly defined. RBP4 probably induces the expression of enzymes involved in gluconeogenesis in hepatocytes (mainly phosphoenolpyruvate carboxykinase) and impairs insulin signaling pathways in skeletal muscle.15 RBP4 is secreted into circulation bound to retinol and transthyretin.17 In addition to retinol transportation, RBP4 upregulation has been reported to be correlated with obesity and IR.9 Obesity, which has reached epidemic proportions worldwide, is a major cause of IR.18 However, IR does not develop in all obese persons and genetic background contributes strongly to IR, even in nonobese persons.19
Several studies have demonstrated that circulating RBP4 concentration is elevated in human beings with IR.19,20 In contrast, other studies have shown normal RBP4 concentration in obese menopausal women and low concentration in individuals with T2DM and that RBP4 concentration are unrelated to insulin sensitivity in calorie-restricted obese individuals.21
There is evidence that elevation of RBP4 serum concentration is more likely to be caused by the presence of impaired kidney function rather than T2DM. However, there are studies reporting the fact that urinary RBP4 excretion is increased in early DN, indicating that the increased RBP4 serum concentrations are not necessarily related to a decrease of urinary RBP4 excretion.22,23 Therefore, how serum RBP4 concentrations influence diabetic patients with nephropathy requires more investigation because sufficient data in these patients are lacking.24
Studies focusing on the relationship between RBP4 levels and renal function have reached different conclusions, possibly due to the use of different criteria.24–26 Clinical and experimental studies have provided evidence that RBP4 has a pivotal role in T2DM.27
Recently, there has been an explosive growth in the search for more sensitive, specific, and prognostically accurate biomarkers to assist in the care of patients with or at risk of kidney disease. In this study, we aim to evaluate the diagnostic value of serum NGAL and RBP4 as biomarkers for early detection of nephropathy in type 2 diabetic patients.
Materials and Methods
Subjects
This study included 200 subjects who were divided into four groups of 50 subjects each: group I, healthy normal control subjects matching the same age and socioeconomic status with diabetic subjects; group II, T2DM with normoalbuminuria (albumin/creatinine ratio [ACR] <30 mg/g creatinine); group III, T2DM with microalbuminuria (ACR = 30 − 300 mg/g creatinine); and group IV, T2DM with macroalbuminuria (ACR > 300 mg/g creatinine). The last three diabetic groups were classified according to urinary albumin excretion. The first step in screening and diagnosis of DN is to measure albumin in a spot urine sample, which is collected either as the first urine in the morning or at random. This method is accurate, easy to perform, and recommended by American Diabetes Association guidelines.28 Diabetic patients were treated with oral antidiabetic therapy (sulfonylureas). Hypoglycemic medications were withheld on the morning of the study. All subjects underwent full history taking and clinical examination. Patients with a previous history of chronic disease of the kidneys, pancreas, or liver, with other known existing diseases, active inflammatory disease, or who were receiving insulin were excluded. The study was approved by the ethical committee of Faculty of Medicine, Umm AL-Qura University (UQU). Written and signed informed consent was obtained from all subjects before participating in the study.
Methods
After 12 hours of overnight fasting, venous blood samples were collected from controls and diabetic patients into three types of vacutainer tubes and processed as follows: first vacutainer tube with ethylenediaminetetraacetic acid (lavender cap) without centrifugation (whole blood sample) for assaying glycosylated hemoglobin; second tube with potassium oxalate and sodium fluoride (gray cap) for assaying of plasma glucose at once; and third tube without additive (red cap) in which blood was centrifuged at 4000 rpm for 10 minutes. Sera were rapidly separated and subdivided into aliquots. One aliquot of sera was used to measure lipid profile (cholesterol, triacylglycerol [TG], high-density lipoprotein cholesterol [HDL-C], and low-density lipoprotein cholesterol [LDL-C]), urea, and creatinine on the same day as the blood was collected. The remaining aliquots of sera were stored at −80 °C for insulin, cystatin C, NGAL, and RBP4 determinations. Hemolyzed samples were excluded. A first morning urine sample was collected from each subject into a sterile container and used for the determination of microalbumin and urinary ACR.
All the patients’ height, weight, and waist circumference (WC) were measured. Body mass index (BMI) was calculated as the ratio of the weight to the height (kg/m2). WC was taken with a tape measure horizontally at the umbilicus, midpoint between the lower rib margin and the iliac crest, while the subjects were in the standing position after normal expiration, and recorded to the nearest centimeter.29 Blood pressure was measured three times, and the average value was considered for data analysis. Any patient was considered hypertensive if already on antihypertensive medication or if average blood pressure was ≥140/90 mmHg, according to the study by Mancia.30
Fasting plasma glucose (FPG) concentration was determined by using glucose oxidase method according to Trinder.31 Blood HbA1c% was measured according to the method of Lahousen et al.32, using high-performance liquid chromatography (Variant™ II; Bio-Rad). Plasma insulin was determined using commercially available human enzyme-linked immunosorbent assay kits (BioSource Europe S.A.) according to Flier et al.33 The homeostasis model assessment of insulin resistance (HOMA-IR) was calculated according to the formula34: FPG level (mmol/L) × fasting plasma insulin level (mU/L)/22.5. IR was defined if HOMA-IR ≥2.5, according to the Japanese guideline for the treatment of diabetes.35 Lipid profile parameters were measured with commercial kits based on different techniques, purchased from Bio-Med and Egy Chem for the determinations of serum total cholesterol (TC),36 HDL-C,37 and TG.38 LDL-C was calculated as follows: LDL-C = TC – HDL-C – (TG/5), according to Friedewald et al.39, while atherogenic index was calculated from the ratio TC/HDL-C.40 Serum urea and creatinine levels were determined using an enzymatic colorimetric method.41,42 The biochemical assays were performed automatically by the Dimension® RxL Max integrated chemistry system (Siemens Instruments Inc.). GFR was estimated using the modification of diet in renal disease (MDRD) abbreviated equation: [GFR = 186 × (serum creatinine)−1.154 × (age)−0.203 × (0.742 if female)].43 Cystatin C was analyzed using commercially available Human Cystatin C Quantikine ELISA kits (Cat. No. DSCTC0; R&D Systems, Inc.).44 The multigent microalbumin assay (turbidimetric immunoassay) was used for the quantitative measurement of albumin in human urine on the ARCHITECT c8000TM System (Abbott Diagnostics). It is usual to compare the amount of albumin in the urine sample against its concentration of creatinine. This is termed the ACR expressed in milligrams per gram of creatinine. The use of ACR for these random samples might replace 24-hour urine collections, thus ACR may be a more useful diagnostic tool than microalbumin (μalb) itself.45 ACR was estimated by dividing the μalb concentration in mg/L over the urine creatinine concentration in grams per liter. ACR was thus expressed in mg/g creatinine. Serum NGAL was evaluated using a Quantikine kit, a commercially available, enzyme-linked immunosorbent assay (Cat. No. DLCN20; R&D Systems, Inc.).46 Serum RBP4 level was measured using a Quantikine Human RBP4 ELISA kit (Cat. No. DRB400; R&D Systems, Inc.).15
Statistical analysis
Results were expressed as mean ± SD. Differences between the groups were analyzed by one-way analysis of variance (ANOVA). Post hoc testing was performed by the Tukey’s test to compare the difference among the studied groups. The correlations between various variables were calculated using the Pearson correlation coefficient. A receiver operating characteristic (ROC) analysis was employed to calculate the area under the curve (AUC) and find the best cutoff values to maximize diagnostic specificity and, secondarily, sensitivity. P-values <0.05 were accepted as statistically significant. All statistical calculations were done using Statistical Package for the Social Sciences version 20 (SPSS Inc.).
Results
The ANOVA test showed no statistically significant differences were observed in terms of age, BMI, and WC (P > 0.05) between the studied groups. However, there was a statistically significant difference in the duration of diabetes among the micro- and macroalbuminuric diabetic groups (groups III and IV) as compared to group II. Moreover, the macroalbuminuric diabetic group (group IV) showed a significant difference in the duration of diabetes as compared to microalbuminuric diabetic group (group III; P < 0.05). A significant higher systolic and diastolic blood pressure levels were observed in normo-, micro-, and macroalbuminuric diabetic groups (groups II–IV) as compared to the control group (group I), as well as the macroalbuminuric diabetic group (group IV) showed a significant difference in systolic blood pressure levels as compared to the microalbuminuric diabetic group (group III; P < 0.05). The mean levels of FPG, serum insulin, HOMA-IR, and HbA1c% were significantly higher (P < 0.05) in normo-, micro-, and macroalbuminuric diabetic groups (groups II, III, and IV) as compared to the control group (group I), as well as the macroalbuminuric diabetic group (group IV) showed a significant difference in serum insulin and HOMA-IR as compared to the microalbuminuric diabetic group (group III; P < 0.05). In micro- and macroalbuminuric diabetic groups, the levels of serum TC, TG, and LDL-C were significantly higher (P < 0.05) than that observed in the control subjects and normoalbuminuric diabetic group, but there was a pronounced increase in TC and TG of the macroalbuminuric diabetic group when compared to the microalbuminuric diabetic group. TC/HDL-C ratio was significantly higher (P < 0.05) in the macroalbuminuric diabetic group than that observed in the normal control subjects and normoalbuminuric diabetic group. On the other hand, HDL-C level was significantly lower in micro- and macroalbuminuric diabetic groups than that in the control and normoalbuminuric groups, and the reduction was more pronounced in patients of macroalbuminuric diabetic group (P < 0.05) when compared with the microalbuminuric diabetic group (Table 1).
Table 1.
Comparison between the different studied groups regarding anthropometric and laboratory parameters.
| VARIABLES | GROUP I | GROUP II | GROUP III | GROUP IV |
|---|---|---|---|---|
| Number of subjects, n (M/F) | 50 (15/35) | 50 (17/33) | 50 (23/27) | 50 (19/31) |
| Age (years) | 45.1 ± 4.8 | 55.7 ± 6.2 | 53.4 ± 6.9 | 55.9 ± 5.3 |
| Duration of DM (years) | – | 3.9 ± 1.2 | 6.9 ± 2.14† | 12.4 ± 4.1†,‡ |
| BMI (kg/m2) | 25.9 ± 1.5 | 26.4 ± 2.2 | 27.3 ± 3.1 | 27.9 ± 3.3 |
| WC (cm) | 84.2 ± 6.8 | 85.4 ± 7.1 | 85.8 ± 6.9 | 86.0 ± 7.3 |
| Current smoking, n (%) | 2 (4%) | 1 (2%) | 3 (6%) | 5 (10%) |
| SBP (mmHg) | 121.2 ± 6.7 | 130.5 ± 12.1* | 143.2 ± 15.3*,† | 157.6 ± 17.7*,†,‡ |
| DBP (mmHg) | 77.9 ± 4.5 | 88.3 ± 8.9* | 94.2 ± 12.5*,† | 99.64 ± 14.8*,† |
| FPG (mmol/L) | 4.83 ± 0.53 | 10.9 ± 1.9* | 13.3 ± 3.2* | 16.5 ± 5.3*,† |
| Serum insulin (mU/L) | 8.0 ± 2.67 | 12.5 ± 4.37* | 15.6 ± 6.85* | 21.9 ± 9.11*,†,‡ |
| HOMA-IR | 1.47 ± 0.35 | 5.7 ± 1.22* | 8.89 ± 2.45* | 13.28 ± 4.91*,†,‡ |
| HbA1c (%) | 4.3 ± 0.83 | 8.6 ± 1.59* | 10.66 ± 3.72*,† | 12.16 ± 5.28*,† |
| TC (mg/dL) | 172.3 ± 17.1 | 175.6 ± 15.8 | 230.9 ± 16.3*,† | 284.4 ± 17.9*,†,‡ |
| TG (mg/dL) | 71.3 ± 10.65 | 78.1 ± 11.3 | 114.8 ± 11.2*,† | 171.8 ± 18.5*,†,‡ |
| HDL-C (mg/dL) | 50.5 ± 6.6 | 47.3 ± 8.0 | 37.3 ± 5.1*,† | 31.4 ± 4.7*,†,‡ |
| LDL-C (mg/dL) | 108.9 ± 20.6 | 117.0 ± 15.7 | 170.1 ± 17.3*,† | 220.3 ± 19.5*,† |
| Atherogenic index (TC/HDL-C) | 3.5 ± 0.35 | 4.5 ± 1.40 | 5.1 ± 1.9 | 8.9 ± 2.3*,† |
Notes: Values are represented as mean ± SD, group I (control), group II (diabetic patients with normoalbuminuria), group III (diabetic patients with microalbuminuria), and group IV (diabetic patients with macroalbuminuria).
Significantly different from controls (P < 0.05).
Significantly different from group II (P < 0.05).
Significantly different from group III (P < 0.05).
Abbreviations: DM, diabetes mellitus; BMI, body mass index; SBP, systolic blood pressure; DBP, diastolic blood pressure; FPG, fasting plasma glucose; HOMA-IR, homeostasis model assessment of insulin resistance; HbA1c, glycosylated hemoglobin; TC, total cholesterol; TG, triacylglycerol; HDL-C, high-density lipoprotein cholesterol; LDL-C, low-density lipoprotein cholesterol.
The results in Table 2 show that serum urea, creatinine, cystatin C, and GFR were not significantly different in diabetic patients with normoalbuminuria, when compared to the normal control subjects. On the other hand, GFR was significantly decreased (P < 0.05) in micro- and macroalbuminuric diabetic groups (groups II and IV) as compared to the control group (group I) and pronounced decrease in the macroalbuminuric diabetic group (group IV) as compared to the microalbuminuric group (group III). Serum urea, creatinine, and cystatin C were significantly increased in diabetic patients with micro- and macroalbuminuria as compared to normal control subjects and pronounced increase in the macroalbuminuric diabetic group (group IV) as compared to the microalbuminuric group (group III). Urinary microalbumin showed an insignificant change in diabetic patients with normoalbuminuria. In diabetic patients with micro- and macroalbuminuria, urinary microalbumin was markedly increased compared to normal control subjects. Urinary ACR was significantly increased in diabetic patients with microalbuminuria and strikingly increased in diabetic patients with macroalbuminuria compared to normal controls and diabetic patients with normoalbuminuria. On the other hand, the urinary microalbumin and ACR were significantly increased in diabetic patients with macroalbuminuria than in the microalbuminuric diabetic group.
Table 2.
Comparison between the different studied groups regarding serum urea, creatinine, cystatin C, GFR, urine microalbumin, and urinary ACR.
| VARIABLES | GROUP I | GROUP II | GROUP III | GROUP IV |
|---|---|---|---|---|
| Urea (mg/dL) | 30.1 ± 5.0 | 26.1 ± 4.1 | 48.2 ± 13.5*,† | 61.1 ± 13.7*,†,‡ |
| Creatinine(Cr.) (mg/dL) | 0.74 ± 0.16 | 0.82 ± 0.18 | 1.32 ± 0.36*,† | 1.89 ± 0.47*,†,‡ |
| Cystatin C (ng/mL) | 47.0 ± 10.2 | 48.4 ± 9.3 | 65.4 ± 11.8*,† | 73.8 ± 10.8*,†,‡ |
| GFR (MDRD) (mL/mim/1.73 m2) | 88.3 ± 13.2 | 87.5 ± 15.3 | 76.4 ± 8.4*,† | 66.3 ± 6.9*,†,‡ |
| Urine microalbumin (mg/L) | 14.5 ± 5.75 | 15.8 ± 6.38 | 82.8 ± 30.58*,† | 680.0 ± 82.73*,†,‡ |
| ACR (mg/g Cr.) | 11.4 ± 4.37 | 10.4 ± 5.1 | 66.94 ± 15.91*,† | 540.04 ± 66.48*,†,‡ |
Notes: Values are represented as mean ± SD, group I (control), group II (diabetic patients with normoalbuminuria), group III (diabetic patients with microalbuminuria), and group IV (diabetic patients with macroalbuminuria).
Significantly different from controls (P < 0.05).
Significantly different from group II (P < 0.05).
Significantly different from group III (P < 0.05).
The results in Table 3 show that serum NGAL and RBP4 levels were significantly increased in micro- and macroalbuminuric diabetic groups (groups III and IV) compared to controls and normoalbuminuric groups (groups I and II), but macroalbuminuric diabetic patients (group IV) showed a pronounced increase in the levels of NGAL and RBP4 when compared to the microalbuminuric diabetic group (group III; P < 0.05).
Table 3.
Comparison between the different studied groups regarding serum NGAL and RBP4.
| VARIABLES | GROUP I | GROUP II | GROUP III | GROUP IV |
|---|---|---|---|---|
| Serum NGAL (ng/mL) | 46.46 ± 8.56 | 55.6 ± 16.95 | 97.8 ± 10.97*,† | 131.0 ± 27.29*,†,‡ |
| Serum RBP4 (ng/mL) | 14.4 ± 1.95 | 17.5 ± 4.2 | 28.9 ± 8.26*,† | 39.4 ± 7.7*,†,‡ |
Notes: Values are represented as mean ± SD, group I (control), group II (diabetic patients with normoalbuminuria), group III (diabetic patients with microalbuminuria), and group IV (diabetic patients with macroalbuminuria).
Significantly different from controls (P < 0.05).
Significantly different from group II (P < 0.05).
Significantly different from group III (P < 0.05).
Abbreviations: NGAL, neutrophil gelatinase-associated lipocalin; RBP4, retinol-binding protein 4.
ROC curves were carried out to assess the diagnostic performance of NGAL and RBP4, whether they are more sensitive and specific than ACR, and which of them is more sensitive or more specific in the diagnosis of nephropathy.
Table 4 represents a comparison between the output data of ROC curves for NGAL, RBP4, and ACR. A cutoff value of NGAL >91.5 ng/mL was determined for discriminating between the diabetic patients with and without nephropathy. A cutoff value of RBP4 >24.5 ng/mL was determined for discriminating between the diabetic patients with and with-out nephropathy. Finally, a cutoff value of ACR >37.5 mg/g creatinine was determined for discriminating between the diabetic patients with and without nephropathy. A serum level of NGAL >91.5 ng/mL predicted the presence of nephropathy with 87% sensitivity, 74% specificity, and AUC = 0.0.881 with 82.7% accuracy; a serum level of RBP4 >24.5 ng/mL predicted the presence of nephropathy with 84% sensitivity, 90% specificity, and AUC = 0.912 with 86% accuracy; and urinary ACR of >37.5 mg/g creatinine predicted the presence of nephropathy with 89% sensitivity, 72% specificity, and AUC = 0.819 with 83.3% accuracy. These results illustrate that the RBP4 is more specific than NGAL in the early prediction of DN (Fig. 1).
Table 4.
Comparisons between characteristics of ROC curves for NGAL, RBP4, and ACR in patients with and without nephropathy.
| VARIABLES | CUTOFF | SPECIFICITY | SENSITIVITYA | PPV | NPV | ACCURACY | AUC |
|---|---|---|---|---|---|---|---|
| NGAL | >91.5 | 87% | 74% | 87% | 74% | 82.7% | 0.881 |
| RBP4 | >24.5 | 84% | 90% | 94% | 73.8% | 86% | 0.912 |
| ACR | >37.5 | 89% | 72% | 86.4% | 76.6% | 83.3% | 0.819 |
Abbreviations: PPV, positive predictive value; NPV, negative predictive value; accuracy = number of correct assessments/number of all assessments; AUC, area under the curve.
Figure 1.
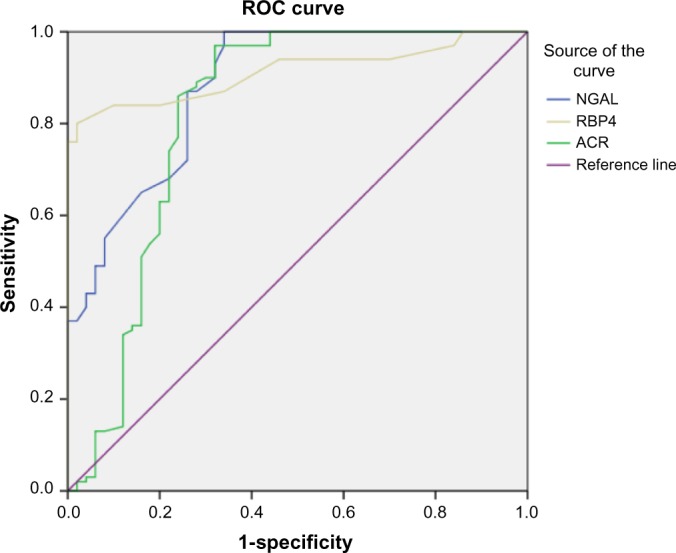
ROC curve analysis of NGAL, RBP4 and ACR in diabetic patients with nephropathy versus diabetic patients without nephropathy group. Diagonal segments are produced by ties. The AUC was 0.881 for NGAL, 0.912 for RBP4 and 0.819 for ACR respectively.
The results in Table 5 show the numbers of true negative (TN), false positive (FP), true positive (TP), and false negative (FN) for NGAL, RBP4, and ACR. At the cutoff value of NGAL >91.5 ng/mL, the number of TN = 37, FP = 13, TP = 87, and FN = 13. At the cutoff value of RBP4 > 24.5 ng/mL, the number of TN = 45, FP = 5, TP = 84, and FN = 16. At the cutoff value of ACR > 37.5 mg/g creatinine, the number of TN = 36, FP = 14, TP = 89, and FN = 11. The AUC was 0.881 for NGAL, 0.912 for RBP4 and 0.819 for ACR, respectively (Table 6).
Table 5.
TN, FP, TP, and FN for NGAL, RBP4 and ACR in patients with and without nephropathy.
| VARIABLES | CUT OFF | PATIENTS WITHOUT NEPHROPATHY (GROUP 2) | PATIENTSWITH NEPHROPATHY (GROUP 3 AND 4) | ||
|---|---|---|---|---|---|
| TN | FP | TP | FN | ||
| NGAL | 91.5 | 37 | 13 | 87 | 13 |
| RBP4 | 24.5 | 45 | 5 | 84 | 16 |
| ACR | 37.5 | 36 | 14 | 89 | 11 |
Abbreviations: TN, true negative; FP, false positive; TP, true positive; FN, false negative.
Table 6.
Area under the curve, standard error, and significance for NGAL, RBP4, and ACR variables of ROC curve in patients with nephropathy.
| TEST RESULT VARIABLE(S) | AREA | STD. ERRORa | ASYMPTOTIC SIG.b | ASYMPTOTIC 95% CONFIDENCE INTERVAL | |
|---|---|---|---|---|---|
| LOWER BOUND | UPPER BOUND | ||||
| NGAL | 0.881 | 0.030 | 0.0001 | 0.822 | 0.940 |
| RBP4 | 0.912 | 0.023 | 0.0001 | 0.867 | 0.958 |
| ACR | 0.819 | 0.046 | 0.0001 | 0.730 | 0.909 |
Notes: The test result variable(s): NGAL, RBP4, and ACR have at least one tie between the positive actual state group and the negative actual state group. Statistics may be biased.
Under the nonparametric assumption.
Null hypothesis: true area = 0.5.
Pearson correlation analyses revealed the relationships between NGAL and RBP4 and ACR variables studied in diabetic patients with nephropathy (Table 7). Pearson correlation analyses showed that NGAL concentration correlated significantly with RBP4 and ACR (r = 0.582, P = 0.0001; r = 0.502, P = 0.0001, respectively). RBP4 was positively correlated with ACR (r = 0.518, P = 0.0001).
Table 7.
Correlations of NGAL, RBP4 and ACR variables in diabetic patients with nephropathy.
| VARIABLES | NGAL | RBP4 | ACR | |
|---|---|---|---|---|
| NGAL | Pearson correlation | 1 | 0.502** | 0.582** |
| Sig. (2-tailed) | 0.0001 | 0.0001 | ||
| N | 100 | 100 | 100 | |
| RBP4 | Pearson correlation | 0.502** | 1 | 0.518** |
| Sig. (2-tailed) | 0.0001 | 0.0001 | ||
| N | 100 | 100 | 100 | |
| ACR | Pearson correlation | 0.582** | 0.518** | 1 |
| Sig. (2-tailed) | 0.0001 | 0.0001 | ||
| N | 100 | 100 | 100 | |
Note:
Correlation is significant at the 0.01 level (two-tailed).
Table 8 revealed the relationships between NGAL and RBP4 and other biochemical variables studied in diabetic patients with nephropathy. Pearson correlation analyses showed that NGAL and RBP4 concentrations significantly positively correlated with the duration of diabetes and systolic and diastolic blood pressure. NGAL and RBP4 concentrations correlated significantly with FPG (r = 0.468, P = 0.0001; r = 0.429, P = 0.0001, respectively). NGAL and RBP4 were positively correlated with HbA1c (r = 0.341, P = 0.001; r = 0.380, P = 0.0001 respectively). Also NGAL and RBP4 were significantly correlated with HOMA-IR (r = 0.582, P = 0.0001; r = 0.404, P = 0.0001, respectively). NGAL and RBP4 also showed significant positive correlations with ACR and TG (r = 0.580, P = 0.0001 for NGAL to ACR, r = 0.545, P = 0.0001 for NGAL to TG; r = 0.518, P = 0.0001 RBP4 to ACR, r = 0.513, P = 0.0001 for RBP4 to TG). NGAL and RBP4 were negatively correlated with GFR (r = −0.415, P = 0.0001; r = −0.306, P = 0.002, respectively).
Table 8.
Significant correlations of NGAL, RBP4, and other biochemical variables in diabetic patients with nephropathy.
| VARIABLES | r | *P-VALUE |
|---|---|---|
| NGAL – FPG | 0.468 | 0.0001 |
| NGAL – blood HbA1c | 0.341 | 0.001 |
| NGAL – HOMA-IR | 0.582 | 0.0001 |
| NGAL – ACR | 0.580 | 0.0001 |
| NGAL – GFR | −0.415 | 0.0001 |
| NGAL – serum triacylglycerol | 0.545 | 0.0001 |
| NGAL – SPB | 0.663 | 0.037 |
| NGAL–DPB | 0.651 | 0.042 |
| NGAL – Duration of DM | 0.763 | 0.01 |
| RBP4 – FPG | 0.429 | 0.0001 |
| RBP4 – blood HbA1c | 0.380 | 0.0001 |
| RBP4 – HOMA-IR | 0.404 | 0.0001 |
| RBP4 – ACR | 0.518 | 0.0001 |
| RBP4 – GFR | –0.306 | 0.002 |
| RBP4 – serum triacylglycerol | 0.513 | 0.0001 |
| RBP4 – SPB | 0.725 | 0.018 |
| RBP4 – DBP | 0.795 | 0.006 |
| RBP4 – Duration of DM. | 0.749 | 0.013 |
Notes: r, Pearson correlation coefficient.
P-value: correlation is significant at the 0.05 level.
Discussion
DN is currently the leading cause of end-stage renal disease. It is also one of the major significant long-term complications in terms of morbidity and mortality for diabetic patients.47 The aim of this study was to evaluate the diagnostic value of serum NGAL and RBP4 as biomarkers for early detection of nephropathy in type 2 diabetic patients. No significant difference was observed between the ages of the studied groups. The duration of diabetes in the microalbuminuric diabetic group was significantly increased compared to the normoalbuminuric diabetic group, and this difference was even more pronounced in the macroalbuminuric group. In the current study, the levels of FPG and HbA1c in the microalbuminuric diabetic group were significantly increased compared to diabetic normoalbuminuric and control groups. These findings are in agreement with the previous studies, which have suggested that hyperglycemia is the driving force for the development of DN.48 Elevated HbA1c was associated with the development of microangiopathy in diabetes. Perhaps this is because HbA1c has a special affinity for oxygen, causing tissue anoxia and contributing to microangiopathy.49 Poor glycemic control may have a significant role in the progression of DN.50
Our findings showed that increased HOMA-IR in type 2 diabetic patients with microalbuminuria and macroalbuminuria was highly significant compared with control and normoalbuminuric diabetic groups. These findings are consistent with the study by Svensson and Eriksson,51 who suggest that IR can occur in the early stages of renal disease and can be detected early at the stage of microalbuminuria. As DN progress, IR may be accelerating the decline in renal function toward end-stage renal disease.
IR is believed to be manifest at the cellular level via postreceptor defects in insulin signaling, but the underlying mechanisms still remain unclear. Possible mechanisms include downregulation, deficiencies or genetic polymorphisms of tyrosine phosphorylation of the insulin receptor, IRS proteins or PIP-3 kinase, or may involve abnormalities of GLUT 4 function.52 IR may drive the overproduction of very LDL-C and contribute to hypertriglyceridemia.53 Triglyceride-rich apolipoprotein B-containing lipoproteins clearly promote the progression of renal insufficiency. High triglyceride levels are a risk factor for proteinuria development.54
In the current study, lipid patterns showed that the mean serum levels of TC, TG, and LDL-C were significantly higher in micro- and macroalbuminuric diabetic groups than in the control and normoalbuminuric diabetic groups. On the other hand, the mean serum level of HDL-C was significantly lower in micro- and macroalbuminuric diabetic groups than in the control and normoalbuminuric groups, and the reduction was more pronounced in patients with macroalbuminuric diabetic group when compared with microalbuminuric diabetic group. TC/HDL-C ratio was significantly higher in the macroalbuminuric diabetic group than that observed in normal control subjects and normoalbuminuric diabetic group. These results are in agreement with Bonnet and Cooper,55 who stated that DN is associated with an altered lipid metabolism characterized by elevated triglyceride-rich lipoproteins even in the early stages of the renal disease. Also in agreement with Jacobs et al.56, who concluded that the prevalence of dyslipidemia was high in type 2 diabetic patients in comparison to healthy subjects. In addition, Cooper et al stated that dyslipidemia is highly observed in type 2 diabetic patients.57 Tseng evaluated the lipid abnormalities associated with different stages of albuminuria in type 2 diabetic patients and found that apolipoproteins and lipoproteins increased at the stages of microalbuminuria and macroalbuminuria, respectively.58 However, cholesterol and triglycerides increased significantly throughout the three stages of albuminuria. Shoji et al indicated that disruptions in lipid metabolism may promote glomerular and tubulointerstitial injury.59
In our study, serum cystatin C was significantly elevated in diabetic patients with nephropathy. Our findings agree with the results from previous studies.7,60 These findings are in contrast to one previous study, in which increased serum cystatin level was found to be significant in overt nephropathy but not in early nephropathy.60 The development of DN is a gradual process that mainly starts with progression from normal albuminuria to microalbuminuria for 5–10 years.61 In type 2 diabetic patients with microalbuminuria, the elevated levels of urinary albumin and ACR, together with the reduced levels of GFR, fulfill the characteristics of microalbuminuria as reported by Abid et al.62 This agrees with our study, in which there was a reduction in GFR in the microalbuminuric and macroalbuminuric diabetic groups compared to the control and normoalbuminuric diabetic groups, and ACR was increased in the microalbuminuric and macroalbuminuric diabetic groups compared to control and normoalbuminuric diabetic groups.
NGAL is a 25-kDa molecule known to be hyperproduced in kidney tubules within a few hours after damaging experimental stimuli. Tubular secretion of NGAL correlates with the severity of chronic renal impairment, as in autosomal dominant polycystic kidney disease or glomerulonephritis.63 In this study, serum NGAL was significantly higher in microalbuminuric and macroalbuminuric diabetic groups compared to the control and normoalbuminuric diabetic groups. Also, serum NGAL positively correlated to the ACR and HbA1c. In our findings, NGAL was higher in diabetic patients with nephropathy compared to controls, indicating that tubular injury occurs early and perhaps before albumin excretion in patients with DN. In addition, NGAL increased further when the injury progressed to become DN.
In a cohort of 56 patients with T2DM, Jiao et al demonstrated increased levels of NGAL in both serum and urine, which correlated with the severity of renal damage.64 Being elevated in serum and urine, even before albumin appears in urine, NGAL has been reported as a useful noninvasive tool for the evaluation of renal involvement in diabetes, accelerating the early diagnosis of DN.65 Nielsen et al reported that elevated urine neutrophil gelatinase-associated lipocalin (uNGAL) in type 1 diabetic patients with or without albuminuria indicates tubular damage at an early stage.66 Furthermore, NGAL showed a good correlation with GFR in diabetic patients. According to our results, serum NGAL showed positive correlation with albuminuria and negative correlation with GFR. Similar findings were reported by Yang et al.67
In our study, serum NGAL was significantly increased in diabetic patients with micro- and macroalbuminuria when compared with the control group, suggesting that serum NGAL as a marker of tubular injury precedes the appearance of microalbuminuria as a marker of glomerular injury. Bolignano et al found that serum and uNGAL were significantly elevated in diabetic patients compared to the control group and that NGAL levels were elevated in diabetic patients without early signs of glomerular damage.13
In our study, NAGL was higher in T2DM patients with micro- and macroalbuminuria as compared to controls. This indicates that tubular injury (proximal and distal) occurs early and perhaps before albumin excretion in patients with emerging DN. Notably, serum NGAL showed a relationship with the progression of DN where serum NGAL was positively correlated with urinary albumin creatinine ratio and negatively correlated with GFR, thus, NGAL changes with the progression of albuminuria from absent to severe.
Nauta et al demonstrated that NGAL is 1.5-fold significantly elevated in diabetic patients with normoalbuminuria compared to nondiabetic control group.7 Lacquaniti et al.20 stated that NGAL increases in patients with type 1 diabetes even before diagnosis of microalbuminuria representing an early biomarker of normoalbuminuric DN. NGAL measurement could be useful for the evaluation of early renal involvement in the course of diabetes. Zachwieja et al.68 showed that serum and urine NGAL were elevated in diabetic children without albuminuria, and normoalbuminuria does not exclude DN that is defined as increased serum and urine NGAL concentration. NGAL measurement can be more sensitive than microalbumin and may become a useful tool for evaluating renal involvement in diabetic children. In our study, serum NGAL showed a significant positive correlation with the duration of diabetes, HbA1c, and urinary ACR, while it showed a significant negative correlation with GFR. Fu et al.69 found a significant inverse correlation between serum NGAL and GFR, and a positive correlation with albuminuria, which is consistent with our findings. Furthermore, Woo et al.70 found an inverse correlation between serum NGAL and GFR.
The present study demonstrated that serum RBP4 level was significantly higher in type 2 diabetic patients with nephropathy compared with controls. A similar study was reported by Raila et al.26 They noted that serum RBP4 was increased in patients with microalbuminuria, an early stage of DN. Similarly, serum RBP4 level was elevated according to the progression of clinical stage of DN.71 There were positive correlations between the serum RBP4 level and HOMA-IR. This is in accordance with the findings of Graham et al.72
Serum RBP4 concentration was positively correlated with TG in the current study, which is consistent with the findings of Xu et al.73 Wu et al found that a lipid-lowering drug greatly decreased RBP4 mRNA levels in adipose tissue, suggesting a role for RBP4 in lipid metabolism.74 RBP4 is the primary carrier for vitamin A (retinol) in plasma and synthesized by hepatocytes. RBP4 expression is also present in extrahepatic tissues, including skeletal muscles and white adipose tissues.75 It is known that the kidneys play a role in the maintenance of whole body homeostasis,76 which is regulated by GFR and subsequent reabsorption of RBP4 into the proximal tubule.
The present study reported inverse correlations between RBP4 and GFR. These results are compatible with the previous studies.71,77 A decrease in GFR could lead to accumulation of RBP4 in the systemic circulation. Also, a protein complex of RBP4 bound to transthyretin homotetramer in the systemic circulation may reduce clearance of RBP4.78 Moreover, an increase in serum RBP4 concentration resulted in increased risk of hypertension, dyslipidemia, microalbuminuria, and impaired GFR.79 ROC curves were carried out to assess the diagnostic performance of NGAL and RBP4 and whether they are more sensitive and specific than ACR. It was found that RBP4 is more specific than NGAL in the early detection of DN.
The kidneys play an important role in the recycling of RBP4 since RBP4 catabolism is disturbed in chronic kidney disease (CKD) patients. The alterations in RBP4 metabolism during CKD are of interest in relation to T2DM since T2DM patients are exposed to increased oxidative stress which has been reported to be linked to endothelial dysfunction. It is known that T2DM patients often suffer from kidney dysfunction, and therefore, the RBP4 may further enhance oxidative stress through their action on polymorphonuclear leukocytes.80
The clinical course of many renal diseases is highly variable. One of the major challenges in deciding which treatment approach is best suited for a patient and also in the development of new treatments is the lack of markers able to identify and stratify patients with stable versus progressive disease. Unlike other biomarkers, RBP4 is currently the most sensitive functional biomarker of proximal tubule. RBP4 is filtered at the glomerulus and completely reabsorbed in the proximal tubule. In addition, RBP4 was a risk factor for renal impairment in type 2 diabetic patients and may therefore be an important biomarker in detecting kidney function prior to the commonly used markers.
An increase in serum RBP4 concentration is more likely to be caused by the presence of impaired kidney function rather than T2DM,24 thus resulting in increased risk of renal insufficiency (microalbuminuria and impaired GFR). Therefore, circulating RBP4 may be a useful marker of kidney dysfunction in T2DM. In conclusion, microalbuminuria has generally been considered as the earliest marker of DN development and is often associated with established significant glomerular damage. However, recent studies have shown that microalbuminuria does not necessarily reflect permanent renal impairment. In addition, several lines of evidence suggest that early structural damage in both glomerular and tubular structures may be present in normoalbuminuric subjects. Indeed, DN-related biomarkers are required for early diagnosis of DN. RBP4 marker may serve as a tool to follow-up clinical monitoring of the development and progression of DN.
Ethical Considerations
All procedures performed in the studies involving human participants were in accordance with the ethical standards of ethical committee of Faculty of Medicine, Umm AL-Qura University (UQU) and with the 1964 Declaration of Helsinki and its later amendments or comparable ethical standards. Written and signed informed consent was obtained from all subjects before participating in the study.
Footnotes
ACADEMIC EDITOR: Karen Pulford, Editor in Chief
PEER REVIEW: Four peer reviewers contributed to the peer review report. Reviewers’ reports totaled 6192 words, excluding any confidential comments to the academic editor.
FUNDING: The authors would like to thank Institute of Scientific Research and Revival of Islamic Heritage at Umm Al-Qura University (project # 43509030) for financial support. The authors confirm that the funder had no influence over the study design, content of the article, or selection of this journal.
COMPETING INTERESTS: Authors disclose no potential conflicts of interest.
Paper subject to independent expert blind peer review. All editorial decisions made by independent academic editor. Upon submission manuscript was subject to anti-plagiarism scanning. Prior to publication all authors have given signed confirmation of agreement to article publication and compliance with all applicable ethical and legal requirements, including the accuracy of author and contributor information, disclosure of competing interests and funding sources, compliance with ethical requirements relating to human and animal study participants, and compliance with any copyright requirements of third parties. This journal is a member of the Committee on Publication Ethics (COPE).
Author Contributions
Conceived and designed the experiments, worked on the initial review outline, did the background literature search, prepared the figure and tables, and wrote the manuscript: Mohamed H. Mahfouz. Developed the structure and arguments for the paper, participated in the design of the study, agreed with the results, and made critical revisions: Adel M. Assiri. Reviewed the results, analyzed the data statistically, assisted in establishing the review’s outline, developed subjects’ consents as well as wrote aspects, reviewed and edited the manuscript: Mohammed H. Mukhtar. All the authors reviewed and approved the final manuscript version.
REFERENCES
- 1.de Zeeuw D, Ramjit D, Zhang Z, et al. Renal risk and renoprotection among ethnic groups with type 2 diabetic nephropathy: a post hoc analysis of RENAAL. Kidney Int. 2006;69(9):1675–82. doi: 10.1038/sj.ki.5000326. [DOI] [PubMed] [Google Scholar]
- 2.Haffner SM, Lehto S, Rönnemaa T, et al. Mortality from coronary heart disease in subjects with type 2 diabetes and in nondiabetic subjects with and without prior myocardial infarction. N Engl J Med. 1998;339:229–34. doi: 10.1056/NEJM199807233390404. [DOI] [PubMed] [Google Scholar]
- 3.Tonelli M, Muntner P, Lloyd A, et al. Alberta kidney disease network. Risk of coronary events in people with chronic kidney disease compared with those with diabetes: a population-level cohort study. Lancet. 2012;380:807–14. doi: 10.1016/S0140-6736(12)60572-8. [DOI] [PubMed] [Google Scholar]
- 4.Shaw JE, Sicree RA, Zimmet PZ. Global estimates of the prevalence of diabetes for 2010 and 2030. Diabetes Res Clin Pract. 2010;87:4–14. doi: 10.1016/j.diabres.2009.10.007. [DOI] [PubMed] [Google Scholar]
- 5.Alwakeel JS, Sulimani R, AlAsaad H, et al. Diabetes complications in 1952 type 2 diabetes mellitus patients managed in a single institution in Saudi Arabia. Ann Saudi Med. 2008;28(4):260–6. doi: 10.5144/0256-4947.2008.260. [DOI] [PMC free article] [PubMed] [Google Scholar]
- 6.Moresco RN, Sangoi MB, De Carvalho JA, et al. Diabetic nephropathy: traditional to proteomic markers. Clin Chim Acta. 2013;5(421):17–30. doi: 10.1016/j.cca.2013.02.019. [DOI] [PubMed] [Google Scholar]
- 7.Nauta FL, Boertien WE, Bakker SJ, et al. Glomerular and tubular damage markers are elevated in patients with diabetes. Diabetes Care. 2011;34(4):975–81. doi: 10.2337/dc10-1545. [DOI] [PMC free article] [PubMed] [Google Scholar]
- 8.Chae HW, Shin JI, Kwon AR, et al. Spot urine albumin to creatinine ratio and serum cystatin C are effective for detection of diabetic nephropathy in childhood diabetic patients. J Korean Med Sci. 2012;27:784–7. doi: 10.3346/jkms.2012.27.7.784. [DOI] [PMC free article] [PubMed] [Google Scholar]
- 9.Nielsen SE, Reinhard H, Zdunek D, et al. Tubular markers are associated with decline in kidney function in proteinuric type 2 diabetic patients. Diabetes Res Clin Pract. 2012;97:71–6. doi: 10.1016/j.diabres.2012.02.007. [DOI] [PubMed] [Google Scholar]
- 10.Bennett M, Dent CL, Ma Q, et al. Urine NGAL predicts severity of acute kidney injury after cardiac surgery: a prospective study. Clin J Am Soc Nephrol. 2008;3:665–73. doi: 10.2215/CJN.04010907. [DOI] [PMC free article] [PubMed] [Google Scholar]
- 11.Mori K, Nakao K. Neutrophil gelatinase-associated lipocalin as the real-time indicator of active kidney damage. Kidney Int. 2007;71:967–70. doi: 10.1038/sj.ki.5002165. [DOI] [PubMed] [Google Scholar]
- 12.Smith ER, Lee D, Cai MM, et al. Urinary neutrophil gelatinase-associated lipocalin may aid prediction of renal decline in patients with non-proteinuric Stages 3 and 4 chronic kidney disease (CKD) Nephrol Dial Transplant. 2013;28(6):1569–79. doi: 10.1093/ndt/gfs586. [DOI] [PubMed] [Google Scholar]
- 13.Bolignano D, Lacquaniti A, Coppolino G, et al. Neutrophil gelatinase-associated lipocalin (NGAL) and progression of chronic kidney disease. Clin J Am Soc Nephrol. 2009;4:337–44. doi: 10.2215/CJN.03530708. [DOI] [PMC free article] [PubMed] [Google Scholar]
- 14.Lopez-Giacoman S, Madero M. Biomarkers in chronic kidney disease, from kidney function to kidney damage. World J Nephrol. 2015;4(1):57–73. doi: 10.5527/wjn.v4.i1.57. [DOI] [PMC free article] [PubMed] [Google Scholar]
- 15.Yang Q, Graham TE, Mody N, et al. Serum retinol binding protein 4 contributes to insulin resistance in obesity and type 2 diabetes. Nature. 2005;436(7049):356–62. doi: 10.1038/nature03711. [DOI] [PubMed] [Google Scholar]
- 16.Comucci EB, Vasques AC, Geloneze B, et al. Serum levels of retinol binding protein 4 in women with different levels of adiposity and glucose tolerance. Arq Bras Endocrinol Metabol. 2014;58(7):709–14. doi: 10.1590/0004-2730000002431. [DOI] [PubMed] [Google Scholar]
- 17.Christou GA, Tselepis AD, Kiortsis DN. The metabolic role of retinol binding protein 4: an update. Horm Metab Res. 2012;44(1):6–14. doi: 10.1055/s-0031-1295491. [DOI] [PubMed] [Google Scholar]
- 18.Lee DC, Lee JW, Im JA. Association of serum retinol binding protein 4 and insulin resistance in apparently healthy adolescents. Metabolism. 2007;56:327–31. doi: 10.1016/j.metabol.2006.10.011. [DOI] [PubMed] [Google Scholar]
- 19.Gavi S, Stuart LM, Kelly P, et al. Retinol-binding protein 4 is associated with insulin resistance and body fat distribution in nonobese subjects without type 2 diabetes. J Clin Endocrinol Metab. 2007;92:1886–90. doi: 10.1210/jc.2006-1815. [DOI] [PubMed] [Google Scholar]
- 20.Lacquaniti A, Donato V, Pintaudi B, et al. “Normoalbuminuric” diabetic nephropathy: tubular damage and NGA. Acta Diabetol. 2013;50:935–42. doi: 10.1007/s00592-013-0485-7. [DOI] [PubMed] [Google Scholar]
- 21.Vitkova M, Klimcakova E, Kovacikova M, et al. Plasma levels and adipose tissue messenger ribonucleic acid expression of retinol-binding protein 4 are reduced during calorie restriction in obese subjects but are not related to diet-induced changes in insulin sensitivity. J Clin Endocrinol Metab. 2007;92(6):2330–5. doi: 10.1210/jc.2006-2668. [DOI] [PubMed] [Google Scholar]
- 22.Galanti LM, Jamart J, Dell’omo J, et al. Comparison of urinary excretion of albumin, alpha 1-microglobulin and retinol-binding protein in diabetic patients. Diabetes Metab. 1996;22(5):324–30. [PubMed] [Google Scholar]
- 23.Hong CY, Chia KS, Ling SL. Urinary protein excretion in type 2 diabetes with complications. J Diabetes Complications. 2000;14(5):259–65. doi: 10.1016/s1056-8727(00)00119-7. [DOI] [PubMed] [Google Scholar]
- 24.Chu CH, Lam HC, Lee JK, et al. Elevated serum retinol-binding protein 4 concentrations are associated with chronic kidney disease but not with the higher carotid intima-media thickness in type 2 diabetic subjects. Endocr J. 2011;58(10):841–7. doi: 10.1507/endocrj.ej11-0028. [DOI] [PubMed] [Google Scholar]
- 25.Ziegelmeier M, Bachmann A, Seeger J, et al. Serum levels of adipokine retinol-binding protein-4 in relation to renal function. Diabetes Care. 2007;30:2588–92. doi: 10.2337/dc07-0275. [DOI] [PubMed] [Google Scholar]
- 26.Raila J, Henze A, Spranger J, et al. Microalbuminuria is a major determinant of elevated plasma retinol-binding protein 4 in type 2 diabetic patients. Kidney Int. 2007;72(4):505–11. doi: 10.1038/sj.ki.5002372. [DOI] [PubMed] [Google Scholar]
- 27.McTernan PG, Kumar S. Retinol binding protein 4 and pathogenesis of diabetes. J Clin Endocrinol Metab. 2007;92:2430–2. doi: 10.1210/jc.2007-1054. [DOI] [PubMed] [Google Scholar]
- 28.American Diabetes Association Nephropathy in diabetes (position statement) Diabetes Care. 2004;27(Suppl 1):S79–83. doi: 10.2337/diacare.27.2007.s79. [DOI] [PubMed] [Google Scholar]
- 29.WHO Expert Consultation Appropriate body-mass index for Asian populations and its implications for policy and intervention strategies. Lancet. 2004;363(9403):157–63. doi: 10.1016/S0140-6736(03)15268-3. [DOI] [PubMed] [Google Scholar]
- 30.Mancia G. Hypertension: strengths and limitations of the JNC 8 hypertension guidelines. Nat Rev Cardiol. 2014;11(4):189–90. doi: 10.1038/nrcardio.2014.12. [DOI] [PubMed] [Google Scholar]
- 31.Trinder P. Determination of glucose in blood using glucose oxidase with an alternative oxygen acceptor. Ann Clin Biochem. 1969;6:24–7. [Google Scholar]
- 32.Lahousen T, Roller RE, Lipp RW, et al. Silent haemoglobin variants and determination of HbA(1c) with the HPLC Bio-Rad Variant II. J Clin Pathol. 2002;55(9):699–703. doi: 10.1136/jcp.55.9.699. [DOI] [PMC free article] [PubMed] [Google Scholar]
- 33.Flier JS, Kahn CR, Roth J. Receptors anti-receptor antibodies and mechanisms of insulin resistance. N Engl J Med. 1979;300(8):413–9. doi: 10.1056/NEJM197902223000808. [DOI] [PubMed] [Google Scholar]
- 34.Matthews DR, Hosker JP, Rudenski AS, et al. Homeostasis model assessment: insulin resistance and beta-cell function from fasting plasma glucose and insulin concentrations in man. Diabetologia. 1985;28(7):412–9. doi: 10.1007/BF00280883. [DOI] [PubMed] [Google Scholar]
- 35.Hara K, Horikoshi M, Yamauchi T, et al. Measurement of the high-molecular weight form of adiponectin in plasma is useful for the prediction of insulin resistance and metabolic syndrome. Diabetes Care. 2006;29:1357–62. doi: 10.2337/dc05-1801. [DOI] [PubMed] [Google Scholar]
- 36.Allain CC, Poon LS, Chan CS, et al. Enzymatic determination of total serum cholesterol. Clin Chem. 1974;20:470–5. [PubMed] [Google Scholar]
- 37.Lopes-Virella MF, Stone PG, Ellis S, et al. Cholesterol determination in high-density lipoproteins separated by three different methods. Clin Chem. 1977;23(5):882–4. [PubMed] [Google Scholar]
- 38.Fassati P, Prencipe L. Determination of serum triglycerides. Clin Chem. 1982;19:2077–80. [PubMed] [Google Scholar]
- 39.Friedewald WT, Levy RI, Fredrickson DS. Estimation of the concentration of low-density lipoprotein cholesterol in plasma, without use of the preparative ultracentrifuge. Clin Chem. 1972;18(6):499–502. [PubMed] [Google Scholar]
- 40.Wilson PW, Garrison RJ, Castelli WP, et al. Prevalence of coronary heart disease in the Framingham off spring study: role of lipoprotein cholesterols. Am J Cardiol. 1980;46:649–54. doi: 10.1016/0002-9149(80)90516-0. [DOI] [PubMed] [Google Scholar]
- 41.Marsh WH, Fingerhut B, Miller H. Automated and manual direct methods for the determination of blood urea. Clin Chem. 1965;11:624–7. [PubMed] [Google Scholar]
- 42.Vasiliades J. Reaction of alkaline sodium picrate with creatinine: kinetics and mechanism of the mono-creatinine picric acid complex. Clin Chem. 1976;22(10):1664–71. [PubMed] [Google Scholar]
- 43.Levey AS, Coresh J, Greene T, et al. Using standardized serum creatinine values in the modification of diet in renal disease study equation for estimating glomerular filtration rate. Ann Intern Med. 2006;145:247–54. doi: 10.7326/0003-4819-145-4-200608150-00004. [DOI] [PubMed] [Google Scholar]
- 44.Tian S, Kusano E, Ohara T, et al. Cystatin C measurement and its practical use in patients with various renal diseases. Clin Nephrol. 1997;48:104–8. [PubMed] [Google Scholar]
- 45.Justesen T, Petersen J, Ekbom P, et al. Albumin-to-creatinine ratio in random urine samples might replace 24-hr urine collections in screening for micro- and macroalbuminuria in pregnant woman with type 1 diabetes. Diabetes Care. 2006;29(4):924–5. doi: 10.2337/diacare.29.04.06.dc06-1555. [DOI] [PubMed] [Google Scholar]
- 46.Kjeldsen L, Cowland JB, Borregaard N. Human neutrophil gelatinase- associated lipocalin and homologous proteins in rat and mouse. Biochim Biophys Acta. 2000;1482(1–2):272–83. doi: 10.1016/s0167-4838(00)00152-7. [DOI] [PubMed] [Google Scholar]
- 47.Nichols GA, Vupputuri S, Lau H. Medical care costs associated with progression of diabetic nephropathy. Diabetes Care. 2011;34:2374–8. doi: 10.2337/dc11-0475. [DOI] [PMC free article] [PubMed] [Google Scholar]
- 48.Sun YM, Su Y, Li J, et al. Recent advances in understanding the biochemical and molecular mechanism of diabetic nephropathy. Biochem Biophys Res Commun. 2013;433(4):359–61. doi: 10.1016/j.bbrc.2013.02.120. [DOI] [PubMed] [Google Scholar]
- 49.Kundu D, Roy A, Mandal T, et al. Relation of microalbuminuria to glycosylated hemoglobin and duration of type 2 diabetes. Niger J Clin Pract. 2013;16(2):216–20. doi: 10.4103/1119-3077.110159. [DOI] [PubMed] [Google Scholar]
- 50.Zakkerkish M, Shahbazian HB, Shahbazian H, et al. Albuminuria and its correlates in type 2 diabetic patients. Iran J Kidney Dis. 2013;7(4):268–76. [PubMed] [Google Scholar]
- 51.Svensson M, Eriksson JW. Insulin resistance in diabetic nephropathy – cause or consequence? Diabetes Metab Res Rev. 2006;22(5):401–10. doi: 10.1002/dmrr.648. [DOI] [PubMed] [Google Scholar]
- 52.Wheatcroft SB, Williams IL, Shah AM, et al. Pathophysiological implications of insulin resistance on vascular endothelial function. Diabet Med. 2003;20:255–68. doi: 10.1046/j.1464-5491.2003.00869.x. [DOI] [PubMed] [Google Scholar]
- 53.Tsimihodimos V, Dounousi E, Siamopoulos KC. Dyslipidemia in chronic kidney disease: an approach to pathogenesis and treatment. Am J Nephrol. 2008;28(6):958–73. doi: 10.1159/000144024. [DOI] [PubMed] [Google Scholar]
- 54.Tozawa M, Iseki K, Iseki C, et al. Triglyceride, but not total cholesterol or low-density lipoprotein cholesterol levels, predict development of proteinuria. Kidney Int. 2002;62(5):1743–9. doi: 10.1046/j.1523-1755.2002.00626.x. [DOI] [PubMed] [Google Scholar]
- 55.Bonnet F, Cooper ME. Potential influence of lipids in diabetic nephropathy: insights from experimental data and clinical studies. Diabetes Metab. 2000;26(4):254–64. [PubMed] [Google Scholar]
- 56.Jacobs MJ, Kleisli T, Pio JR, et al. Prevalence and control of dyslipidemia among persons with diabetes in the United States. Diabetes Res Clin Pract. 2005;70(3):263–9. doi: 10.1016/j.diabres.2005.03.032. [DOI] [PubMed] [Google Scholar]
- 57.Cooper MB, Tan KC, Hales CN, et al. Postprandial lipid metabolism and beta-cell function in non-insulin-dependent (type 2) diabetes mellitus after a mixed meal with a high fat content. Diabet Med. 1996;13(9):816–27. doi: 10.1002/(SICI)1096-9136(199609)13:9<816::AID-DIA183>3.0.CO;2-L. [DOI] [PubMed] [Google Scholar]
- 58.Tseng CH. Differential dyslipidemia associated with albuminuria in type 2 diabetic patients in Taiwan. Clin Biochem. 2009;42(10–1):1019–24. doi: 10.1016/j.clinbiochem.2009.03.013. [DOI] [PubMed] [Google Scholar]
- 59.Shoji T, Emoto M, Kawagishi T, et al. Atherogenic lipoprotein changes in diabetic nephropathy. Atherosclerosis. 2001;156(2):425–33. doi: 10.1016/s0021-9150(00)00673-0. [DOI] [PubMed] [Google Scholar]
- 60.Ogawa Y, Goto T, Tamasawa N, et al. Serum cystatin C in diabetic patients: not only an indicator for renal dysfunction in patients with overt nephropathy but also a predictor for cardiovascular events in patients without nephropathy. Diabetes Res Clin Pract. 2008;79(2):357–61. doi: 10.1016/j.diabres.2007.09.016. [DOI] [PubMed] [Google Scholar]
- 61.Batlle D. Clinical and cellular markers of diabetic nephropathy. Kidney Int. 2003;63(6):2319–30. doi: 10.1046/j.1523-1755.2003.00053.x. [DOI] [PubMed] [Google Scholar]
- 62.Abid O, Sun Q, Sugimoto K, et al. Predictive value of microalbuminuria in medical ICU patients: results of a pilot study. Chest. 2001;120(6):1984–8. doi: 10.1378/chest.120.6.1984. [DOI] [PubMed] [Google Scholar]
- 63.Papadopoulou-Marketou N, Skevaki C, Kosteria I, et al. NGAL and cystatin C: two possible early markers of diabetic nephropathy in young patients with type 1 diabetes mellitus: one year follow up. Hormones (Athens) 2015;14(2):232–40. doi: 10.14310/horm.2002.1520. [DOI] [PubMed] [Google Scholar]
- 64.Jiao LY, Guo Q, Song Z, et al. Diagnostic value of urinary neutrophil gelatinase associated lipocalin and serum cystatin C on diabetic nephropathy. J Xinxiang Med Coll. 2011;5:21. [Google Scholar]
- 65.Basturk T, Altuntaş Y, Kurklu A, et al. Urinary N-acetyl B glucosaminidase as an earlier marker of diabetic nephropathy and influence of low-dose perindopril/indapamide combination. Ren Fail. 2006;28(2):125–8. doi: 10.1080/08860220500530510. [DOI] [PubMed] [Google Scholar]
- 66.Nielsen SE, Schjoedt KJ, Astrup AS, et al. Neutrophil gelatinase-associated lipocalin (NGAL) and kidney injury molecule 1 (KIM1) in patients with diabetic nephropathy: a cross-sectional study and the effects of lisinopril. Diabet Med. 2010;27(10):1144–50. doi: 10.1111/j.1464-5491.2010.03083.x. [DOI] [PubMed] [Google Scholar]
- 67.Yang YH, He XJ, Chen SR, et al. Changes of serum and urine neutrophil gelatinase-associated lipocalin in type-2 diabetic patients with nephropathy: one year observational follow-up study. Endocrine. 2009;36(1):45–51. doi: 10.1007/s12020-009-9187-x. [DOI] [PubMed] [Google Scholar]
- 68.Zachwieja J, Soltysiak J, Fichna P, et al. Normal-range albuminuria does not exclude nephropathy in diabetic children. Pediatr Nephrol. 2010;25:1445–51. doi: 10.1007/s00467-010-1443-z. [DOI] [PubMed] [Google Scholar]
- 69.Fu WJ, Xiong SL, Fang YG, et al. Urinary tubular biomarkers in short-term type 2 diabetes mellitus patients: a cross-sectional study. Endocrine. 2012;41:82–8. doi: 10.1007/s12020-011-9509-7. [DOI] [PubMed] [Google Scholar]
- 70.Woo KS, Choi JL, Kim BR, et al. Urinary neutrophil gelatinase-associated lipocalin levels in comparison with glomerular filtration rate for evaluation of renal function in patients with diabetic chronic kidney disease. Diabetes Metab J. 2012;36:307–13. doi: 10.4093/dmj.2012.36.4.307. [DOI] [PMC free article] [PubMed] [Google Scholar]
- 71.Murata M, Saito T, Otani T, et al. An increase in serum retinol-binding protein 4 in the type 2 diabetic subjects with nephropathy. Endocr J. 2009;56:287–94. doi: 10.1507/endocrj.k08e-242. [DOI] [PubMed] [Google Scholar]
- 72.Graham TE, Yang Q, Blüher M, et al. Retinol-binding protein 4 and insulin resistance in lean, obese, and diabetic subjects. N Engl J Med. 2006;354(24):2552–63. doi: 10.1056/NEJMoa054862. [DOI] [PubMed] [Google Scholar]
- 73.Xu M, Li XY, Wang JG, et al. Retinol-binding protein 4 is associated with impaired glucose regulation and microalbuminuria in a Chinese population. Diabetologia. 2009;52:1511–9. doi: 10.1007/s00125-009-1386-8. [DOI] [PubMed] [Google Scholar]
- 74.Wu H, Wei L, Bao Y, et al. Fenofibrate reduces serum retinol-binding protein-4 by suppressing its expression in adipose tissue. Am J Physiol Endocrinol Metab. 2009;296:E628–34. doi: 10.1152/ajpendo.90526.2008. [DOI] [PubMed] [Google Scholar]
- 75.Soprano DR, Soprano KJ, Goodman DS. Retinol-binding protein and transthyretin mRNA levels in visceral yolk sac and liver during fetal development in the rat. Proc Natl Acad Sci U S A. 1986;83(19):7330–4. doi: 10.1073/pnas.83.19.7330. [DOI] [PMC free article] [PubMed] [Google Scholar]
- 76.Goodman DS. Plasma retinol-binding protein. In: Sporn MB, Roberts AB, Goodman DS, editors. The Retinoids. Vol. 2. Orlando, FL: Academic Press; 1984. pp. 41–88. [Google Scholar]
- 77.Henze A, Frey SK, Raila J, et al. Evidence that kidney function but not type 2 diabetes determines retinol-binding protein 4 serum levels. Diabetes. 2008;57:3323–6. doi: 10.2337/db08-0866. [DOI] [PMC free article] [PubMed] [Google Scholar]
- 78.Vahlquist A, Peterson PA, Wibell L. Metabolism of the vitamin A transporting protein complex. I. Turnover studies in normal persons and in patients with chronic renal failure. Eur J Clin Invest. 1973;3(4):352–62. doi: 10.1111/j.1365-2362.1973.tb00362.x. [DOI] [PubMed] [Google Scholar]
- 79.Masaki T, Anan F, Tsubone T, et al. Retinol binding protein 4 concentrations are influenced by renal function in patients with type 2 diabetes mellitus. Metabolism. 2008;57:1340–4. doi: 10.1016/j.metabol.2008.03.013. [DOI] [PubMed] [Google Scholar]
- 80.Frey SKI, Nagl B, Henze A, et al. Isoforms of retinol binding protein 4 (RBP4) are increased in chronic diseases of the kidney but not of the liver. Lipids Heath Dis. 2008;27:7–29. doi: 10.1186/1476-511X-7-29. [DOI] [PMC free article] [PubMed] [Google Scholar]