

Abstract
A 1.37 Mbp region of chromosome 13 previously identified by exclusion mapping was consistently associated with a reduction of salt-induced hypertension in the Dahl salt-sensitive (SS) rat. This region contained five genes that were introgressed from the salt-insensitive Brown Norway (BN) rat. The goal of the present study was to further narrow that region to identify the gene(s) most likely to protect from salt-induced hypertension. The studies yielded a subcongenic SS rat strain containing a 0.71 Mbp insert from BN (26-P strain) in which salt-induced hypertension was reduced by 24 mmHg. The region contained two protein-coding genes (Astn1 and Pappa2) and a microRNA (miR-488). Pappa2 mRNA in the renal cortex of the protected 26-P was 6- to 10-fold greater than in SS fed a 0.4% NaCl diet but was reduced to levels observed in SS when fed 8.0% NaCl diet for 7 days. Compared with brain nuclei (NTS, RVLM, CVLM) and the adrenal gland, Pappa2 in the renal cortex was the only gene found to be differentially expressed between SS and 26-P and that responded to changes of salt diet. Immunohistochemistry studies found Pappa2 localized in the cytosol of the epithelial cells of the cortical thick ascending limbs. In more distal segments of the renal tubules, it was observed within tubular lumens and most notably bound to the apical membranes of the intercalated cells of collecting ducts. We conclude that we have identified a variant form of Pappa2 that can protect against salt-induced hypertension in the Dahl S rat.
Keywords: Dahl S rats, genetics, congenic, kidney, Pappa2, Astn1, miR-488, renal collecting ducts, intercalated cells, thick ascending limbs, Na excretion, ENaC
the world-wide prevalence of essential hypertension, reported as 26.4% of the adult population, represented nearly 1 billion people in 2000 and is predicted to rise to 1.56 billion by 2025 (8, 20). Essential hypertension is a multifactorial polygenic disease determined by an interplay of genes and environment (7, 18, 24, 28). Genome-wide association studies (GWAS) have found that individual genes can account for only a small percent of the blood pressure (BP) phenotype (11, 24, 28). Despite the polygenic nature of the disease, the vast heterogeneity of genetic backgrounds, and more than 29 GWAS-associated polymorphisms, BP in large portions of the population is affected by common stimuli of dietary salt. Enhanced sensitivity of BP to salt intake is present in nearly half of Americans who are afflicted with hypertension and nearly 75% of African American hypertensive patients (1, 36, 40). Salt intake is directly correlated with the risk of developing hypertension in both experimental animal models and in human populations (23). There is strong evidence that sensitivity to dietary salt is a highly heritable trait (15, 32), although the genetic and physiological mechanisms underlying BP salt sensitivity in essential and most forms of experimental hypertension remain elusive.
The inbred Dahl salt-sensitive (SS) rat has been among the most widely studied heritable models to explore the mechanisms underlying BP salt sensitivity (7, 32). SS rats recapitulate, in an accelerated way, the progression of hypertension, as exemplified in the African American population, and this model has provided key insights into the pathophysiological mechanisms and the genetic complexity underlying salt sensitivity (7, 23). Congenic mapping studies in which genomic elements of the salt-resistant Brown Norway (BN) rat were introgressed into the isogenic background of the SS rat identified regions within eight to 10 different chromosomes that contribute to BP salt sensitivity in the SS rat (26, 27). Within chromosome (chr) 13 alone, four nonoverlapping genomic regions were identified that significantly influenced BP salt sensitivity in the SS rat (27). One of these regions contained a 13.11 Mbp segment of the BN salt-resistant strain genome consistently associated with attenuation of salt-induced hypertension in male rats (6). To further narrow this region, 13 overlapping subcongenic strains were developed by multiple backcrossing, which by exclusion mapping identified a 1.37 Mbp region containing five genes that were consistently associated with a reduction of salt-induced hypertension (6). The goal of the present study was to experimentally confirm this region and identify the gene(s) most likely to protect from salt-induced hypertension. An inbred subcongenic strain containing a 0.71 Mbp insert from the BN rat (26-P interval) was developed that contained two protein-coding genes (Astn1 and Pappa2) and a microRNA (miR-488). This 0.71 Mbp insert reduced salt sensitivity by 24 mmHg mean arterial pressure in SS rats. Pappa2 was uniquely differentially expressed in the renal cortex comparing SS and 26-P rats, and the only gene affected by salt diet. The data indicate that Pappa2 is a novel candidate gene in the development of salt-sensitive hypertension.
MATERIALS AND METHODS
Experimental animals and strain nomenclature.
All rats were bred and housed in an American Association for Accreditation of Laboratory Animal Care-accredited animal care facility at the Medical College of Wisconsin with free access to water and to a custom AIN-76A purified rodent chow (0.4% NaCl, Purified AIN-76; Dyets, Bethlehem, PA). This same chow formulation, but with 8% NaCl, was used in studies where the diet was changed for 7 or 14 days. All experimental procedures were approved by the Institutional Care and Use Committee of the Medical College of Wisconsin.
Previous exclusion mapping identified a 1.37 Mbp region containing five genes (Fam5b, Astn1, Pappa2, Rfwd2, Tnr) that influenced the mean arterial pressure (MAP) by 42 mmHg in SS rats fed a high-salt diet (6). For the present study, the protected congenic strain 26-M spanning the 80.99–84.61 Mbp interval was backcrossed to SS, and the F1 generation rats were genotyped with 59 microsatellite markers covering the interval with markers deposited into the Rat Genome Database (http://rgd.mcw.edu/). Recombinant rats were selected as breeders for the establishment of the six overlapping subcongenic strains as shown in Fig. 1 (flanking markers for each congenic strain displayed). The corresponding strain names are as follows: 26-N, SS.BN-(D13Hmgc 1048-D13Hmgc 664)/Mcwi; 26-O, SS.BN-(D13Hmgc 1048-D13Hmgc1045)/Mcwi; 26-P, SS.BN-(D13Hmgc1048-D13Hmgc1050)/Mcwi; 26-Q, SS.BN-(D13Hmgc1041-D13Hmgc664)/Mcwi; 26-R, SS.BN-(D13Hmgc885-D13Hmgc664)/Mcwi; 26-S, SS.BN-(D13Hmgc1041-D13Hmgc885)/Mcwi.
Fig. 1.

Schematic representation of the 3.62 Mbp region of chromosome (chr) 13 spanned by 6 overlapping congenic strains. Various lengths of chr 13 from the Brown Norway rat (indicated by black bars) were introgressed into the genetic background of the Dahl salt-sensitive (SS) rat (white bar). Mean arterial pressure (MAP) measured on day 14 of 8.0% NaCl diet is listed below each strain along with urinary excretion of albumin (UalbV) for the same day of high-salt diet (HS). Number of animals is listed below each strain (N). *Significant differences from the SS strain on day 14 HS (P < 0.05).
Phenotyping.
We surgically prepared 5–6 wk old male rats of each strain (SS, 26-N, 26-O, 26-P, 26-Q, 26-R, 26-S) for the measurement of MAP and heart rate (HR) using radiotelemetry techniques, as we have described (9, 14). Rats were anesthetized with 2.5% isoflurane (remainder oxygen), and a gel-filled catheter implanted in the right carotid artery and the attached transmitter (model TA11PA-C40; Data Systems International, Minneapolis, MN) secured subcutaneously between the scapulae. Postoperative administration of buprenorphine provided analgesia, and the rat was returned to the home cage for a 5- to 7-day recovery period. Following recovery, rats were placed in metabolic cages without restricting food or water for an overnight urine collection to measure baseline albuminuria and then returned to the home cage for measurement of BP. BP was measured daily from 9:00 AM to 12 PM during a period when access to the recording room was restricted. It was this BP phenotype that was used for narrowing of the region in the development of these subcongenic strains. After measurements were made for 3 consecutive control days, the dietary intake of NaCl was increased from 0.4 to 8% with BP measurements made for 14 days of high salt with a second overnight collection of urine following the measurements on the last day of 8.0% NaCl diet. From urine collected, albumin was quantified with an Albumin Blue 580 (Molecular Probes) fluorescence assay.
RNA expression.
In separate groups of rats of all strains, kidney cortex and outer medulla tissue, and adrenal gland as well as left ventricle, thoracic aorta, abdominal muscle, and liver were collected from 7–8 wk old rats on 0.4% salt diet or on 8% salt diet for 7 days, snap-frozen in liquid nitrogen, and stored at −80°C. At the same time, whole brain tissue was collected and embedded in OCT through cold 2-methybutane and stored at −80°C. Thick slices (∼1 mm) of brain tissue were made using an Alto adult rat brain matrix form caudal to rostral beginning with the cervical spinal cord through the pontomedullary junction. Circular tissue punches (blunted 18.5 gauge needle) were then taken from the ventral midline from the first four slices to sample three nuclei of the brainstem known to be involved in the autonomic control cardiovascular and pulmonary functions. The locations of these regions were determined with the rat brain stereotaxic map as we have recently described (31). Specifically, these regions were the nucleus tractus solitarius (NTS), rostral ventrolateral medulla (RVLM), and the caudal ventrolateral medulla (CVLM).
Tissues were collected after only 7 days of high salt to minimize the effects of the hypertension itself upon gene expression. RNA from collected tissue was extracted using Trizol reagent (Life Technologies), quantified by a Nanodrop spectrophotometer, and the quality of each sample assessed with Agilent 2100 BioAnalyzer to ensure an RNA integrity number > 8 (25). A two-step quantitative (q)RT-PCR approach was carried out for the mRNA quantification of expression, and 18s used for internal normalization. For cDNA synthesis, a RevertAid First Strand cDNA Synthesis Kit (ThermoSci) was used. The two-step qRT-PCR analysis for microRNA was carried out using the modified real-time PCR method described previously (38). RUN6B was used for the experiments in Fig. 3 for internal normalization but later experiments used 5s rRNA.
Fig. 3.
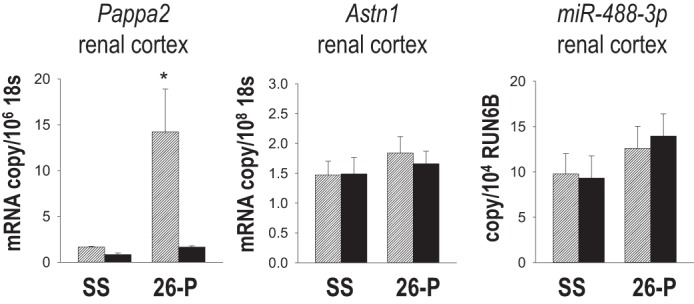
mRNA expression of Pappa2, Astn1, and miR-488-3p in renal cortex homogenates collected from SS rats and congenic 26-P rats fed either 0.4% NaCl diet (hatched bars, n = 6/strain) or 7 days of 8% NaCl diet (black bars, n = 6/strain). mRNA copy number was normalized to 18S. The microRNA (miRNA or miR) expression of miR-488-3p in the renal cortex from same animals was normalized to RUN6B. *Significant difference between strains on the same salt diet (P < 0.05).
For amplification, rat Pappa2 primers were purchased from Qiagen (cat. no. QT00457387). The amplified PCR product from the kidney cortex had the following sequence: GTATCTGTGAACTTCCTATGTGGATGCGTCACCACCATGGGCAAGCCACTGGAAAAAGG AGGCTCTCGGAGAACCTGGTAACTCACAGGTCTGCATCCA. The primer sequences for Astn1 were: 5′-GCCATGGACCTCTGTGCCCG-3′, 5′-CTGAGGGGCAGCCACATGC-3′. 18s rRNA was used as an internal standard for normalization. Primers for mature microRNA were purchased from Applied Biosystems as: hsa-miR-488 and mmu-miR-488-3p.
Immunohistochemistry analyses of kidneys.
Kidneys collected from 7–8 wk old rats, fed either the 0.4 or 8.0% NaCl diet 7 days, were fixed in 10% formalin and embedded in paraffin. Sections were cut at a thickness of 5 μm. Slides were deparaffinized in xylene washes and rehydrated with graded series of ethanol. Antigen retrieval was performed with 1× Trilogy (Cell Marque) at subboiling temperature for 10 min. Sections were then incubated in PBS with 3% H2O2 for 10 min to inactivate endogenous peroxidase. Slides were washed 5 min in PBST (PBS + 1% Tween 20) and blocked with 3% bovine serum albumin in PBST (blocking buffer) for 2 h at 4°C. Goat anti-Pappa2 or anti-Pappa primary antibody (R&D Systems, 1:1,000) was diluted in blocking buffer and incubated at 4°C overnight. Slides were washed three times for 30 min in PBST and incubated in donkey anti-goat horseradish peroxidase secondary antibody as 1:1,000 in blocking buffer for 1 h at room temperature. Tyramide amplification was performed following the manufacturer's instructions (Perkin Elmer). Slides were washed 3 × 10 min in PBST and blocked with 3% bovine serum albumin for 2 h at 4°C. Rabbit anti-Aquaporin2 (Santa Cruz, 1:500) or rabbit anti-Na-K-Cl cotransporter2 (ADI, 1:100) or rabbit anti-Na-Cl cotransporter (Millipore, 1:500) primary antibody was diluted in blocking buffer and incubated at 4°C overnight. Slides were washed three times for 30 min in PBST and incubated in goat Alexa-555 coupled secondary antibody (Life technologies) as 1:1,000 in blocking buffer for 1 h at room temperature. Slides were washed three times for 30 min in PBST and mounted with Vectashield containing 4′,6-diamidino-2-phenyldole. For control with no primary antibody, the tissues were incubated with blocking buffer without the primary antibody included. Similarly for absorption control, the antigen recombinant human Pappa2 (R&D Systems) to anti-Pappa2 was made at a working dilution of 10:1 (molar ratio) and was preincubated overnight at 4°C.
Once processed and prepared for imaging, kidney slides were viewed and images captured with Nikon Ni-E Motorized Upright microscope equipped with DS-QiMc camera, NIS-Element software, and Nikon ECLIPSE 80i microscope equipped with a QIClick CCD camera (Q imaging) and MetaVue research imaging system (Molecular Devices). All slides were coded such that the observer was blinded to the rat strains and dietary intake.
Statistical analysis.
Data are presented as means ± 1 SE. The significance of differences in mean values between and within groups was evaluated by a two-way ANOVA for repeated measures for the BP and proteinuria data followed by a Holm-Sidak test for preplanned comparisons. A two-way ANOVA was used for qRT-PCR mRNA comparisons followed by a Holm-Sidak test. For all tests, a P < 0.05 using a two-tailed test was considered statistically significant.
RESULTS
BP and albuminuria before and following 14 days of 8.0% NaCl diet.
Summarized in Table 1 are the BPs (mean, systolic, and diastolic BP), HR, and urinary albumin excretion data measured on the last day of 0.4% NaCl diet and on day 14 of the 8.0% NaCl diet in SS rats and each of the six overlapping subcongenic strains (26-N, 26-O, 26-P, 26-Q, 26-R, 26-S). There were no statistically differences between any of the strains when maintained on 0.4% NaCl diet for BP or urine albumin excretion. Figure 1 relates the MAP and the albuminuria on the last day of the high-salt diet (day 14) to the corresponding congenic regions of chr 13 containing BN alleles. The 26-N strain (81.01–84.58 Mbp) was protected from salt-induced hypertension and contained the following previously found candidate genes (6) including a portion of Astn1 and miR-488, Pappa2, Rfwd2, and Tnr. The strains containing Rfwd2 and Tnr BN alleles (26-Q), spanning 81.87–84.51 Mbp and 26-S (81.997–82.822 Mbp), were not protected from salt-induced hypertension. Salt sensitivity was significantly reduced (P < 0.05) in four of the subcongenic strains (26-N, 26-O, 26-P, and 26-R) compared with SS rats.
Table 1.
Blood pressure and urine albumin excretion measured on 0.4% NaCl diet and after 14 days of 8.0% NaCl diet
| SS | 26-N | 26-O | 26-P | 26-Q | S6-R | 26-S | |
|---|---|---|---|---|---|---|---|
| 0.4% NaCl | |||||||
| MAP, mmHg | 107 ± 1 | 105 ± 2 | 103 ± 2 | 107 ± 1 | 107 ± 1 | 105 ± 2 | 106 ± 1 |
| SBP | 122 ± 1 | 117 ± 2 | 117 ± 2 | 122 ± 2 | 121 ± 1 | 119 ± 1 | 121 ± 1 |
| DBP | 88 ± 1 | 90 ± 2 | 86 ± 2 | 89 ± 2 | 89 ± 1 | 86 ± 2 | 88 ± 2 |
| HR | 414 ± 5 | 401 ± 4 | 395 ± 5 | 397 ± 4 | 413 ± 5 | 402 ± 7 | 405 ± 5 |
| UalbV | 2.8 ± 0.5 | 1.7 ± 0.4 | 1.2 ± 0.3 | 2.2 ± 0.3 | 2.9 ± 0.5 | 4.1 ± 1.2 | 2.6 ± 0.6 |
| 8.0% NaCl 14 days | |||||||
| MAP, mmHg | 163 ± 4 | 136 ± 4* | 131 ± 3* | 139 ± 4* | 163 ± 4 | 144 ± 3* | 168 ± 4 |
| SBP | 185 ± 5 | 153 ± 4* | 152 ± 4* | 156 ± 5* | 185 ± 4 | 168 ± 5* | 181 ± 5 |
| DBP | 141 ± 4 | 117 ± 4* | 108 ± 2* | 120 ± 4* | 141 ± 4 | 121 ± 3* | 136 ± 5 |
| HR | 387 ± 6 | 365 ± 5* | 366 ± 6 | 363 ± 6* | 385 ± 4 | 362 ± 5* | 384 ± 6 |
| UalbV | 278 ± 18 | 119 ± 17 | 117 ± 36 | 161 ± 21 | 252 ± 25 | 240 ± 35 | 300 ± 35 |
| n | 14 | 15 | 11 | 11 | 13 | 10 | 15 |
Values given are means ± SE.
n, Number of rats.
Significant difference between strains on the same salt diet (P < 0.05). Mean arterial pressure (MAP), systolic blood pressure (SBP), diastolic blood pressure (DBP), and heart rate (HR) were measured from 9 AM to 12 PM. Urine albumin excretion (UalbV) was determined after an overnight collection.
The strains best protected from hypertension salt sensitivity (26-N, 26-O and 26-P) exhibited significantly lower levels of albuminuria than the SS as shown in Table 1 and Fig. 1. Each of these strains contained the BN allele of Pappa2, although it cannot be determined if the protection from renal injury was a consequence of the lower levels of hypertension in these strains or independently determined. The 26-R strain, though containing the SS allele of Pappa2, did not have a significantly different albumin level compared with the SS even though the MAP was significantly reduced. A small but significant (P < 0.05) reduction of HR was observed in 26-N, 26-P, and 26-R compared with SS rats.
Among these data, the most notable finding is that the 26-P strain spanning the 81.01–81.72 Mbp region, which was well protected from both salt-induced hypertension and renal injury, contains only three genes, Astn1, miR-488, and Pappa2. One or more of these genes or elements within this region, or interactions among them, clearly provided robust protection from salt-induced hypertension. It is these two protein-coding genes and this microRNA that are the focus of the remainder of this report. Figure 2 compares the progressive changes in MAP before and following changing from the 0.4 to 8.0% NaCl diet in SS and strain 26-P where these three genes are found. Furthermore, we evaluated the 24 h MAP to determine if the change (delta) in the daytime to nighttime BPs was different between the two strains as a means of evaluating whether there was a different circadian pattern. Delta values were generated by calculating the absolute difference between adjacent 12 h bins, which were then normalized by the earlier of the adjacent time points to account for the effect of pressure itself on the amplitude of the cycles. We performed a two-way repeated-measures ANOVA on the 12 h-binned normalized ΔMAP data from the SS and 26-P rats. When considered independently of time, normalized ΔMAP did not differ significantly between strains (P = 0.555) but did differ significantly over the time course of high salt (P < 0.001), indicating an increase in normalized ΔMAP over the 14 days of high salt in both strains. Furthermore, a significant interaction effect between salt and strain was found (P < 0.001), indicating that the magnitude of normalized ΔMAP change differed between the two strains. Specifically, 26-P had greater normalized ΔMAP values than the SS on days 10, 12, and 14 (P < 0.05).
Fig. 2.
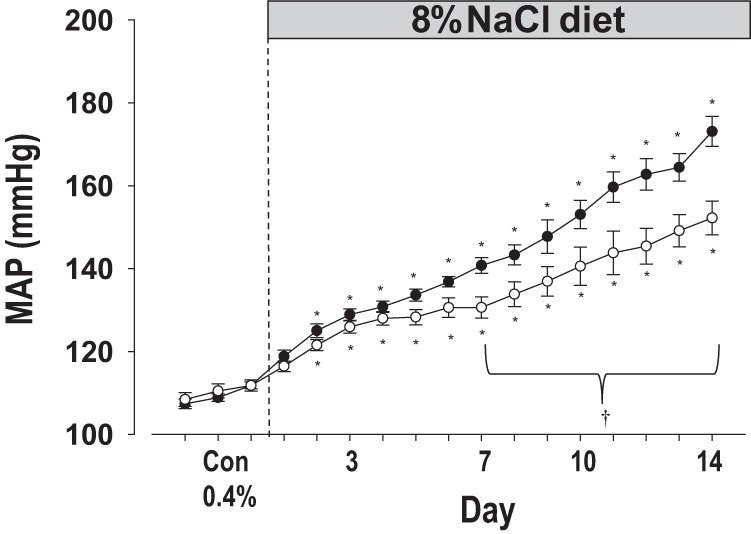
MAP was measured on 0.4% NaCl diet for 3 days and for 14 days after the diet was switched to 8.0% NaCl diet in SS (●, n = 11) and 26-P (○, n = 14). †Significant difference between SS and 26-P (P < 0.05); *significant difference of a 8.0% NaCl diet day from the 3 control days on 0.4% NaCl diet within a strain (P < 0.05).
It should be mentioned that the presurgical weight of the SS and the 26-P rats were not different (179 ± 12 and 172 ± 7 g, respectively). At the end of the study following 14 days of 8% NaCl diet, the weights were still not different between strains (282 ± 21 and 292 ± 5 g).
RNA expression in kidneys.
The expression levels of the two protein-coding candidate genes (Pappa2, Astn1) and the microRNA (miR-488) in the renal cortical and medullary tissue were compared in SS and the salt-resistant 26-P congenic strain fed either the 0.4% NaCl diet from weaning (n = 6 per strain) or 8.0% NaCl diet for 7 days (n = 6 per strain). Shown in Fig. 3, as determined by qRT-PCR, Pappa2 mRNA expression was > 8 times higher levels in the renal cortex of the 26-P strain relative to SS rats fed 0.4% NaCl diet. Interestingly, this differential expression was seen only in 26-P rats receiving the 0.4% NaCl diet indicating that Pappa2 expression levels were influenced by salt diet in a strain-dependent manner. In 26-P rats fed 8.0% NaCl diet for 7 days, renal cortical Pappa2 was reduced to levels not significantly different than SS rats fed the same diet. Cortical Pappa2 mRNA levels of the SS rats remained low with high-salt feeding. Pappa2 mRNA was also expressed in the outer medullary tissue but at levels too low to make quantitatively reliable comparisons between the strains. Astn1 mRNA expression did not differ significantly in the renal cortex between SS or 26-P rats fed 0.4 or 8.0% NaCl chow (Fig. 3) and was also below quantifiable levels in the renal medulla. Similarly, expression levels of two mature microRNA transcripts, (miR-488 and miR-488-3p) were assessed, but only miR-488-3p was detected at very low levels in the renal cortex and did not differ between the SS and 26-P rats at either level of salt intake (Fig. 3).
To determine if reduced salt sensitivity was consistently associated with the expression of the renal cortical BN Pappa2 allele, mRNA expression levels were compared by qRT-PCR between six salt-resistant congenic strains containing the BN Pappa2 allele (26-P, 26-J6, 26-F6, 26-M6, 26-N, 26-O) and the four salt-sensitive strains containing the SS Pappa2 allele (SS, 26-Q, 26-R, and 26-S). As summarized in Fig. 4, Pappa2 was expressed at 6–10 times greater levels in every one of the salt-resistant congenic strains containing the BN allele compared with those strains containing the Pappa2 SS allele. Moreover, when the rat congenic strains containing the BN allele (26-F, 26-J, 26-M, 26-N, 26-O, and 26-P rats) were fed the 8.0% NaCl diet, Pappa2 gene expression was reduced to levels similar to those strains expressing the SS allele (SS, 26-Q, 26-S). It should be noted that gene expression was analyzed in tissue collected after only 7 days of high salt to minimize expression differences that might arise as a consequence of prolonged hypertension and renal injury known to be present with the longer period (14 days) of high-salt feeding represented in the BP and urine protein data of Fig. 1.
Fig. 4.

mRNA expression of Pappa2 in homogenate of renal cortex collected from 6 subcongenic strains containing the Brown Norway (BN) allele (26-F8, 26-J8, 26-M8, 26-N, 26-O, 26-P) and 4 strains containing the SS allele for Pappa2 (SS, 26-Q, 26-R, 26-S) fed either 0.4% NaCl (hatched bars, n = 6/strain) or 7 days of 8% NaCl diet (black bars, n = 6/strain). Note that blood pressure phenotypes of 26-F, 26-J, and 26-M were previously reported (6) and that tissue was not available from the 26-R strain fed 8% NaCl for 7 days for mRNA analysis. mRNA levels of Pappa2 were normalized to the expression level in the SS rat on 0.4% NaCl diet. *P < 0.05 compared with 0.4% NaCl diet within strains; †P < 0.05 compared with SS fed 0.4% NaCl diet.
RNA expression in brain-stem nuclei and adrenal gland and other tissues.
RNA expression of Pappa2, Astn1, and miR-488 (488 and 488-3p) was determined in three brain nuclei (NTS, RVLM, CVLM) to compare expression in SS and 26-P rats fed the 0.4% NaCl diet (n = 6–7 rats per strain) and in rats fed 8.0% NaCl diet for 7 days (n = 6–9 rats per strain). As summarized in Table 2, Pappa2 was expressed at relatively low levels in each of these brain nuclei (1.5–7 mRNA copy/106 18s). No significant differences of Pappa2 expression were found between rat strains fed either 0.4 or 8.0% NaCl diet. Astn1 was expressed at basal levels ranging from 150 to 230 mRNA copy/106 18s but also exhibited neither significant strain differences nor dietary salt effects. miR-488-3p mRNA was expressed at low levels in all of the selected brain tissues (0.06 to 0.23 mRNA copy/106 5s). Within this context, no significant differences in miR-488-3p were observed in the NTS between SS and 26-P rats, nor were expression levels affected by salt diet. Within the CVLM, miR-488-3p expression levels were higher in SS rats compared with 26-P rats (n = 5–7; P < 0.05) fed the 0.4% NaCl diet, but the high-salt diet did not significantly change these levels in either strain. Within the RVLM, expression of miR-488-3p was higher (P < 0.05) in SS rats receiving the 8.0% NaCl diet compared with 26-P rats, but salt diet did not result in significant changes in either strain. Similarly, as also shown in Table 2, no significant differences were observed in the adrenal gland tissue between the SS and 26-P rats at either level of salt. Finally, in a screen of the SS and 26-P strains (one rat of each strain and each salt level) of left ventricle, thoracic aorta, abdominal muscle, and liver, no salt or strain differences were suggested, and so subsequent analyses were not performed.
Table 2.
RNA expression of Pappa2, Astn1, and miR-488-3p in three specific brain regions and the adrenal gland collected from SS rats and congenic 26-P rats fed either 0.4% or switched to 8.0% NaCl diet for 7 days
| Pappa2 mRNA (copy number/106 18s) |
Astn-1 mRNA (copy number/106 18s) |
miR-488-3p (copy number/106 5s) |
||||||||||
|---|---|---|---|---|---|---|---|---|---|---|---|---|
| Tissue | SS 0.4% | SS 8.0% 7D | 26-P 0.4 % | 26-P 8% 7D | SS 0.4% | SS 8.0% 7D | 26-P 0.4% | 26-P 8% 7D | SS 0.4% | SS 8.0 % 7D | 26-P 0.4 % | 26-P 8% 7D |
| Brain CVLM | 3.69 ± 1.05(5) | 7.30 ± 3.7(7) | 4.51 ± 1.92(5) | 5.88 ± 2.09(8) | 153 ± 11(6) | 136 ± 12(7) | 136 ± 11(6) | 159 ± 12(8) | 0.15 ± 0.03(7) | 0.10 ± 0.02(7) | 0.05 ± 0.02(5)* | 0.08 ± 0.01(8) |
| Brain RVLM | 2.79 ± 0.82(6) | 3.04 ± 1.59(7) | 4.16 ± 2.30(7) | 3.23 ± 1.10(8) | 155 ± 16(7) | 150 ± 10(7) | 176 ± 14(6) | 144 ± 10(8) | 0.09 ± 0.02(6) | 0.13 ± 0.02(7) | 0.06 ± 0.01(7) | 0.06 ± 0.01(9)* |
| Brain NTS | 1.40 ± 0.17(7) | 1.68 ± 0.26(7) | 1.58 ± 0.44(6) | 1.24 ± 0.28(9) | 232 ± 33(7) | 235 ± 20(7) | 197 ± 11(6) | 197 ± 23(9) | 0.2 ± 0.04(7) | 0.23 ± 0.05(7) | 0.18 ± 0.03 (6) | 0.16 ± 0.02(9) |
| Adrenal gland | 0.06 ± 0.01(5) | 0.08 ± 0.02(5) | 0.11 ± 0.02(6) | 0.10 ± 0.03(6) | 2.25 ± 0.29(5) | 2.67 ± 0.37(5) | 2.88 ± 0.36(6) | 3.02 ± 0.34(6) | 0.019 ± 0.004(5) | 0.008 ± 0.001(5) | 0.008 ± 0.002(5) | 0.011 ± 0.003(6) |
Values given are means ± SE; number of rats indicated in parentheses.
miR, microRNA; D, day; CVLM, caudal ventrolateral medulla; RVLM, rostral ventrolateral medulla; NTS, nucleus tractus solitarius;
Significant difference between strains on the same salt diet (P < 0.05).
Taken together, the results indicate that of the three genes, only Pappa2 mRNA was differentially expressed in the renal cortex between the SS and 26-P rats and the only gene of the three modified by salt diet in this organ.
Genome sequence analysis in the 26-P congenic interval.
The genetic analysis of our data indicates that causative variants reside in the 0.71 Mbp interval of the 26-P region. Pappa2 was not annotated in rat genome assembly Rn5 but there were two LOC genes (LOC 680069 and LOC680415) predicted in Rn4 in this region. LOC680415 was found to be part of the gene from LOC68069 if the orientation was reversed. The rat Pappa2 gene cDNA sequence was derived by aligning RNA-seq transcript, the predicted LOC gene sequences, and the expressed sequence tag sequences starting at the first ATG. When the synthesized Pappa2 gene was transfected into bacteria, the overexpressed protein could be detected by an anti-Pappa2 antibody with the anticipated molecular weight of 250 kDa (data not shown).
Based on this reassembly, the narrow 0.71 Mbp interval contains 1,097 single nucleotide polymorphisms (SNPs) and 436 Indel variants comparing SS/JrHsdMcwi and BN/NHsdMcwi. Six SNPs reside in the Pappa2 gene (cDNA), and one of these was predicted by Polyphen-2 to be a benign nonsynonymous change (T1340A). There were seven nonsynonymous SNPs found in the Astn1 cDNA, and three SNPs in the 3′-untranslated region. In addition, 436 insertions/deletions (indels) reside within the 710 kb region; most of them are in introns, and only four synonymous changes were found in Astn1 gene. There are eight SNPs, five insertions, and two deletions among the sequences 25 kb upstream from the translation start codon of Pappa2 (81,574,056-81,600,000 site). It is possible these could cause differential expression of Pappa2 in the kidney cortex. However, since Pappa2 exhibits cell-type specificity, in silico analysis (such as TRANSFAC) could not be applied; the functional relevance of these mutations remains to be experimentally determined.
It should be noted that we have used the Rn5 for our assembly since Rn6 did not provide any additional useful information in the candidate region. Analysis of the genome alignment from Ensembl and UCSC Genome Browser in general showed a very similar alignment in both browsers. Yet we found no alignment of Pappa2 in the UCSC Genome Browser RGSC Rnor_6.0/rn6. Astn1 was determined as known processed transcripts instead of a protein coding gene in the Rat Genome Database (http://rgd.mcw.edu), indicating incompletion of the transcripts in Ensembl Rnor_6.0. According to the information of genetic variants presented in Ensembl Rnor_6.0, Pappa2 showed three meaningful variants as were found in Rn5. One SNP was additionally found in our sequence comparison of SS and BN (T1340A).
Localization of Pappa2 in renal cortex and medulla.
Figure 5 shows a representative photomicrograph of the immunohistochemical characterization of Pappa2 protein expression in the kidney. Kidneys collected from the same group of 7 wk old rats used in the gene expression analysis were utilized for these analyses (n = 6/salt diet, SS rats and n = 6/salt diet, 26-P rats). Salt-resistant 26-P rats receiving the 0.4% NaCl diet (Fig. 5, top right; ×4 magnification) typically exhibited expression of Pappa2 largely in the renal cortex and to a lesser extent in the medulla. In contrast, SS rats fed the same salt diet exhibited little Pappa2 in either the cortex or medulla (Fig. 5, top left; ×4 magnification). Pappa2 immunofluorescence was greatly reduced in 26-P rats when fed the 8.0% NaCl diet (Fig. 5, bottom right; ×4) with immunofluorescence levels similar to those of SS rats (Fig. 5, bottom left; ×4). Consistent with the Pappa2 mRNA qRT-PCR data, these higher levels of Pappa2 protein immunofluorescence were observed in each of the six 26-P rats compared with six SS rats fed 0.4% Na Cl diet.
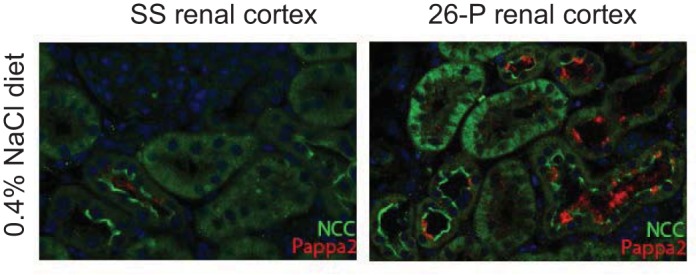
Fig. 5.

Representative photomicrograph of Pappa2 immunofluorescence in the renal cortex and outer medulla of 7 wk old (7wk) SS and subcongenic 26-P rats fed 0.4% NaCl diet (top, ×4 magnification) and 8% salt (bottom, ×4 magnification). Superimposed white lines identify the boundaries of the cortex (C) and medulla (M). As shown, Pappa2 expression was higher in the renal cortex of 26-P rats fed the 0.4% NaCl diet (top right) compared with SS rats. The fluorescence signal was greater in the cortex compared with the medulla. It is also seen that Pappa2 fluorescence levels were lower in 26-P rats fed the high 8.0% NaCl diet (bottom right) compared with the rat fed the 0.4% NaCl diet (top right). SS exhibited relatively low levels of Pappa2 fluorescence in both regions from rats on both salt diets (left, top and bottom).
Primary antibody staining for the Pappa1 protein was carried out to assess possible cross-reactivity between Pappa2 and Pappa1. Pappa1 immunofluorescence was found to be localized predominately in the renal medulla equally in both SS and 26-P rats (fed the 0.4% NaCl diet) as distinct from the Pappa2, which was observed largely in the cortex of the 26-P rats.
A more precise localization of Pappa2 was obtained by immunocolocalization studies at ×40 magnification of the tissue sections from SS and 26-P rats fed the 0.4% NaCl diet. Figure 6 (×40) shows costaining of the Na+K+Cl2 cotransporter (NKCC2) fluorescence antibody (marker of tubular thick ascending limbs) with that of Pappa2 in cortical thick ascending limbs (cTAL) but not the medullary thick ascending limbs of 26-P rats fed the 0.4% NaCl diet.
Fig. 6.

Top: illustrated is the colocalization by immunohistochemical methods of Pappa2 (red fluorescence) and the Na+K+Cl2 cotransporter 2 (NKCC2) in renal cortex and medulla (×40 magnification); bottom: the colocalization of Pappa2 (red fluorescence) with aquaporin 2 (Aqp2; green fluorescence) in the 2 regions. Pappa2 was colocalized with NKCC2 and appears to reside in the cytosol of the cortical thick ascending limbs of this region (cTAL; seen as the yellow/orange fluorescence color) as found in the 7 wk old 26-P rats (26-P 7W) fed the 0.4% NaCl diet. Note that Pappa2 appears to be expressed intracellularly. There is not a colocalization with the Aqp2-expressing principal cells (green) but rather in other cell types, which appear to be intercalated cells (red).
Also shown in Fig. 6 is the costaining of Pappa2 with Aquaporin 2 (Aqp2), the marker of cortical and medullary collecting ducts. As illustrated in these images, Pappa2 was colocalized with Aqp2 in both the cortex and medullary collecting ducts extending to the tip of the papilla (not shown). However, Pappa2 was not colocalized to the same cells that expressed the Aqp2 (e.g., principal cells), indicating that Pappa2 is uniquely bound to the apical membranes of the intercalated cells.
Pappa2 was also intermittently observed within the tubular lumen and associated with apical membranes of the epithelial cells but was not apparent intracellularly, as demonstrated by coexpression with the fluorescent antibody for the distal tubular marker, Na+Cl− cotransporter (NCC) as shown in Fig. 7. The coexpression of Pappa2 and NCC was observed in both SS and 26-P rats but most conspicuously in the cortex of the 26-P rats fed the 0.4% NaCl diet. As discussed below, this observation is consistent with secretion from more proximal segments such as the cTAL.
Fig. 7.
Pappa2 is shown coexpressed with the thiazide-sensitive Na+-Cl− cotransporter (NCC) fluorescence antibody (distal tubular marker) in the cortex of only the 26-P rats fed 0.4% NaCl (right) and not in SS rats (left). Note that Pappa2 (red) is localized to the apical membrane of distal tubular epithelial cells (right) and not intracellularly. Pappa2 (red) can also be seen within the tubular lumen of the distal tubules in both the SS and 26-P rats (left and right).
DISCUSSION
The goal of the present study was to fine-map genes relevant to BP salt sensitivity within chr 13 of the SS rat. Previous exclusion mapping localized a 1.37 Mb segment of chr 13 containing five genes (Fam5b, Astn1, Pappa2, Rfwd2, and Tnr) (6). In the present study, this region was further narrowed and captured within an inbred congenic strain to 0.71 Mbp, which contains BN alleles of two genes (Astn1 and Pappa2) and a microRNA (miR-488-3p). This congenic strain (26-P) exhibited significant protection from salt-induced hypertension. This 26-P congenic region excludes the Rfwd2, Fam5b, and Tnr genes, one of which, Rfwd2, we have previously suggested could be important in determining BP diurnal rhythms (6).
The novel result of the present study is that among the three genes within the 0.71 Mbp congenic 26-P region, only Pappa2 mRNA and immunofluorescence of Pappa2 protein binding were greater in the renal cortex of 26-P compared with the SS rat on the 0.4% NaCl diet. This differential expression was uniquely observed only in rats fed the lower 0.4% NaCl diet and not in those fed the high 8.0% NaCl diet. Remarkably, differential mRNA expression of Pappa2 in the renal cortex was observed in every one of six overlapping salt-resistant congenic strains of rats containing the BN Pappa2 allele compared with SS rats as illustrated in Fig. 4. In all cases, Pappa2 mRNA expression levels were reduced when these congenic strains were fed 8.0% NaCl diet. Importantly, several lines of evidence indicate that Pappa2 is the gene most likely responsible for the protection from salt sensitivity in this region of chr 13. First, neither Pappa2 nor Astn1 expression differed between the SS and 26-P rats within the nonrenal tissues that were analyzed. Second, Pappa2 was the only one of the three genes within the renal cortex that was significantly different between the SS and 26-P rats. Third, Pappa2 was the only one of the three genes that responded consistently in the 26-P rats to changes of salt diet.
Not unexpectedly, as the many overlapping congenic strains were analyzed, there was some evidence of gene-gene interactions, as exemplified by strain 26-R. From Fig. 3 it can be seen that 26-R Pappa2 expression levels were more in line with those expected from an SS allele, yet the MAP of the 26-R strain was clearly reduced (144 ± 8 mmHg) compared with the SS rats (163 ± 16 mmHg) as shown in Fig. 1. This suggests the existence of genetic elements that can modulate BP in this congenic interval, although it is difficult to conjecture which of the 32 genes contained in this region could be responsible for modulating the BP. Yet some of these genes have interesting functions, such as DARS2 (mitochondrial aspartyl-tRNA synthetase), which is required for normal mitochondrial protein synthesis in cardiomyocytes (10) and others that are involved in the TNF signaling pathway that could affect BP.
Pappa1 and Pappa2.
Pappa1 and Pappa2 are metalloproteinases in the metzincin superfamily. Pappalysin-1, also known as pregnancy-associated plasma protein, is encoded by the Pappa gene. Pappa1 in the kidney appears to be largely expressed in the renal medulla in a similar manner in both the SS and 26-P rats fed 0.4% NaCl diet. It is, therefore, not colocalized with Pappa2 in the kidney, which, as shown in Fig. 5, is largely evident in the renal cortex. Both Pappa1 and Pappa2 genes have been reported to be found in the plasma, kidney, uterus, adipose tissues, heart, and placenta (5, 19). It is of interest that Pappa1 is a secreted protein, found in the circulation, and has been analyzed by immunoassay under a variety of pregnancy-related conditions (22, 29). Pappa2 has not been extensively studied, although it is recognized to be a protease that can cleave IGFBP-5 (30, 42), thereby regulating hydroxyapatite and IGF-1 binding (4). However, IGFBP-5 is also able to exert biological activities independent of IGF-1(34). Although clinical associations between Pappa2 and IGF-1 and hypertension and cardiovascular risk have been reported (19, 35, 41), the mechanistic link is unclear. Knockout of Pappa2 in mice was observed to result in postnatal growth retardation (5), although kidney weights, BP, and cardiovascular parameters were not determined so the relevance of these observations to hypertension is unclear.
Localization of Pappa2 in the rat kidney.
As identified by immunohistochemistry, Pappa2 was effectively localized in the kidneys of congenic 26-P rats fed the 0.4% NaCl diet (Fig. 5) where mRNA expression levels were found to be significantly higher compared with SS rats (Fig. 4). The fluorescent signal of the Pappa2 protein was consistently greater in the renal cortex compared with the renal medulla as seen in the ×4 images of the hemisected whole kidney. Moreover, as seen in the ×40 images (Fig. 6), Pappa2 in the cortex was specifically colocalized with NKCC2 near the glomerulus and was observed within the cytosol of the cTAL epithelial cells of this region. These were the only tubular segments in which the Pappa2 protein appeared to be expressed intracellularly. Pappa2 was also colocalized intermittently with NCC-expressing cells of the distal tubules at the apical membranes (Fig. 7). Most notably, Pappa2 consistently colocalized with Aqp2 positive expressing tubular segments of the cortex and outer medulla. Of particular relevance to future studies, Pappa2 in the collecting ducts did not colocalize to the Aqp2-expressing principal cells, but specifically to the apical membranes of the intercalated cells, which did not express the green Aqp2 fluorescence.
Co-regulation database analysis.
It is challenging to construct a functional hypothesis linking Pappa2 to renal function and BP regulation at this time. Functionally, there exist only fragments of information from which one could deduce the relevance of the cortical responses of Pappa2 in the congenic 26-P rats to increased intake of dietary salt as reported in the present studies. To infer possible functional roles of Pappa2, we carried out a meta-analysis of gene expression databases using the Co-Regulation Database (13) (CORD, http://cord-db.org) to identify genes that commonly coexpress with Pappa2. CORD queries more than 120,000 array datasets to identify genes that express either positive or negative correlation with a user-specified target gene. When analyzing the genes that correlate with Pappa2, we found 400 genes with an absolute Pearson's correlation coefficient of >0.35 and seven genes had a correlation coefficient >0.75. These most highly correlated genes included vascular endothelial growth factor receptor 1 (FLT1, r = 0.825), placenta-specific 1 (PLAC1, r = 0.809), disrupted in renal carcinoma 2 (DIRC2, r = 0.791), tissue factor pathway inhibitor 2 (TFPI2, r = 0.785), ceroid-lipofuscinosis neuronal 3 (CLN3, r = 0.768), amiloride binding protein 1 (ABP, r = 0.767), and stimulated by retinoic acid gene 6 homolog (STRA6, r = 0.755). Six other genes associated with Na+ transport showed a high correlation with Pappa2 expression (correlation coefficient > 0.35) including Slc12a2, Slc13a4, Slc23a2, Slc5a6, Scn4b, Scnn1b. Five genes also showed high correlation with regulation of BP, including Acvrl1, Adipoq, Hsd11b2, Nos3, and P2RX4. However, since most of the microarrays queried by CORD were neither renal or vascular, the pathways themselves were not statistically overrepresented, and it is evident that the observed gene correlations are only suggestive of some possible mechanisms whereby Pappa2 could be influencing BP. Together, these associations broadly suggest that Pappa2 is associated with genes involved in tubular sodium transport and cell growth and differentiation. Since Pappa2 cleaves IGFBP-5 releasing IGF, enhancement of downstream signaling of mTORC1 with stimulation of the cell cycle pathway would be expected (17).
To identify genes that were co-regulated with both Pappa2 and IGFBP-5, another CORD analysis was carried out. Although the majority of genes that were co-regulated with Pappa2 were not also co-regulated with IGFBP-5, (and vice-versa), 16 genes were identified that were together co-regulated. These included: Adam 12, CKDN1C, CD200, COL4A1, Col4A2, FBLN1, FBN2, MFAP2, PLAGL1, PPAP2B, SERPINE2, TIMP2, GEMIN6, LYAR, MTHFD1, and PRPS1. An ontology analysis performed on this list of 16 using DAVID (Database for Annotation, Visualization and Integrated Discovery) yielded an average enrichment score of 4.24 with these genes found to be most related to extracellular matrix and disulfide bond pathways. Taken together these two CORD analyses indicate that Pappa2 has roles related to both Na+ transport functions and the IGF system, either coordinately or independently.
Possible mechanisms.
The present study indicates that Pappa2 represents a novel gene that is involved in BP salt sensitivity in the SS rat. Pappa2 was found to be regulated within the renal cortex of those congenic rats containing the BP Pappa2 allele and was expressed at significantly greater levels in those salt-resistant congenic rats than in the SS rats when the rats were fed a relatively low-salt diet. Although reduction of renal Pappa2 in response to a high-salt diet in the salt-resistant rats could serve a sodium homeostatic function in those strains with the BN Pappa2 allele, such a mechanism could even be an advantage in the SS rat where Pappa2 expression is already very suppressed even when fed a low-NaCl diet. One could speculate that the low levels of Pappa2 expressed in the cTALs of the SS may serve a counterregulatory function that would reduce nephron sodium absorption to partially offset excess sodium absorption known to occur in the thick ascending limbs (21, 33). It would be informative but a large task to determine the sequential changes of the cortical Pappa2 levels after switching to the high-salt diet.
It is interesting to speculate how the production of Pappa2 in cTAL could affect BP salt sensitivity. The cytosolic presence of Pappa2 in the cTAL close to the glomerulus suggests that it could serve, via the macula densa, to modify the gain or set point of the tubular glomerular feedback mechanism. The luminal presence of Pappa2 in more distal tubular segments with localization to only the apical membranes of the downstream tubular segments suggest it may be secreted from the thick ascending limb and act downstream to modify tubular function. In a preliminary Western blot analysis of urine, Pappa2 was clearly present. Secretion of Pappa1 is well established (22, 29), and it is reasonable to expect the same is true for Pappa2. Given the specific localization of Pappa2 to the intercalated cells of the collecting ducts, it could be involved in the regulation of Na+ excretion via alterations of luminal tubular H+ or HCO3− secretion. This would be consistent with evidence that elevations of luminal HCO3− concentration modulate ENaC abundance and function in principal cells that enhance net NaCl reabsorption (39). Also, given the results of the in silico CORD analysis indicating high concordance of Pappa2 with both IGF and Na+ transport functions, it is possible that Pappa2 could affect Na+ homeostasis and BP salt sensitivity through these pathways.
The CORD analysis also suggests that Pappa2 could exert systemic vascular actions. Vascular endothelial cells from both large and microvessels express both IGF1 and the IGF binding protein 5 (IGFBP5) (3), which, as indicated above, can be cleaved by Pappa2 (30, 42), thereby determining the bioavailability of IGF1 to its receptor binding site. IGF1 receptor activation signals downstream pathways, including Ras/Raf/ERK and PI3 kinase/AKT, thereby modifying vascular function (2). So it is possible that as tissue or circulating levels of Pappa2 are reduced, systemic vascular function could be modified as less IGFBP5 is cleaved, thereby reducing the bioavailability and vascular effects of IGF (37). Several studies have suggested that low-normal serum IGF1 levels correlate with an increased risk of adverse cardiovascular outcomes, including myocardial infarction and heart failure (12, 16). Although no studies are yet available examining either the presence or function of either Pappa2 or possible IGFBP5/IGF pathways in the kidney, we have preliminary Western blot data indicating that the renal cortex expresses high IGFBP5, so it appears that at least the elements for such a hypothesis exist in the kidney.
The unbiased search for candidate genes responsible for salt-sensitive hypertension via techniques of chromosomal substitution is a long and expensive process, but a rewarding one, since it can yield unexpected and novel results. Such was the case in the present study, since one would not have guessed that Pappa2 would be revealed as a viable candidate gene contributing to salt sensitivity in this long-studied Dahl S rat model of hypertension. Pappa2 has also never been recognized to reside in the cTALs of Henle. Nor has it been known to be associated with intercalated cells of renal collecting ducts, much less suggested as a gene regulated by dietary salt intake with a possible role in tubular sodium reabsorption. These observations now point to the need to examine whether the knockout of Pappa2 in salt-protected congenic rats will also alter sodium transport in collecting ducts and affect sodium homeostasis leading to salt-sensitive hypertension.
GRANTS
Sources of funding: National Heart, Lung, and Blood Institute Grant PO1 HL-82798 (A. W. Cowley, Jr.)
DISCLOSURES
No conflicts of interest, financial or otherwise, are declared by the author(s).
AUTHOR CONTRIBUTIONS
Author contributions: A.W.C. and M.L. conception and design of research; A.W.C., C.Y., V.K., P.L., A.D., and T.K. analyzed data; A.W.C., C.Y., V.K., H.J., A.M.G., P.L., A.D., and M.L. interpreted results of experiments; A.W.C. drafted manuscript; A.W.C., C.Y., V.K., J.L., A.M.G., P.L., A.D., and M.L. edited and revised manuscript; A.W.C., C.Y., V.K., J.L., H.J., A.M.G., P.L., A.D., T.K., and M.L. approved final version of manuscript; C.Y., V.K., J.L., A.D., and T.K. performed experiments; V.K. and J.L. prepared figures.
ACKNOWLEDGMENTS
We thank Glenn Slocum for assistance with microscopy and image analysis, Jenifer Phillips for the measurement of albumin, Rebecca Schilling for genotyping, and Angela Lemke for sequencing work.
REFERENCES
- 1.Aviv A, Hollenberg NK, Weder A. Urinary potassium excretion and sodium sensitivity in blacks. Hypertension 43: 707–713, 2004. [DOI] [PubMed] [Google Scholar]
- 2.Bach LA. Endothelial cells and the IGF system. J Mol Endocrinol 54: R1–R13, 2015. [DOI] [PubMed] [Google Scholar]
- 3.Baxter RC. IGF binding proteins in cancer: mechanistic and clinical insights. Nat Rev Cancer 14: 329–341, 2014. [DOI] [PubMed] [Google Scholar]
- 4.Campbell PG, Andress DL. Insulin-like growth factor (IGF)-binding protein-5-(201–218) region regulates hydroxyapatite and IGF-1 binding. Am J Physiol Endocrinol Metab 273: E1005–E1013, 1997. [DOI] [PubMed] [Google Scholar]
- 5.Conover CA, Boldt HB, Bale LK, Clifton KB, Grell JA, Mader JR, Mason EJ, Powell DR. Pregnancy-associated plasma protein-A2 (PAPP-A2): tissue expression and biological consequences of gene knockout in mice. Endocrinology 152: 2837–2844, 2011. [DOI] [PubMed] [Google Scholar]
- 6.Cowley AW Jr, Moreno C, Jacob HJ, Peterson CB, Stingo FC, Ahn KW, Liu P, Vannucci M, Laud PW, Reddy P, Lazar J, Evans L, Yang C, Kurth T, Liang M. Characterization of biological pathways associated with a 1.37 Mbp genomic region protective of hypertension in Dahl S rats. Physiol Genomics 46: 398–410, 2014. [DOI] [PMC free article] [PubMed] [Google Scholar]
- 7.Cowley AW., Jr The genetic dissection of essential hypertension. Nat Rev Genet 7: 829–840, 2006. [DOI] [PubMed] [Google Scholar]
- 8.Danaei G, Finucane MM, Lin JK, Singh GM, Paciorek CJ, Cowan MJ, Farzadfar F, Stevens GA, Lim SS, Riley LM, Ezzati M. Global Burden of Metabolic Risk Factors of Chronic Diseases Collaborating Group (Blood Pressure). National, regional, and global trends in systolic blood pressure since 1980: systematic analysis of health examination surveys and epidemiological studies with 786 country-years and 5.4 million participants. Lancet 377: 568–577, 2011. [DOI] [PubMed] [Google Scholar]
- 9.De Miguel C, Lund H, Feng D, Mattson DL. Infiltrating T lymphocytes in the kidney increase oxidative stress and lead to hypertension and renal disease. Am J Physiol Renal Physiol 300: F734–F742, 2011. [DOI] [PMC free article] [PubMed] [Google Scholar]
- 10.Dougan SA, Pujol C, Maiti P, Kukat A, Wang S, Hermans S, Senft K, Wibom R, Rugarli El Trifunovic A. Tissue-specific loss of DARS2 activates stress responses independently of respiratory chain deficiency in the heart. Cell Metab 19: 458–469, 2014. [DOI] [PubMed] [Google Scholar]
- 11.Ehret GB, Munroe PB, Rice KM, Bochud M, Johnson AD, Chasman DI, Smith AV, Tobin MD, Verwoert GC, Hwang SJ, Pihur V, Vollenweider P, O'Reilly PF, Amin N, Bragg-Gresham JL, International Consortium for Blood Pressure Genome-Wide Association Studies . Genetic variants in novel pathways influence blood pressure and cardiovascular disease risk. Nature 478: 103–109, 2011. [DOI] [PMC free article] [PubMed] [Google Scholar]
- 12.Ezzat VA, Duncan ER, Wheatcroft SB, Kearney MT. The role of IGF-I and its binding proteins in the development of type 2 diabetes and cardiovascular disease. Diabetes Obes Metab 10: 198–211, 2008. [DOI] [PubMed] [Google Scholar]
- 13.Fahrenbach JP, Andrade J, McNally EM. The CO-Regulation Database (CORD): a tool to identify coordinately expressed genes. PLoS One 9: e90408, 2014. [DOI] [PMC free article] [PubMed] [Google Scholar]
- 14.Feng D, Yang C, Geurts A, Kurth T, Liang M, Lazar J, Mattson D, O'Connor P, Cowley AW Jr. Increased expression of NAD(P)H oxidase subunit p67phox in the renal medulla contributes to excess oxidative stress and salt-sensitive hypertension. Cell Metab 15: 201–208, 2012. [DOI] [PMC free article] [PubMed] [Google Scholar]
- 15.Grim CE. Genetic studies in twins. J Clin Hypertens 3, Suppl: 74S–78S, 1987. [PubMed] [Google Scholar]
- 16.Higashi Y, Pandey Am Goodwin B, Delafontaine P. Insulin-like growth factor-1 regulates glutathione peroxidase expression and activity in vascular endothelial cells: Implications for atheroprotective actions of insulin-like growth factor-1. Biochim Biophys Acta 1832: 391–399, 2010. [DOI] [PMC free article] [PubMed] [Google Scholar]
- 17.Hirose K, Hiomi T, Hozumi S, Kikuchi Y. Mechanistic target of rapamycin complex 1 signaling regulates cell proliferation, cell survival, and differentiation in regenerating zebrafish fins. BMC Dev Biol 14: 42, 2014. [DOI] [PMC free article] [PubMed] [Google Scholar]
- 18.Joe B. Dr. Lewis Kitchener Dahl, the Dahl rats and the “inconvenient truth” about the genetics of hypertension. Hypertension 65: 963–969, 2015. [DOI] [PMC free article] [PubMed] [Google Scholar]
- 19.Kalousova M, Muravska A, Zima T. Pregnancy-associated plasma protein A (PAPP-A) and preeclampsia. Adv Clin Chem 63: 169–209, 2014. [DOI] [PubMed] [Google Scholar]
- 20.Kearney PM, Whelton M, Reynolds K, Muntner P, Whelton PK, He J. Global burden of hypertension: analysis of worldwide data. Lancet 365: 217–223, 2005. [DOI] [PubMed] [Google Scholar]
- 21.Kirchner KA. Greater loop chloride uptake contributes to blunted pressure natriuresis in Dahl salt-sensitive rats. J Am Soc Nephrol 1: 180–186, 1990. [DOI] [PubMed] [Google Scholar]
- 22.Kirkegaard I, Uldbjerg N, Oxvig C. Biology of pregnancy-associated plasma protein-A in relation to prenatal diagnostics: an overview. Acta Obstet Gynecol Scand 89: 1118–1125, 2010. [DOI] [PubMed] [Google Scholar]
- 23.Kotchen TA, Cowley AW Jr, Frohlich ED. Salt in health and disease-A delicate balance. N Engl J Med 368: 1229–1237, 2013. [DOI] [PubMed] [Google Scholar]
- 24.Levy D, Ehret GB, Rice K, Verwoert GC, Launer LJ, Dehghan A, Glazer NL, Morrison AC, Johnson AD, Aspelund T, Aulchenko Y, Lumley T, Köttgen A, Vasan RS, Rivadeneira F, Eiriksdottir G, Guo X, Arking DE, Mitchell GF, Mattace-Raso FU, Smith AV, Taylor K, Scharpf RB, Hwang SJ, Sijbrands EJ, Bis J, Harris TB, Ganesh SK, O'Donnell CJ, Hofman A, Rotter JI, Coresh J, Benjamin EJ, Uitterlinden AG, Heiss G, Fox CS, Witteman JC, Boerwinkle E, Wang TJ, Gudnason V, Larson MG, Chakravarti A, Psaty BM, van Duijn CM. Genome-wide association study of blood pressure and hypertension. Nat Genet 41: 677–687, 2009. [DOI] [PMC free article] [PubMed] [Google Scholar]
- 25.Lu L, Li P, Yang C, Kurth T, Misale M, Skelton M, Moreno C, Roman RJ, Greene AS, Jacob HJ, Lazar J, Liang M, Cowley AW Jr. Dynamic convergence and divergence of renal genomic and biological pathways in protection from Dahl salt-sensitive hypertension. Physiol Genomics 41: 63–70, 2010. [DOI] [PMC free article] [PubMed] [Google Scholar]
- 26.Mattson DL, Dwinell MR, Greene AS, Kwitek AE, Roman RJ, Jacob HJ, Cowley AW Jr. Chromosome substitution reveals the genetic basis of Dahl salt-sensitive hypertension and renal disease. Am J Physiol Renal Physiol 295: F837–F842, 2008. [DOI] [PMC free article] [PubMed] [Google Scholar]
- 27.Moreno C, Kaldunski ML, Want T, Roman RJ, Greene AS, Lazar J, Jacob HJ, Cowley AW Jr. Multiple blood pressure loci on rat chromosome 13 attenuate development of hypertension in the Dahl S hypertensive rat. Physiol Genomics 31: 228–235, 2007. [DOI] [PubMed] [Google Scholar]
- 28.Newton-Cheh C, Johnson T, Gateva V, Tobin MD, Bochud M, Coin L, Najjar SS, Zhao JH, Heath SC, Eyheramendy S, Papadakis K, Voight BF, Scott LJ, Zhang F, Farrall M, Tanaka T, Wallace C, Chambers JC, Khaw KT, Nilsson P, van der Harst P, Polidoro S, Grobbee DE, Onland-Moret NC, Bots ML, Wain LV, Elliott KS, Teumer A, Luan J, cLucas G, Kuusisto J, Burton PR, Hadley D, McArdle WL; Wellcome Trust Case Control Consortium , Brown M, Dominiczak A, Newhouse SJ, Samani NJ, Webster J, Zeggini E, Beckmann JS, Bergmann S, Lim N, Song K, Vollenweider P, Waeber G, Waterworth DM, Yuan X, Groop L, Orho-Melander M, Allione A, Di Gregorio A, Guarrera S, Panico S, Ricceri F, Romanazzi V, Sacerdote C, Vineis P, Barroso I, Sandhu MS, Luben RN, Crawford GJ, Jousilahti P, Perola M, Boehnke M, Bonnycastle LL, Collins FS, Jackson AU, Mohlke KL, Stringham HM, Valle TT, Willer CJ, Bergman RN, Morken MA, Döring A, Gieger C, Illig T, Meitinger T, Org E, Pfeufer A, Wichmann HE, Kathiresan S, Marrugat J, O'Donnell CJ, Schwartz SM, Siscovick DS, Subirana I, Freimer NB, Hartikainen AL, McCarthy MI, O'Reilly PF, Peltonen L, Pouta A, de Jong PE, Snieder H, van Gilst WH, Clarke R, Goel A, Hamsten A, Peden JF, Seedorf U, Syvänen AC, Tognoni G, Lakatta EG, Sanna S, Scheet P, Schlessinger D, Scuteri A, Dörr M, Ernst F, Felix SB, Homuth G, Lorbeer R, Reffelmann T, Rettig R, Völker U, Galan P, Gut IG, Hercberg S, Lathrop GM, Zelenika D, Deloukas P, Soranzo N, Williams FM, Zhai G, Salomaa V, Laakso M, Elosua R, Forouhi NG, Völzke H, Uiterwaal CS, van der Schouw YT, Numans ME, Matullo G, Navis G, Berglund G, Bingham SA, Kooner JS, Connell JM, Bandinelli S, Ferrucci L, Watkins H, Spector TD, Tuomilehto J, Altshuler D, Strachan DP, Laan M, Meneton P, Wareham NJ, Uda M, Jarvelin MR, Mooser V, Melander O, Loos RJ, Elliott P, Abecasis GR, Caulfield M, Munroe PB. Genome-wide association study identifies eight loci associated with blood pressure. Nat Genet 41: 666–676, 2009. [DOI] [PMC free article] [PubMed] [Google Scholar]
- 29.Nishizawa H, Pryor-Koishi K, Suzuki M, Kato T, Kogo H, Sekiya T, Kurahashi H, Udagawa Y. Increased levels of pregnancy-associated plasma protein-A2 in the serum of pre-eclamptic patients. Mol Hum Reprod 14: 595–602, 2008. [DOI] [PubMed] [Google Scholar]
- 30.Overgaard MT, Boldt HB, Laursen LS, Sottrup-Jensen L, Conover CA, Oxvig C. Pregnancy-associated plasma protein-A2 (PAPP-A2), a novel insulin-like growth factor-binding protein-5 proteinase. J Biol Chem 276: 21849–21853, 2001. [DOI] [PubMed] [Google Scholar]
- 31.Puissant MM, Echert AE, Yang C, Mouradian GC Jr, Novotny T, Liu P, Liang M, Hodges MR. RNASeq-derived transcriptome comparisons reveal neuromodulatory deficiency in the CO2-insensitive Brown Norway rat. J Physiol 593: 415–430, 2015. [DOI] [PMC free article] [PubMed] [Google Scholar]
- 32.Rapp JP. Genetic analysis of inherited hypertension in the rat. Physiol Rev 80: 135–172, 2000. [DOI] [PubMed] [Google Scholar]
- 33.Roman RJ, Kaldunski ML. Enhanced chloride reabsorption in the loop of Henle in Dahl salt-sensitive rats. Hypertension 17: 1018–1024, 1991. [DOI] [PubMed] [Google Scholar]
- 34.Schneider MR, Wolf E, Hoeflich A, Lahm H. IGF-binding protein-5: flexible player in the IGF system and effector on its own. J Endocrinol 172: 423–440, 2002. [DOI] [PubMed] [Google Scholar]
- 35.Schutte AE, Huisman HW, van Rooyen JM, Malan L, Malan NT, Fourie CM, Louw R, van der Westhuizen FH, Schutte R. A significant decline in IGF-1 may predispose young Africans to subsequent cardiometabolic vulnerability. J Clin Endocrinol Metab 95: 2503–2507, 2010. [DOI] [PubMed] [Google Scholar]
- 36.Sullivan JM, Prewitt RL, Ratts TE. Sodium sensitivity in normotensive and borderline hypertensive humans. Am J Med Sci 295: 370–377, 1988. [DOI] [PubMed] [Google Scholar]
- 37.Thum T, Fleissner F, Link I, Tsikas D, Jakob M, Bauersachs J, Stichtenoth DO. Growth hormone treatment improves markers of systemic nitric oxide bioavailability via insulin-like growth factor-I. J Clin Endocrinol Metab 92: 4172–4179, 2007. [DOI] [PubMed] [Google Scholar]
- 38.Tian Z, Greene As Pietrusz JL, Matus IR, Liang M. microRNA-target pairs in rat kidneys identified through microRNA microarray, proteomic, and bioinformatics analysis. Genome Res 18: 404–411, 2008. [DOI] [PMC free article] [PubMed] [Google Scholar]
- 39.Wall SM, Weinstein AM. Cortical distal nephron Cl(-) transport in volume homeostasis and blood pressure regulation. Am J Physiol Renal Physiol 305: F427–F438, 2013. [DOI] [PMC free article] [PubMed] [Google Scholar]
- 40.Weinberger MH. Salt sensitivity of blood pressure in humans. Hypertension 27: 481–490, 1996. [DOI] [PubMed] [Google Scholar]
- 41.Woelfle J, Roth CL, Wunsch R, Reinehr T. Pregnancy-associated plasma protein A in obese children: relationship to markers and risk factors of atherosclerosis and members of the IGF system. Eur J Endocrinol 154: 613–622, 2011. [DOI] [PubMed] [Google Scholar]
- 42.Yan X, Baxter RC, Firth SM. Involvement of pregnancy-associated plasma protein-A2 in insulin-like growth factor (IGF) binding protein-5 proteolysis during pregnancy: a potential mechanisms for increasing IGF bioavailability. J Clin Endocrinol Metab 95: 1412–1420, 2010. [DOI] [PubMed] [Google Scholar]