Abstract
Purpose
Evaluate the discal morpho-structural changes as a predictive sign in the clinical outcome after ozone therapy in lumbar disc herniation using the T2–shine through effect in diffusion-weighted imaging (DWI).
Method
One hundred and fifty-four patients suffering from lumbosciatica (89 men and 65 women; age range, 23–62 years) were included, previous MR study performed with FSE-T2 and T2-fat, SE-T1 and DWI sequences, and were randomly assigned to two groups. Seventy-seven patients (control group) underwent conservative treatment with intraforaminal injection of steroid and anaesthetic. The remaining 77 patients (study group) underwent the same treatment with the addition of oxygen–ozone (O2–O3). During the following six months, a MRI follow-up with the same sequences was performed. An intervertebral disc volumetric analysis (IDVA), DWI signal score and post treatment clinical outcome evaluation were performed for an assessment of hernia reduction. χ2 test, Student's t test and analysis of covariance were used for comparison of variables.
Results
In the study group, 58 of 77 patients had a successful outcome (responders). In the responders group, DWI T2–shine through effect was present during MRI follow-up and in particular in 53 of 77 patients in six months of follow-up (p < 0.05). Moreover, in the same group a statistically significant disc shrinkage was shown by IDVA in sixth months of follow-up (p < 0.05).
Conclusions
T2–shine through effect in DWI is present before morphological disc reduction and moreover could be considered as a predictive sign of response to oxygen–ozone treatment.
Keywords: Diffusion weighted imaging/Apparent diffusion coefficient (DWI/ADC), Lumbar disk herniation, Chemiodiscolysis with oxygen–ozone mixture
Introduction
Oxygen–ozone discolysis is a good conservative therapy for lumbar disc herniation, with a successful percentage of 70–80% without complications.1–5 The basic principle of action of intradiscal injection of oxygen–ozone mixture is the reduction of proteoglycans,6 consequent dehydration, shrinkage of the disc and reduction of the nervous structure compression; moreover the histological changes include micro and macrovacuolar degeneration with small halos of necrosis and interstitial oedema.6,7 Diffusion-weighted imaging (DWI) sequence, already used in the evaluation of water diffusivity of discs treated with ozone nucleolysis,8 may have application in the evaluation of micro and macrovacuolar degeneration induced by ozone; in fact, in our previous study we showed that these histological changes of the disc are not evident from base sequences T1 and T2 weighted.9–11 Therefore in this study we take into account the T2–shine through effect in DWI for evaluating these changes and predicting shrinkage of lumbar disc herniation after O2–O3 discolysis.
Materials and methods
Patients
Between July 2012 and February 2014 a total of 172 patients were selected for a prospective double-blind trial approved by the Medical Ethical Committee of our institution and randomly assigned to two groups having previously given informed consent. Inclusion criteria included patients with lumbar disc protrusion or herniation documented by magnetic resonance (MR) or computed tomography (CT) examinations according to the American guidelines.12 Exclusion criteria comprised allergy to proposed drugs, pregnancy, facet syndrome, bone lesions or previous spine surgery. During the study were excluded 18 patients who received surgical treatment. Finally 154 patients were considered in the results. Seventy-seven patients (control group; mean age 43.8 ± 11.2 years) underwent percutaneous steroid treatment while the remaining 77 patients (study group; mean age 44.4 ± 9.5 years) received the same treatment with the addition of intradiscal oxygen–ozone. Clinical evaluation was made at presentation and during follow-up by a clinical neuroradiologist with 30 years' experience using a visual analogue scale (VAS) questionnaire with scores ranging from 0 to 10, classifying as successful a pain value no greater than 2, and unsuccessful otherwise. The neuroradiologist was blinded to treatment modalities. In all patients (control group and study group) MR exams were performed before the treatments and in the follow-up at second, fourth and sixth months.
MR protocol
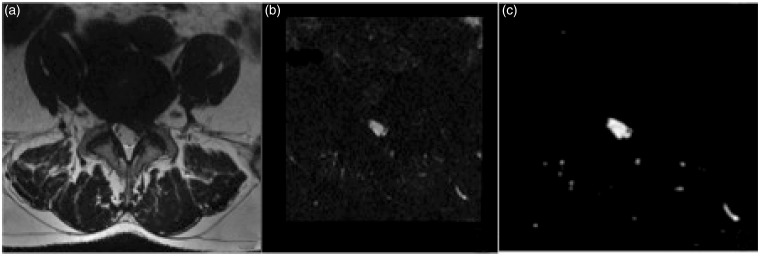
The MR exams were performed using GE Healthcare Signa EXCITE 1.5T with a phased-array spine coil. Axial T2 weighted images (WIs) were acquired with a field of view (FOV) of 17 cm, with 4000/108/4 (TR/TE/NEX) matrix (256 × 192), slice thickness 5 mm and spacing 1 mm. Sagittal FSE-T2 and T2 fat-WIs were acquired with FOV of 26 cm and the remaining parameters of axial T2-WI. Sagittal SE-T1-WIs were acquired with 500/20/2 (TR/TE/NEX) and with same remaining parameters of sagittal FSE-T2 and T2 fat-WI. DWIs were obtained in the sagittal and the axial plane by using isotropic multishot spin-echo-planar MR imaging with 1215/80/6 (TR/TE/NEX) matrix, 128 × 128 for obtaining a good signal to noise ratio13 and with the same slice thickness, spacing and FOV of T2 and T1 WIs. DWI acquisition time was about 6 min (Figure 1). The DWI images were acquired with a b value of 0 s/mm2 and 400 s/mm2 for minimizing diffusion-related loss of signal intensity in disc tissue and subsequent inaccuracy in ADC measurement.14,15
Figure 1.
Axial MR images T2 (a), DWI (b value = 400) (b) and ADC map (c) at the presentation of 38-year-old man suffering from lateral leg pain due to left intraforaminal disc herniation. In this case, before percutaneous treatment, the ADC map does not show hyperintense signal indicative of T2–shine through effect.
MR: magnetic resonance; DWI: diffusion-weighted image; ADC: apparent diffusion coefficient.
Qualitative image analysis
Two neuroradiologists, respectively with 25 and 6 years' experience, blinded to the patients' administered treatment, independently reviewed MR images at the presentation and in the follow-up controls. The T2–shine through effect was identified in DWI images when compared with corresponding ADC maps with a three-point scale: 1) absence: typically patients with dehydrated discs; 2) presence: when patients showed microcystic areas; 3) not evaluable: when T2–shine through effect was present on DWI sequence, but not recognizable from the homogeneous T2 signal inside hydrated discs on an ADC map (Figure 2).
Figure 2.
Axial T2 (a) image of 39-year-old woman with low back pain due to protrusion ‘bulging disc’ in L4–L5 and stenosis of the spinal canal. In this exam, performed in the second month of MRI follow-up after O2–O3 discolysis, the normal T2 signal of the disc in DWI image (b value = 400) (b) and ADC map (c), it is not recognizable from microcysts due to percutaneous treatment. This case was classified as DWI signal score 3.
MRI: magnetic resonance imaging; DWI: diffusion-weighted image; ADC: apparent diffusion coefficient.
Quantitative image analysis
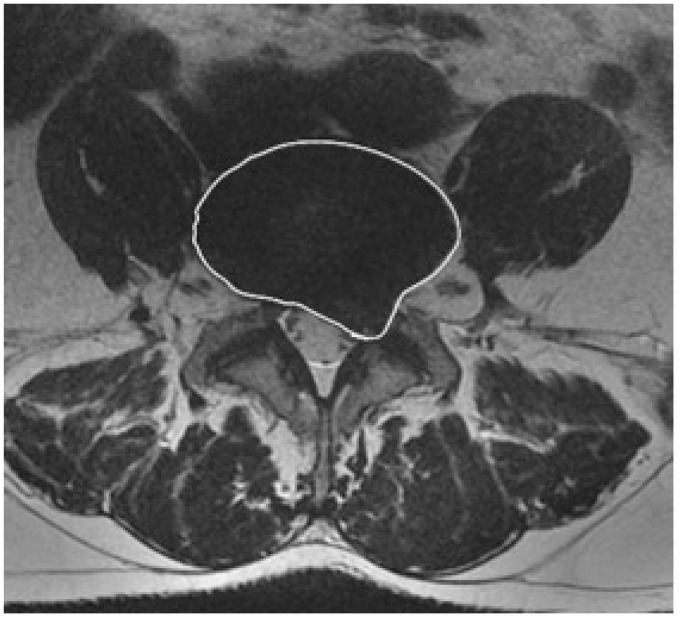
The ADC values were calculated through small, round regions of interest (ROIs) measuring 40–50mm2 within the central portion of the disc on the DWI images in the patients classified as DWI/ADC signal score 1 and 3 (absence and not evaluable). In the patients classified as DWI/ADC signal score 2 (presence) the ROI was measured in the area that included the microcystic area. Intervertebral disc volumetric analysis (IDVA) was obtained on FSE-T2-WI using Osirix® 4.1. Entire disc and herniated parts were included in the ROI on all slice of axial images (Figure 3).
Figure 3.
Axial MR image of the patient described in Figure 1. FSE T2-weighted MR image shows entire disc and herniated parts included in the ROI for IDVA.
(MR: magnetic resonance; FSE: fast-spin echo; ROI: region of interest; IDVA: intervertebral disc volumetric analysis.)
Matching between study and control groups
Before treatment, the clinical neuroradiologist matched study and control group patients to exclude potential confounding factors, according to the criteria of same sex, age (differing by no more than ±5 years) and disc level, similar body mass index (BMI) (differing by no more than ±5 kg/m2), same type of disc herniation (herniated discs were classified according to the American guidelines12) and DWI/ADC signal score. At presentation, no patients showed DWI/ADC signal score 2 and 3. For 11 patients from the study group, no matching control subject could be found, resulting in 66 matched pairs.
Data and statistical analysis
The intra- and interobserver reliability of the MRI evaluations for qualitative analysis was estimated using agreement percentage and kappa statistics according to Landis and Koch.16 A consensus readout was performed after all the data were collected. Observer agreement in volume and DWI/ADC measurements were assessed by using intraclass correlation coefficients (ICCs) and by calculating the mean difference between raters and the 95% confidence interval (CI). For comparison of categorical variables the χ2 test was used while for quantitative variables an unpaired two-tailed t test was used. All analyses were also performed by using multiple logistic regression analysis and analysis of covariance to check forthe influence of age, sex, injection level, BMI and herniation volumes as covariates. SPSS version11.5 (SPSS, Chicago, IL) was used for all calculations.
Results
Intraobserver agreement was ‘excellent’ for both readers, with kappa values ranging from 0.95 to 1 and 0.87 to 0.93, while interobserver agreement ranged from ‘substantial’ to ‘excellent’, with kappa values ranging from 0.65 to 0.84 and 0.63 to 0.82 respectively for herniation type and DWI/ADC signal score analysis.
Comparison of study and control group outcomes
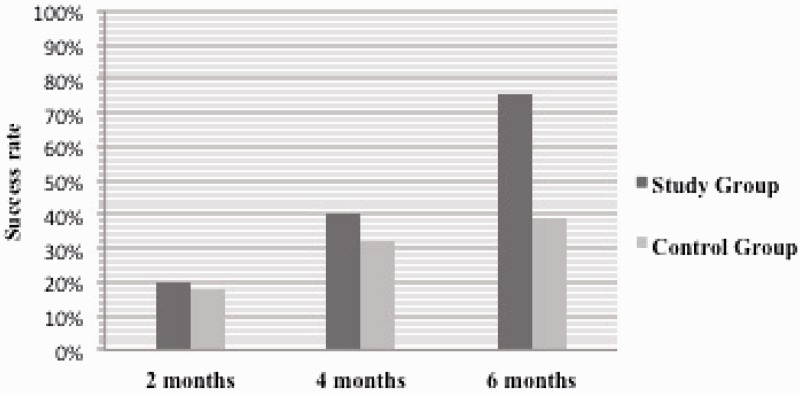
At two months the treatment was successful in 15 (responders 19.5%) of 77 study group patients (95% CI: 11.3%, 30.08%) and in 14 (responders 18.1%) of 77 control group patients (95% CI: 10.3%, 28.6%) with no statistically significant difference in terms of pain reduction between the two groups (χ2 = 0.028, p = .86). Even at four months after treatment there was no statistically significant difference (χ2 = 0.98, p = .32), with a successful rate in 31 (responders 40.2%) of the study group patients (95% CI: 29.2%, 52.05%) and in 25 (responders 32.4%) of the control group patients (95% CI: 22.2%, 44.09%). Only at the six-month follow-up was the successful rate between the two groups as statistically significant (χ2 = 31.31, p<.001) and in particular 58 (responders 75.3%) of 77 study group patients (95% CI: 64.1%, 84.4%) compared with 30 (responders 38.9%) of 77 control group patients (95% CI: 28.04%, 50.7%) (Figure 4). No major or minor complications were observed during or after the procedures.
Figure 4.
Graph shows outcomes of study and control group, during the follow-up of six months, according to the pain score. The success rate difference becomes statistically significant only in the sixth month of follow-up, when the procedure was successful in 75.3% of the study group and in 38.9% of the control group (p < .001).
Qualitative image analysis
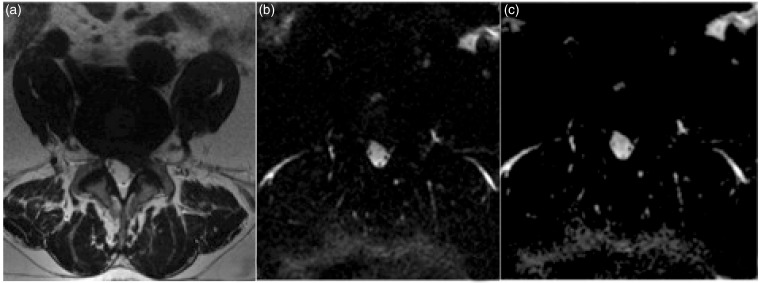
In the second month MRI follow-up, DWI signal intensity was statistically significantly different between the two groups (χ2 = 31.86, p = .00001, p = .0009); in particular the data analysis confirmed DWI/ADC signal score 2 with statistical significance in 29 (37.6%) non-responders of 77 study group patients (95% CI: 26.8%, 48%) (Figure5) and in six responders of the same group.
Figure 5.
Axial T2 FSE (a) and DWI (b value=400) (b) images with corresponding ADC map (c) performed in the second month of MRI follow-up. Axial DWI image (a) and ADC map (c) show the average water diffusivity of the annulus fibrosus and nucleus pulposus with hyperintense signal within the disc compatible with T2–shine through effect and DWI signal score 2.
FSE: fast-spin echo; DWI: diffusion-weighted image; ADC: apparent diffusion coefficient; MRI: magnetic resonance imaging.
In the fourth month MRI follow-up, the DWI signal was also different between the two groups with statistical significance (χ2 = 73.10, p = .000001, p = .0007); significant DWI/ADC signal score 2 was present in 27 (35.06%) responders of the study group (95% CI: 18%, 52%), but also found was a significant DWI/ADC signal score 1 in 24 (31.16%) non-responders of 77 control group patients (95% CI: 20.9%, 41%) and a significant DWI/ADC signal score 3 in 24 (31.16%) non-responders of 77 control group patients (95% CI: 20.9%, 41%). DWI/ADC signal score 2 was also significant (effect size = 0.58, good power=0.89) in the sixth month MRI follow-up (χ2 = 131.15, p = .0, p = .000006) with a significant presence in 53 (68.83%) responders of 77 study group patients (95% CI: 57%, 78%).
In this MRI follow-up, also significant was DWI/ADC signal score 1 in 27 (35.06%) responders and 38 (49.35%) non-responders of 77 control group patients (95% CI respectively: 24%, 45% and 38%, 60%).
Analysis of the 66 matched pairs yielded results consistent with those yielded by the overall analysis. In these 66 pairs DWI/ADC signal score 2 was more common in the MRI follow-up of the study group and in particular in the sixth month after ozonolysis (χ2 = 117.02, p = .0000003, effect size = 0.65, good power = 0.86). Intraobserver agreement was ‘excellent’ for both readers, with kappa values ranging from 0.84 to 0.90, while interobserver agreement ranged from ‘substantial’ to ‘excellent’, with kappa values ranging from 0.69 to 0.81 in DWI/ADC signal score analysis. The consensus reading included all 144 patients.
Quantitative image analysis
The intraclass correlation coefficient between the two readers for the volume measurements was 0.97 (95% CI: 0.95, 0.99) while for ADC measurements it was 0.98 (95% CI: 0.97, 0.99). The mean interobserver differences for the measurement of disc volume were less than 1 mm3 in the MRI follow-up while ADC measurement was 0.03 × 10⁻³ mm2/s. Disc and herniation volume reductions evaluated with IDVA were significantly more frequent in the responders group than in the non-responders group. Student's t test showed a statistically significant reduction at around six months of follow-up (p < .05) after O2–O3 discolysis, with an average reduction of whole discs with herniation volumes around 4–5% in 58 responders of 77 study group patients compared with 30 responders of 77 control group patients. ADC analysis of the ROIs before and after treatments showed statistically significant difference between responders and non-responders in terms of water diffusion in study and control groups; in particular already in the second month follow-up (p < .05).
Diagnostic performance of T2–shine through effect in DWI
Diagnostic accuracy, sensitivity, specificity, positive predictive value (PPV) and negative predictive value (NPV) of T2–shine through effect are detailed in Table 1. In the second month the area under the receiver operating characteristic curve (AUC) was already 97.1% for identifying responders in the study group with specificity of 83.2% and PPV of 90.5%.
Table 1.
Diagnostic performance of T2 – shine through effect in DWI for detecting response to percutaneous treatments.
| n | TP | TN | FP | FN | AUC % (95% CI) | Sensitivity % (95% CI) | Specificity % (95% CI) | Accuracy % (95% CI) | NPV % (95% CI) | PPV % (95% CI) | |
|---|---|---|---|---|---|---|---|---|---|---|---|
| Second month | |||||||||||
| Study group | 77 | 35 | 19 | 4 | 19 | 97.1 (94.9–99.4) | 65.2 (64.2–66.8) | 83.2 (82.2–84.4) | 70.1 (69.3–71.4) | 50.6 (49.3–51.4) | 90.5 (89.3–91.5) |
| Control group | 77 | 6 | 39 | 8 | 24 | 96.2 (95.4–97.8) | 22.2 (21.5–23.2) | 83.4 (82.5–84.7) | 58.2 (57.4–59.7) | 62.1 (61.1–63.2) | 43.4 (42.1–44.5) |
| Fourth month | |||||||||||
| Study group | 77 | 41 | 19 | 1 | 16 | 97.7 (96.1–97.4) | 72.3 (71.1–73.4) | 95.4 (94.2–95.5) | 78.2 (77.2–78.7) | 54.2 (53.1–55.6) | 98.3 (97.1–99.4) |
| Control group | 77 | 6 | 41 | 7 | 24 | 97.4 (96.1–98.4) | 22.2 (21.3–23.6) | 61.5 (60.2–62.7) | 62.3 (61.1–63.9) | 63.4 (62.4–64.7) | 46.2 (45.3–47.8) |
| Sixth month | |||||||||||
| Study group | 77 | 53 | 19 | 4 | 1 | 98.7 (97.3–99.4) | 98.1 (97.2–99.2) | 83.2 (82.2–84.5) | 94.6 (93.7–94.2) | 95.7 (94.1–96.7) | 93.6 (92.1–94.8) |
| Control group | 77 | 2 | 65 | 3 | 7 | 98.5 (97.1–99.3) | 22.4 (21.5–23.8) | 96.5 (95.1–97.7) | 87.7 (86.1–88.9) | 91.2 (90.2–92.8) | 42.6 (41.2–43.9) |
TP: true positive; TN: true negative; FP: false positive; FN: false negative; AUC: area under the receiver operating characteristic curve; CI: confidence interval; NPV: negative predictive value; PPV: positive predictive value.
Discussion and conclusion
In our study, 58 of 77 patients (approximately 75%) treated with O2–O3 discolysis had successful clinical outcomes and statistically significant herniation volume reduction (p < .05) compared with 30 (38.9%) of 77 control group patients with a follow-up period of six months. Moreover we observed an increment of signal intensity in exponential DWI images (b = 0, b = 400) of the treated discs with ozonolysis confirmed by corresponding ADC maps (T2–shine through effect) already in the second month of MRI follow-up.
Out of 53 responders of the study group with DWI/ADC signal score 2, 35 patients, who in the sixth month MRI follow-up showed significant volume reduction of the hernia, showed T2–shine through already in the second month. In the control group none of six (7.79%) patients with DWI/ADC signal score 2 at the second month MRI follow-up recovered but three patients (3.89%) with DWI/ADC signal score 3 and 27 (35.06%) patients with DWI/ADC signal score 1 became responders at the sixth month. In the fourth month MRI follow-up we observed in particular an increment of sensibility (95.4%) in the ability of DWI to highlight the response to treatment. In this MRI follow-up the AUC was 97.7% for identifying responders in the study group. In the sixth MRI follow-up, T2–shine through effect was detected in 53 of 77 (68.8%) study group patients in comparison with two of 77 (2.59%) patients in the control group. The DWI sequence obtained, in the study group, sensitivity of 98.1%, specificity of 83.2% with an AUC of 98.7%.
Furthermore, in the sixth month of MRI follow-up, T2–shine through effect was statistically significant in 53 of 58 responders of study group patients and statistical significance was not found in 38 non-responders of 77 control group patients, confirming the pharmacological actions of O2–O3 mixture on the discs.
Nevertheless, a significant number of patients continue to show symptoms after ozone therapy, possibly requiring surgery after a few months. Therefore, it would be useful for both patients and clinicians to know the likely outcome of non-surgical treatments and the likelihood of future surgery. DWI sequence, already used in the evaluation of water diffusivity of the discs treated with ozone nucleolysis,9 has application for predicting shrinkage of lumbar disc herniation; in addition we have tried to show that the T2–shine through effect in DWI may be useful in evaluating micro- and macrovacuolar degeneration with small halos of necrosis and interstitial oedema10,11,13 as a predictive sign of shrinkage of lumbar disc herniation. Specificity and PPV of T2–shine through effect in patients treated with O2–O3 discolysis already reached a high value in the second month of MRI follow-up, respectively of 83.2% and 90.5%. On the basis of our data, in the first six months after intradiscal O2–O3, we have not documented the process of dehydration and vacuum phenomena, in contrast to the previous study of Iliakis.6 The limitation of our study is the use of single shot echo-planar imaging; in fact some studies show that multi-diffusion MR imaging with this technique is not useful for imaging the spine because of the inhomogeneous magnetic environment and the high lipid content of the vertebral bodies, which can lead to strong geometric distortions and chemical shift artefacts.14 Apparent diffusion coefficient (ADC) obtained at 1.5 T from corresponding diffusion tensor scans using line scan diffusion imaging (LSDI) is considerably more robust than other common sequences in the presence of global motion and susceptibility differences, giving high quality DWI apparent diffusion coefficient ADC and anisotropy maps in the human spine.16 It would be very interesting eventually to correlate anisotropy with the severity of degenerative change to determine whether there are significant changes in diffusion anisotropy in discs at different stages after ozone therapy.
In conclusion, we report a statistically significant increment of T2–shine through effect from the second month MRI follow-up after percutaneous treatments with ozonolysis. Therefore, our data demonstrated that in early MRI follow-up of the intervertebral discs treated with ozone, the presence of T2–shine through effect on DWI images provides additional and early diagnostic information about the water diffusivity and predicts shrinkage of lumbar disc herniation; furthermore it may be useful in clinical practice when qualitative assessment of DWI during imaging interpretation by radiologists17 is of critical importance as quantitative analysis of DWI requires additional time.
Funding
This research received no specific grant from any funding agency in the public, commercial or not-for-profit sectors.
Conflict of interest
The authors declare no conflict of interest.
References
- 1.Guarnieri G, Vassallo P, Pezzullo MG, et al. A comparison of minimally invasive techniques in percutaneous treatment of lumbar herniated discs. Neuroradiol J 2009; 22: 108–121. [DOI] [PubMed] [Google Scholar]
- 2.Andreula CF, Simonetti L, Leonardi M, et al. Minimally invasive oxygen-ozone therapy for lumbar disk herniation. Am J Neuroradiol 2003; 24: 996–1000. [PMC free article] [PubMed] [Google Scholar]
- 3.Splendiani A, Ferrari F, Barile A, et al. Occult neural foraminal stenosis caused by association between disc degeneration and facet joint osteoarthritis: Demonstration with dedicated upright MRI system. Radiol Med 2014; 119: 164–174. [DOI] [PubMed] [Google Scholar]
- 4.Gallucci M, Limbucci N, Paonessa A, et al. Degenerative disease of the spine. Neuroimaging Clin N Am 2007; 17: 87–103. [DOI] [PubMed] [Google Scholar]
- 5.Splendiani A, Puglielli E, De Amicis R, et al. Spontaneous resolution of lumbar disk herniation: Predictive signs for prognostic evaluation. Neuroradiology 2004; 46: 916–922. [DOI] [PubMed] [Google Scholar]
- 6.Iliakis E, Valadakis V, Vynios DH, et al. Rationalization of the activity of medical ozone on intervertebral disc: A histological and biochemical study. Riv Neuroradiol 2001; 14(Suppl. 1): 23–30. [Google Scholar]
- 7.Muto M. Intradiscal and intramuscular injection of oxygen–ozone: Pathological evaluation. Work in Progress. Riv Ital Ossigeno-Ozooterapia 2004; 3: 7–13. [Google Scholar]
- 8.Iliakis E. Ozone treatment in low back pain. Orthopaedics 1995; 1: 29–33. [Google Scholar]
- 9.Splendiani A, Perri M, Conchiglia A, et al. MR assessment of lumbar disk herniation treated with oxygen-ozone diskolysis: The role of DWI and related ADC versus intervertebral disk volumetric analysis for detecting treatment response. Neuroradiol J 2013; 26: 347–356. [DOI] [PMC free article] [PubMed] [Google Scholar]
- 10.Holder CA, Muthupillai R, Mukundan S, et al. Diffusion weighted MR imaging of the normal human spinal cord in vivo. Am J Neuroradiol 2000; 21: 1799–1806. [PMC free article] [PubMed] [Google Scholar]
- 11.Kurunlahti M, Jauhiainen J, Karppinen J, et al. Correlation of diffusion in lumbar intervertebral discs with occlusion of lumbar arteries: a study in adult volunteers. Radiology 2001; 221: 779–786. [DOI] [PubMed] [Google Scholar]
- 12.Fardon DF, Milette PC. Nomenclature and classification of lumbar disc pathology. Recommendations of the Combined Task Forces of the North American Spine Society, American Society of Spine Radiology, and American Society of Neuroradiology. Spine (Phila Pa 1976) 2001; 26: E93–113. [DOI] [PubMed] [Google Scholar]
- 13.Kerttula L, Jauhiainen J, Koivula A, et al. Apparent diffusion coefficients and T2 relaxation time measurements to evaluate disc degeneration: A quantitative MR study of young patients with previous vertebral fracture. Acta Radiol 2001; 42: 585–591. [DOI] [PubMed] [Google Scholar]
- 14.Bammer R, Herneth AM, Maier SE. Line scan diffusion imaging of the spine. Am J Neuroradiol 2003; 24: 5–12. [PMC free article] [PubMed] [Google Scholar]
- 15.Hsu EW, Setton LA. Diffusion tensor microscopy of the intervertebral disc annulus fibrosus. Magn Reson Med 1999; 41: 992–999. [DOI] [PubMed] [Google Scholar]
- 16.Landis RJ, Koch GG. The measurement of observer agreement for categorical data. Biometrics 1977; 33: 159–174. [PubMed] [Google Scholar]
- 17.Barile A, Limbucci N, Splendiani A, et al. Spinal injury in sport. Eur J Radiol 2007; 62: 68–78. [DOI] [PubMed] [Google Scholar]


