Abstract
Imaging plays a vital role in evaluation of skull base pathologies as this region is not directly accessible for clinical evaluation. Computerized tomography (CT) and magnetic resonance imaging (MRI) have played complementary roles in the diagnosis of the various neoplastic and non-neoplastic lesions of the skull base. However, CT and conventional MRI may at times be insufficient to correctly pinpoint the accurate diagnosis. Advanced MRI techniques, though difficult to apply in the skull base region, in conjunction with CT and conventional MRI can however help in improving the diagnostic accuracy. This article aims to highlight the importance of advanced MRI techniques like diffusion-weighted imaging, susceptibility-weighted imaging, perfusion-weighted imaging, and MR spectroscopy in differentiation of various lesions involving the skull base.
Keywords: Skull base, magnetic resonance imaging, diffusion-weighted imaging, perfusion-weighted imaging, susceptibility-weighted imaging, magnetic resonance spectroscopy
Introduction
Computerized tomography (CT) scans and conventional magnetic resonance imaging (MRI) have been routinely used in imaging intracranial mass lesions. High resolution CT and standard T1 and T2 weighted sequences supplemented with gadolinium in characterizing skull base lesions based on their tissue characteristics and anatomical location are the mainstay in a radiological approach towards skull base lesions. However, there are several ambiguous cases in this difficult region, where further information can be sought from diffusion-weighted imaging (DWI), susceptibility-weighted imaging (SWI), perfusion-weighted imaging (PWI), and MR spectroscopy (MRS) that can lead to a more specific diagnosis and also improve confidence in the radiological diagnosis. Advanced MRI techniques like DWI, SWI, PWI, and MRS give much more information regarding tissue characteristics of the lesion, including their cellularity, organization, vascularity, neoangiogenesis, microbleeds, calcifications, and metabolic changes. This article aims to highlight the importance of advanced MRI techniques like DWI, SWI, and PWI in differentiation of various lesions involving the skull base.
Meningioma
The skull base locations from where meningiomas can arise include olfactory groove, sphenoid wing, suprasellar, petroclival, cerebellopontine angle (CPA), and foramen magnum. They have characteristic CT and MRI appearance. On CT, they usually appear as hyperdense, often calcified lesions; on MRI, they are mostly isointense with gray matter on all sequences. Meningiomas show strong homogenous enhancement after contrast administration, but areas of necrosis especially in large lesions can also be seen. However, these classical findings may not always be seen.
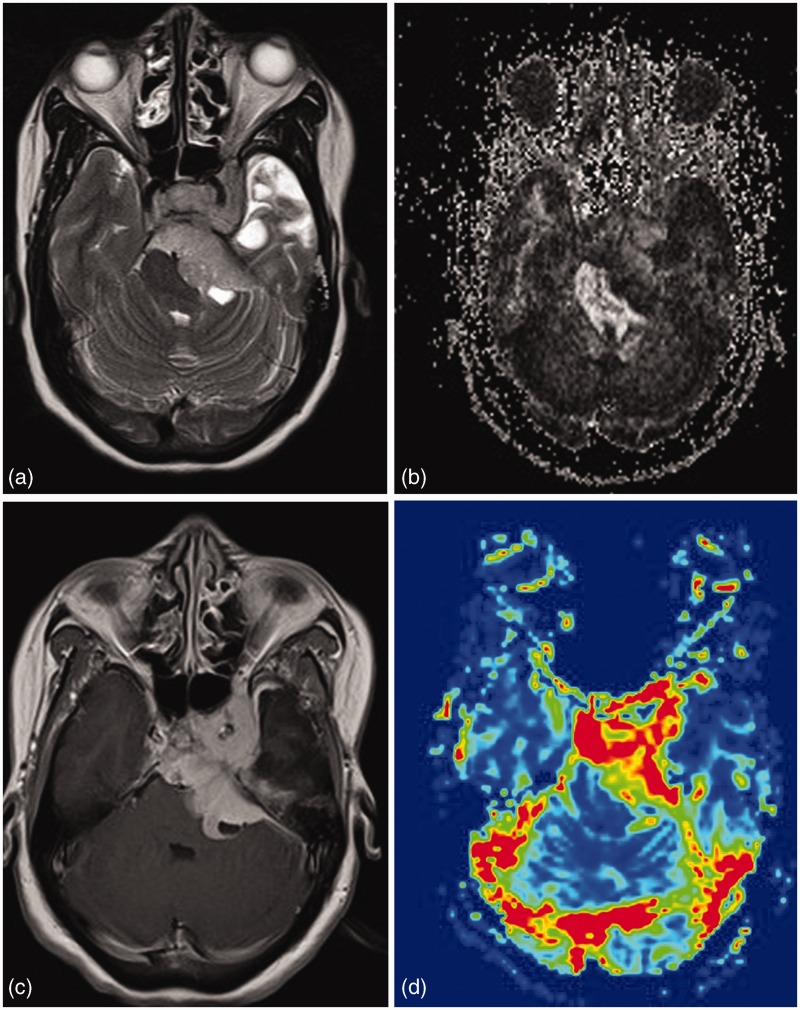
Meningiomas are highly vascular tumors and show high relative cerebral blood volume (rCBV) values on MR perfusion.1–3 Meningothelial, fibrous, and anaplastic meningiomas show lower mean rCBV values (mean rCBV = 5–7) as compared to angiomatous meningiomas (mean rCBV = 11.9).2–4 The time intensity curve shows minimal or no return to baseline level due to absence of the blood–brain barrier in neovessels of these tumors and thus the high rate of extracapillary leakage of contrast material.1 MR perfusion can reliably narrow down the differential diagnosis in cases of extra-axial lesions with similar conventional imaging findings (Figure 1).
Figure 1.
Left paracavernous meningioma. A T2 hyperintense lesion in left cavernous sinus region extending into posterior fossa via Meckel’s cave into prepontine and left cerebellopontine angle cistern. Lesion reveals varied FA values in different part of lesion. High perfusion differentiated it from other diagnosis like schwannomas.
Diffusion tensor metrics (Table 1) may help to differentiate among atypical, fibroblastic, and benign meningiomas.5 Although all will show decreased diffusivity, atypical meningiomas will have increased fractional anisotropy (FA) with increased linear and planar anisotropy, and lower e3 (e3 eigenvalue) values, while the fibroblastic meningiomas will have increased FA and planar anisotropy, decreased linear anisotropy, and lower e3 values and other benign meningiomas will show decreased FA, decreased linear and planar anisotropy, and higher e3 values.
Table 1.
Diffusion tensor characteristics of meningioma subtypes5.
| Meningiomas | MD | FA | CL | CP | e3 |
|---|---|---|---|---|---|
| Atypical | Low | High | High | High | Low |
| Fibroblastic | Low | High | Low | High | Low |
| Benign | Low | Low | Low | Low | High |
MD: mean diffusivity; FA: fractional anisotropy; CL: linear anisotropy; CP: planar anisotropy; e3: e3 eigenvalue.
Apart from this, diffusion tensor information may help to assess the consistency of meningiomas preoperatively. The most accurate model for predicting a hard-consistency meningioma is an isointense signal in mean diffusivity maps, a hyperintense signal in FA maps, and an FA value of more than 0.3.6
MRS may show high alanine and low N-acetylaspartate peaks in meningiomas but it is difficult to perform due to their location near the skull base and bone artefacts especially in the cerebellopontine angle, thus making this technique limited mainly to large lesions.7
Granuloma
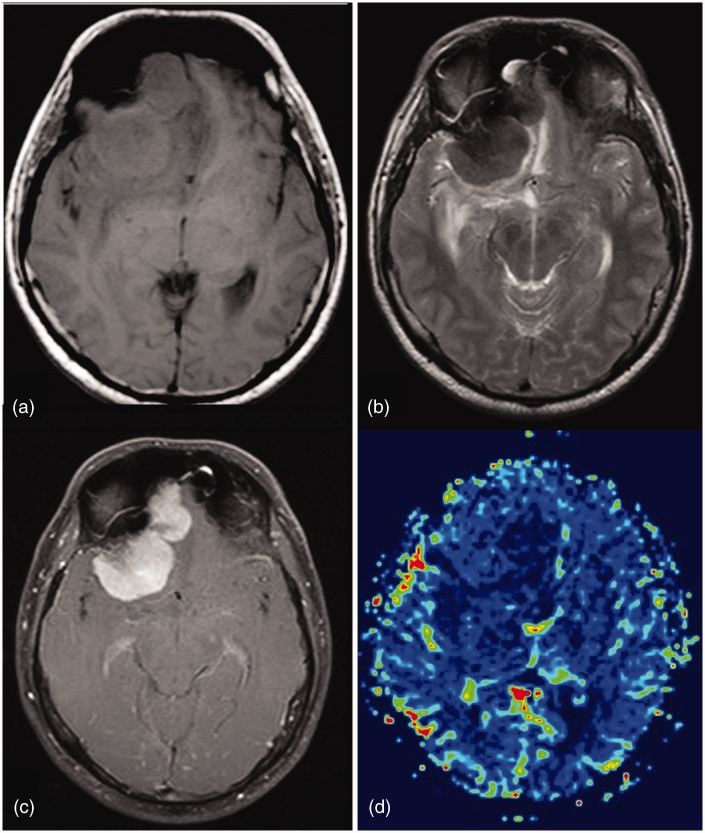
Extra-axial granulomas, especially infective fungal granulomas, may mimic meningiomas on CT and conventional MRI. Granulomas appear hypointense on T2-weighted imaging and show facilitated diffusion.8 SWI or T2* gradient sequence may show diffuse mild blooming due to free radical or mineral deposition.9 They show contrast enhancement, but on perfusion rCBV will be low. These lesions have low vascularity but the vessels are leaky without any blood brain barrier. So they will show low rCBV on perfusion weighted imaging and good contrast enhancement on post contrast T1 weighted imaging.10 This helps to differentiate them from meningiomas which show significantly elevated rCBV (Figure 2).
Figure 2.
Aspergilloma. A well-marginated extra-axial lesion based on right sphenoid wing which is mildly hyperintense on T1, markedly hyperintense on T2 with perilesional edema and contrast enhancement. T2* perfusion reveals lesion to be hypoperfused. Marked T2 hypointensity and low perfusion are pointers towards a granuloma.
Plasmacytoma
Plasma cell tumors involving the skull base are commonly a manifestation of multiple myeloma but a solitary plasmacytoma also rarely occurs and may pose considerable diagnostic dilemma. They appear hyperdense on CT compared to adjacent soft tissues as well as the brain and cause osteolytic involvement of the skull base with variable aggressive bone destruction (Figure 3). The epicenter of the lesion in the diploic space helps in differentiation from other extra-axial lesions. It shows intermediate signal intensity on T1 and T2 weighted imaging and homogenous contrast enhancement. DWI may show restriction of diffusion or low apparent diffusion coefficient (ADC) values as these tumors are hypercellular, small, round cell tumors with a high nucleo-cytoplasmic ratio.9 Fragments of destroyed bone may be seen as foci of blooming on SWI.
Figure 3.
Left middle cranial fossa paracavernous lesion. Low T2 signal and low ADC values indicate high cellularity. Contrast enhancement with low perfusion seen. High cellularity and low perfusion supports the final HPE diagnosis of plasmacytoma.
Glomus jugulare paragangliomas
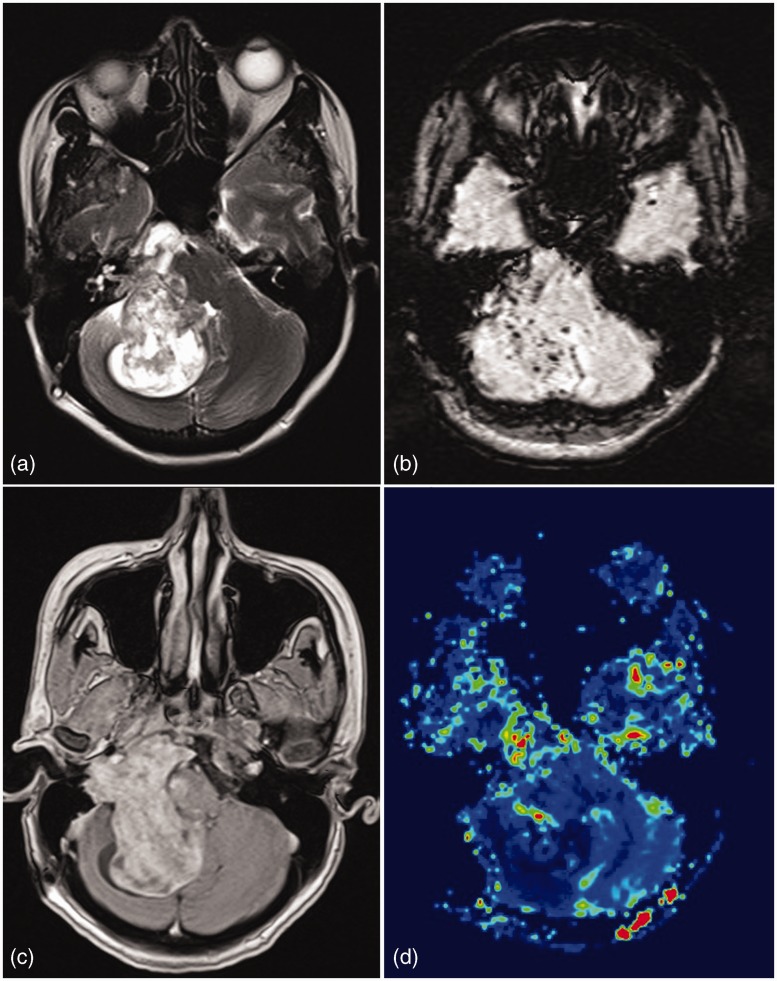
Glomus jugulare tumors account for about 80% of tumors of the jugular foramen. They arise from paraganglia in the adventitia of the jugular bulb, the superior ganglion of the Xth nerve, or along the Jacobson and Arnold nerves. Most glomus jugular paragangliomas are benign but locally aggressive; malignant degeneration occurs in approximately 3% to 4% of cases.11 On CT small lesions reveal demineralization of the cortical margin of the jugular plate or carotico-jugular spine while larger lesions show moth eaten destruction of bone. MRI shows unique salt and pepper appearance on T1 and T2 weighted imaging representing foci of hemorrhage (salt) and flow voids of feeding artery branches (pepper). T2* gradient sequence/SWI may show foci of blooming which may represent hemorrhage/destroyed bone.12 Perfusion MRI will typically demonstrate high rCBV due to highly vascular nature of this tumor (Figure 4). This is in contrast to other commonly encountered lesion in the jugular foramen which is schwannoma which will reveal low rCBV.
Figure 4.
Paraganglioma. An intensely enhancing right jugular fossa mass. Very high perfusion supports the diagnosis of glomus jugulare paragangliomas.
Cranial nerve schwannomas
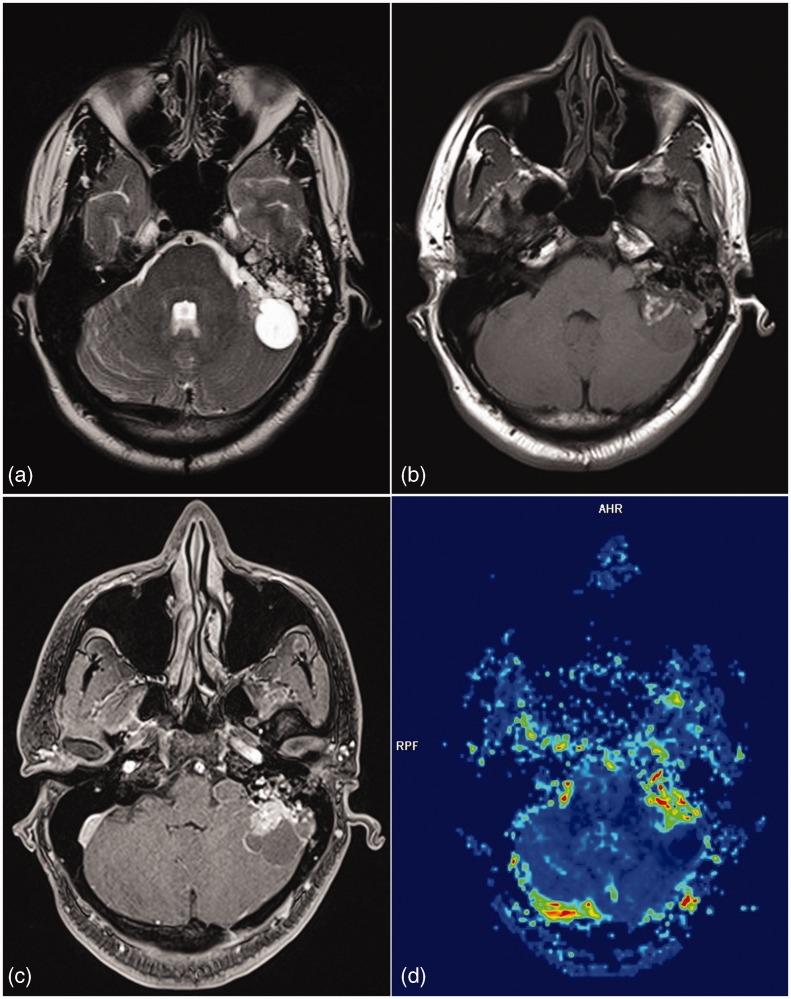
The most common cranial nerve schwannoma is vestibular schwannoma. It appears iso/hypointense on T1 and iso/hyperintense on T2-weighted images (T2WI) with contrast enhancement (Figure 5). Areas of cystic changes may be seen representing areas with predominant Antoni B cells. A common differential diagnosis of vestibular schwannoma is meningioma. A tumor in the internal auditory canal (IAC) with dilation of the canal is highly suggestive of vestibular schwannoma. Signs such as the presence of hyperostosis, calcification, broad base of the tumor against the petrous temporal bone, and a dural tail may favor the diagnosis of a meningioma. However, both vestibular schwannoma and meningioma may show similar imaging features, and therefore approximately 25% of CPA meningiomas are mistaken for vestibular schwannoma. The differential diagnostic problems can be caused by larger schwannomas without an obvious intracanalicular part and with a dural tail (suggestive of meningioma) or by meningiomas with dural enhancement within IAC (suggestive of schwannoma).13 Even though both the tumors show intense contrast enhancement the difference in perfusion characteristics is because of increased vascularity of meningiomas which is low in schwannomas.14 Identification of microhemorrhages on T2* gradient sequence or SWI can help differentiate a schwannoma from a meningioma.15 The abnormal vascularity found in vestibular schwannoma is considered to be responsible for the development of microhemorrhages. From a histologic standpoint, the abnormal vascularity in vestibular schwannoma is characterized by focal sinusoidal dilations, hyaline thickening of vascular walls, and cavernous or telangiectatic formation. These changes are thought to predispose to the development of spontaneous thrombosis, necrosis, and formation of microhemorrhages in the tumor.16 The rCBV values evaluated with dynamic susceptibility perfusion MRI are reported to be significantly lower in schwannomas than in meningiomas with the mean rCBV values 3.23 and 8.02, respectively.2
Figure 5.
Schwannoma. A heterogeneous enhancing T2 hyperintense extra-axial lesion seen in middle and posterior cranial fossa on right side extending via foramen ovale in the infratemporal fossa, along the mandibular nerve. Multiple microbleeds on SWI and low perfusion support the diagnosis of schwannoma and are of great value in characterization of less typical lesions.
Endolymphatic sac tumors (ELSTs)
Endolymphatic sac tumor is a rare slow growing posterior fossa cerebellopontine angle neoplasm arising from the endolymphatic sac. It is locally aggressive and invasive having an excellent prognosis after complete resection. These tumors are commonly mistaken with other destructive lesions of the temporal bone. High incidence of these tumors has been reported in Von Hippel–Lindau disease. On MR examination, the tumor shows a speckled appearance with multiple foci of high signal intensity scattered throughout the tumor on T1-weighted images (T1WI), which may be related to the presence of breakdown products of hemorrhage, cholesterol clefts, and proteinaceous cysts with heterogeneous signal intensity on T2WI.17,18 Small ELSTs (<3 cm) are seen as destructive lesions in the retro-labyrinthine petrous bone centered at the external opening of the vestibular aqueduct. These tumors usually show a peripheral rim of bone suggesting their expansile nature. The tumor contains intratumoral bony spicules and reticulations representing sequelae of active bone destruction or less likely, new bone formation.19 SWI may therefore show foci of blooming while perfusion MR will show increased rCBV due to hypervascular nature of the tumor (Figure 6).
Figure 6.
Endolymphatic sac tumor. A left cerebellopontine angle mass with bony destruction. T1 hyperintensities and increased perfusion suggest the diagnosis of endolymphatic sac tumor apart from the location of the lesion.
Cholesteatoma (epidermoid cyst)
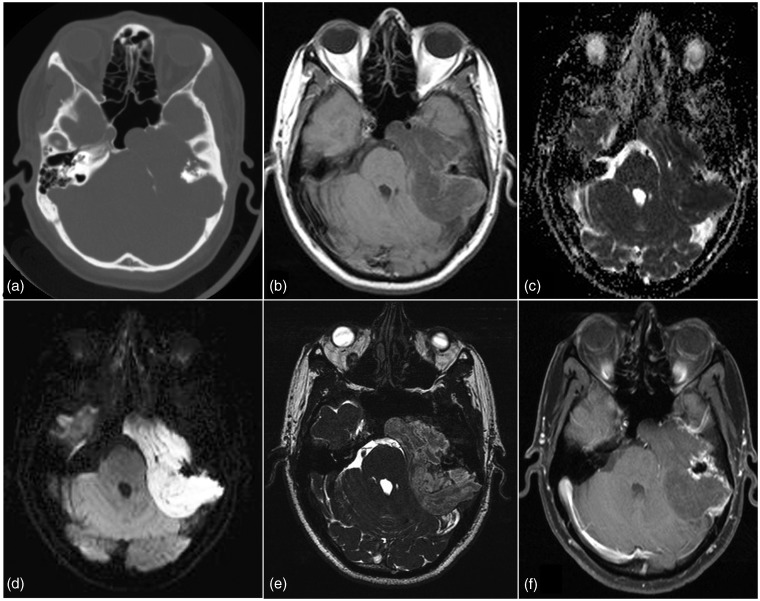
Cholesteatoma of the petrous apex may be congenital or acquired lesions. Congenital cholesteatoma may arise from ectopic rests of the ectoderm. Continuous exfoliation and desquamation of the ectoderm leads to expansion of the lesion. It is lined by keratinizing stratified squamous epithelium. It can arise from anywhere in the temporal bone including the middle ear, mastoid, petrous apex, squama of the temporal bone, within the tympanic membrane, or in the external auditory canal. Origin of acquired cholesteatomas is debated with a number of theories (squamous metaplasia of middle ear epithelium, migration of squamous epithelium from the external auditory canal via a tympanic membrane retraction pocket, etc.). On conventional MRI they appear iso/hypointense on T1WI and hyperintense on T2WI. DWI will show high signal intensity partly due to diffusion restriction and predominantly due to T2 shine through effect (Figure 7).20,21 Both echo planar imaging (EPI) and non-EPI based sequences have been used for evaluation of this lesion. Non-EPI DWI is particularly useful in case of recurrent or very small lesions due to fewer susceptibility artefacts, higher resolution, and thinner sections.22 In a recent study, the DWI propeller technique has been found to be better to detect small recurrent cholesteatomas.23
Figure 7.
Cholesteatoma. Left petrous T1 isointense lesion with CT revealing bony destruction with marginal sclerosis. Presence of diffusion restriction with low ADC values helped to arrive at the diagnosis of cholesteatoma. Mild peripheral contrast enhancement is also noted in this case.
Cholesterol granuloma
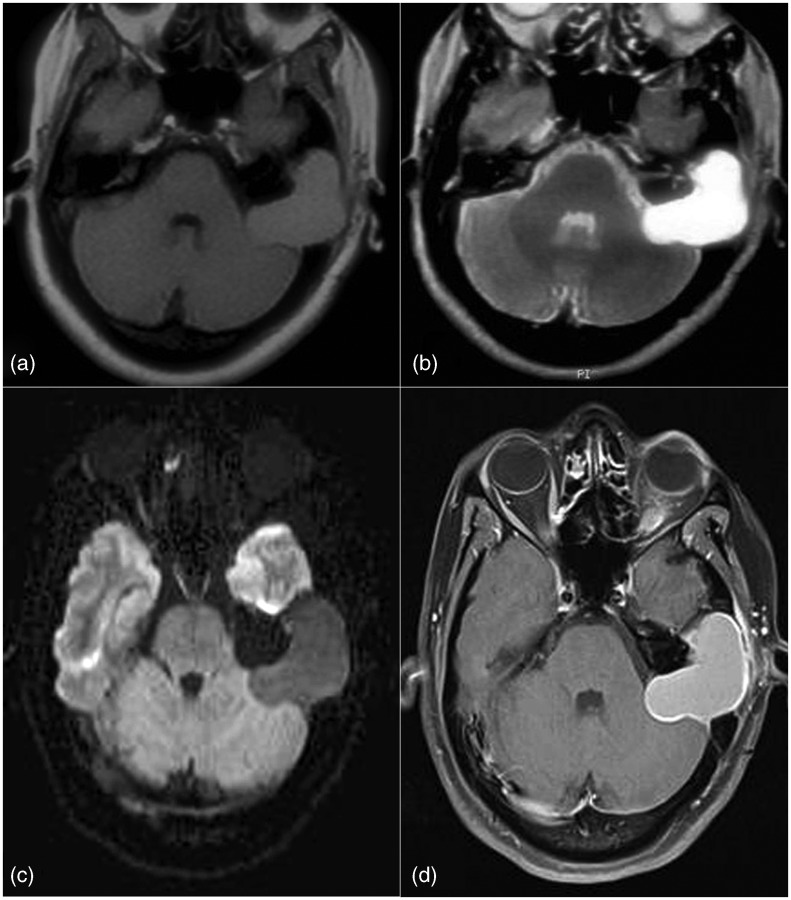
Petrous apex cholesterol granulomas are expansile, cystic lesions containing cholesterol crystals surrounded by foreign body giant cells, fibrous tissue reaction, and chronic inflammation. There are two theories regarding their origins. In first theory, the Eustachian tube dysfunction is thought to be the underlying abnormality which causes mucosal edema with repeated episodes of bleeding. While in the second theory the hyperplastic mucosa invades the underlying bone and exposes bone marrow, which in turn bleeds. The resulting degradation of hemosiderin and cholesterol causes an inflammatory granulomatous reaction.24 On imaging they present as an expansile lesion with clear high signal intensity on T1-weighted as well as on T2WI. This lesion does not display high signal intensity on diffusion-weighted sequences. A slight hyperintensity can, however, be seen due to a T2 shine through effect. However, signal intensity on an ADC map remains high in contrast to the drop of signal intensity in case of a cholesteatoma (Figure 8).20,24
Figure 8.
Cholesterol granuloma Left petrous lesion hyperintense on both T1 & T2 with no diffusion restriction or significant contrast enhancement.
Chondromatous lesions
Chordoma and chondrosarcoma are among common primary bone tumors arising within the skull base. Chordoma arises from notochordal remnants and is typically centered on the clivus, whereas chondrosarcoma is mesenchymal in origin and is typically centered on the petro-occipital fissure. This however is not pathognomonic.25 Microscopically, chordoma is a moderately cellular neoplasm composed of vacuolated physaliphorous cells arranged singly and in cords within a myxoid stroma. These usually do not show high mitotic activity, however in poorly differentiated chordomas mitotic activities may be high. Chondrosarcoma, histologically is distinct from chordoma, is composed of atypical chondrocytes with enlarged hyperchromatic nuclei set in an abundant cartilaginous matrix. Chondrosarcoma is graded from low to high, with higher grades showing high mitotic activities. Despite distinct histology and origin chordoma and chondrosarcoma may be difficult to distinguish from each other on conventional imaging.26 Both classic chordoma and chondrosarcoma show high intensity on T2WI. However, a poorly differentiated chordoma may show low T2 signal probably related to its high cellularity. There is no definite pattern of contrast enhancement that is able to distinguish between these tumor types. However diffusion weighted imaging may help in differentiating between these tumors. Chondrosarcoma is associated with the highest ADC values (mean ADC = 2051 ± 261 × 106 mm2/s), followed by classic chordoma (1474 ± 117 × 106 mm2/s) and poorly differentiated chordoma (875 ± 100 × 106 mm2/s).27 Striking differences in ADC may be attributable to the extracellular matrices of these tumors. The higher ADC values of chondrosarcomas, which have varying degrees of cellularity within a cartilaginous stroma, likely, reflect relatively free extracellular water motion (Figure 9). In the case of very low diffusion, the diagnosis of poorly differentiated chordoma may be considered because water motion is further reduced in this markedly more cellular tumor compared with classic chordoma and chondrosarcoma.
Figure 9.
Right petroclival lesion with bony destruction, punctuate calcifications and contrast enhancement. High facilitated ADC and low perfusion favor the diagnosis of chondromatous lesion.
Rosai–Dorfman disease
Rosai–Dorfman disease (sinus histiocytosis with massive lymphadenopathy) is an idiopathic benign disorder characterized by an abnormal proliferation of histiocytes. Intracranial or intraspinal involvement is seen in only 4% of cases.28 Due to the rarity of the disease, and the multiple differential considerations and non-specific imaging findings the diagnosis is usually based on pathological findings. However, the advanced MRI techniques help in narrowing the differentials. On conventional imaging it appears as a dural-based mass that is hyperdense on plain CT, isointense, or mildly hypointense on T1-weighted MRI and profoundly hypointense on T2WI, with significant post-contrast enhancement. These findings overlap with other conditions such as meningiomas, other meningeal tumors such as solitary fibrous tumor of the meninges, lymphoproliferative disorders, and infectious and non-infectious granulomas.29 The high FA value found in the disease is probably due to the structured arrangement of the dense fibrous tissue. DWI may show hypointensity which may be the result of a dominant T2 effect (“T2 blackout” phenomenon). These lesions show low ADC values due to fibrous stroma, which restrict water movement. The diffuse mild blooming noted on SWI within the lesion are most likely due to the free-radical or mineral deposition (manganese and non-heme iron) seen with chronic inflammation. These lesions usually show low perfusion, which helps in differentiating the disease from meningiomas, hemangiopericytomas, and solitary fibrous tumors of the meninges, which typically have markedly increased perfusion parameters. Thus, combining the findings of conventional cross-sectional imaging with high FA, low ADC, mild blooming on SWI, and decreased rCBV can help to make the diagnosis of Rosai–Dorfman disease (Figure 10).30
Figure 10.
Rosai–Dorfman disease. Right paracavernous lesion which is T1 hypointense, markedly T2 hypointense with mild diffuse blooming on SWI and showing homogenous contrast enhancement.
Cavernous hemangioma
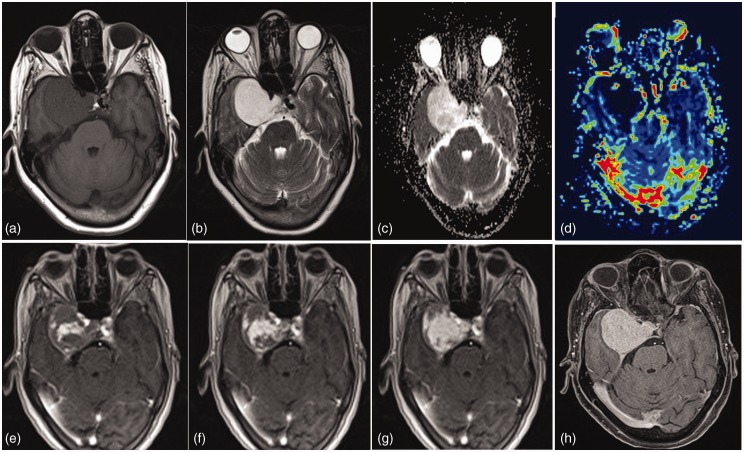
Extracerebral cavernous hemangiomas are very rare lesions encountered in the cavernous sinus region or at the cerebellopontine angle with extension into the internal acoustic canals. Intracranial extracerebral cavernous hemangiomas involving the cavernous sinus comprise less than 1% of all parasellar masses. These may be confused with meningiomas at CT and MR imaging. As surgery is difficult in these patients due to risk of hemorrhage, a preoperative diagnosis is extremely useful. A centripetal pattern of progressive enhancement after administration of gadolinium in a markedly T2 hyperintense parasellar lesion should suggest the diagnosis. Increased persistent activity on both early and delayed red cell blood pool scintigraphy of the brain, also suggest the diagnosis.31 Rarely there may be a centrifugal pattern of contrast enhancement. Hence, a dynamic T1 contrast enhanced MR imaging may be of value in discriminating these lesions from meningiomas and chondrosarcomas in these locations (Figure 11).32
Figure 11.
Cavernous hemangioma. A right para cavernous lesion hypointense on T1, brightly hyperintense on T2 with facilitated diffusion and low perfusion. Dynamic T1 contrast enhanced scans reveals initial central enhancement with progressive centrifugal enhancement. Delayed images reveal intense homogenous enhancement.
Skull base metastases
Skull metastasis incidence rate is 23% in patients with breast, lung, or prostate cancer, and the skull may be the only site of bony metastasis in up to 11.6% of patients. Due to the limited sensitivity of conventional MR imaging for skull metastasis, it is likely that these lesions are frequently missed. In patients being screened for brain metastasis, DWI improves the detection of all types of skull metastasis over conventional MR imaging by 21.1%. When categorized by primary tumor type, DWI improved the detection of breast cancer metastasis by 20% and for lung cancer by 36.3%. DWI did not improve the detection of prostate metastasis.33 Lytic metastases are very hyperintense on DWI sequences because of dense cell packing in highly malignant tumors and because lytic metastases are typically hyperintense on T2WI. Some metastases especially those from renal, thyroid and melanoma are hypervascular and may show a very high perfusion (Figure 12). Spectroscopy is usually of limited clinical utility due to artefactual distortion of the spectra. A summary of the advanced MR characteristics of common skull base pathologies is provided in Table 2.
Figure 12.
An expansile osteolytic lesion involving the right sphenoid wing. T2WI reveals the lesion to be mildly hyperintense. Constructive interference in steady state (CISS) images delineate the relation with the orbit. Lesion reveals intense contrast enhancement with very high perfusion. Work up had revealed a thyroid nodule. Case of hypervascular metastases from follicular thyroid carcinoma.
Table 2.
| Perfusion (rCBV) | ADC (106 mm2/s) | FA | SWI | Other techniques | |
|---|---|---|---|---|---|
| Meningioma | High (5–11) | Variable | Variable | No blooming | MRS – alanine peak |
| Schwannoma | Low (<3) | – | Variable | Blooming | |
| Paraganglioma | High | – | – | Blooming | |
| Chordoma | – | Low (<1500) | – | – | |
| Chondrosarcoma | – | High (>1500) | – | – | |
| Endolymphatic sac tumor | High | – | – | Blooming | |
| Rosai–Dorfman disease | Low | Low | High | Blooming | |
| Granulomas | Low | – | – | Blooming | |
| Cholesteatoma | – | Low | – | – | |
| Cavernous hemangioma | – | – | – | – | Centripetal enhancement |
Conclusion
Skull base pathologies may have diverse etiology being both neoplastic and non-neoplastic. High resolution CT and conventional MRI with contrast enhancement still remain the mainstay in radiological evaluation of these lesions. However, advanced imaging techniques when used in combination with conventional imaging provide valuable additional information for accurate characterization of lesions in this complex anatomic area. With increasing availability of these advanced imaging modalities there use is likely to increase and throw further light on features to characterize these skull base pathologies in near future.
Funding
This research received no specific grant from any funding agency in the public, commercial, or not-for-profit sectors.
Conflict of interest
The authors declared no potential conflicts of interest with respect to the research, authorship, and/or publication of this article.
References
- 1.Zimn A, Sasiadek M. Contribution of perfusion-weighted magnetic resonance imaging in the differentiation of meningiomas and other extra-axial tumors: case reports and literature review. J Neurooncol 2011; 103: 777–783. [DOI] [PMC free article] [PubMed] [Google Scholar]
- 2.Hakyemez B, Erdogan C, Bolca N, et al. Evaluation of different cerebral mass lesions by perfusion-weighted MR imaging. J Magn Reson Imaging 2006; 24: 817–824. [DOI] [PubMed] [Google Scholar]
- 3.Kremer S, Grand S, Remy C, et al. Contribution of dynamic contrast MR imaging to the differentiation between dural metastasis and meningioma. Neuroradiology 2004; 46: 642–648. [DOI] [PubMed] [Google Scholar]
- 4.Zhang H, Rodiger LA, Shen T, et al. Preoperative subtyping of meningiomas by perfusion MR imaging. Neuroradiology 2008; 50: 835–840. [DOI] [PubMed] [Google Scholar]
- 5.Jolpara M, Kesavadas C, Radhakrishnan VV, et al. Role of diffusion tensor imaging in differentiating between subtypes of meningiomas. J Neuroradiol 2010; 37: 277–283. [DOI] [PubMed] [Google Scholar]
- 6.Romani R, Tang W-J, Mao Y, et al. Diffusion tensor magnetic resonance imaging for predicting the consistency of intracranial meningiomas. Acta Neurochir 2014; 156: 1837–1845. [DOI] [PubMed] [Google Scholar]
- 7.Cho YD, Choi GH, Lee SP, et al. H1-MRS metabolic patterns for distinguishing between meningiomas and other brain tumors. Magn Reson Imaging 2003; 21: 663–672. [DOI] [PubMed] [Google Scholar]
- 8.Gaviani P, Schwartz RB, Hedley-Whyte ET, et al. Diffusion-weighted imaging of fungal cerebral infection. Am J Neuroradiol 2005; 26: 1115–1121. [PMC free article] [PubMed] [Google Scholar]
- 9.Turgut M, Yelda O, Serkan O, et al. Invasive fungal granuloma of the brain caused by Aspergillus fumigatus: a case report and review of the literature. Surg Neurol 2008; 69: 169–174. [DOI] [PubMed] [Google Scholar]
- 10.Haris M, Gupta RK, Singh A, et al. Differentiation of infective from neoplastic brain lesions by dynamic contrast-enhanced MRI. Neuroradiology 2008; 50: 531–540. [DOI] [PubMed] [Google Scholar]
- 11.Rao AB, Koeller KK, Adair CF. From the archives of the AFIP. Paragangliomas of the head and neck: radiologic–pathologic correlation 1. Radiographics 1999; 19: 1605–1632. [DOI] [PubMed] [Google Scholar]
- 12.Macdonald AJ, Salzman KL, Harnsberger HR, et al. Primary jugular foramen meningioma: imaging appearance and differentiating features. Am J Roentgenol 2004; 182: 373–377. [DOI] [PubMed] [Google Scholar]
- 13.Razek AA, Huang BY. Lesions of the petrous apex: classification and findings at CT and MR imaging. Radiographics 2012; 32: 151–173. [DOI] [PubMed] [Google Scholar]
- 14.Maeda M, Itoh S, Kimura H, et al. Vascularity of meningiomas and neuromas: assessment with dynamic susceptibility-contrast MR imaging. Am J Roentgenol 1994; 163: 181–186. [DOI] [PubMed] [Google Scholar]
- 15.Thamburaj K, Radhakrishnan VV, Thomas B, et al. Intratumoral microhemorrhages on T2*-weighted gradient-echo imaging helps differentiate vestibular schwannoma from meningioma. Am J Neuroradiol 2008; 29: 552–557. [DOI] [PMC free article] [PubMed] [Google Scholar]
- 16.Urich H, Tien RD. Tumors of the cranial, spinal and peripheral nerve sheaths. In: Bigner DD, McLenden RE, Bruner JM. (eds). Russell and Rubinstein’s pathology of tumors of the nervous system 1998; Vol. 2 6th ed London: Arnold, pp. 141–193. [Google Scholar]
- 17.Mukherji SK, Albernaz VS, Lo WW, et al. Papillary endolymphatic sac tumors: CT, MR imaging, and angiographic findings in 20 patients. Radiology 1997; 202: 801–808. [DOI] [PubMed] [Google Scholar]
- 18.Kang M, Khandelwal N, Singh P, et al. Imaging features of endolymphatic sac tumours: case report with review of literature. Australas Radiol 2007; 51: B199–B201. [DOI] [PubMed] [Google Scholar]
- 19.Poe DS, Tarlov C, Thomas CB, et al. Aggressive papillary tumors of temporal bone. Otolaryngol Head Neck Surg 1993; 108: 80–86. [DOI] [PubMed] [Google Scholar]
- 20.De Foer B, Vercruysse J-P, Spaepen M, et al. Diffusion-weighted magnetic resonance imaging of the temporal bone. Neuroradiology 2010; 52: 785–807. [DOI] [PubMed] [Google Scholar]
- 21.Isaacson B, Kutz JW, Roland PS. Lesions of the petrous apex: diagnosis and management. Otolaryngol Clin North Am 2007; 40: 479–519. [DOI] [PubMed] [Google Scholar]
- 22.Schwartz KM, Lane JI, Bolster BD Jr, et al. The utility of diffusion-weighted imaging for cholesteatoma evaluation. Am J Neuroradiol 2011; 32: 430–436. [DOI] [PMC free article] [PubMed] [Google Scholar]
- 23.Lehmann P, Saliou G, Brochart C, et al. 3T MR imaging of postoperative recurrent middle ear cholesteatomas: value of periodically rotated overlapping parallel lines with enhanced reconstruction diffusion-weighted MR imaging. Am J Neuroradiol 2009; 30: 423–427. [DOI] [PMC free article] [PubMed] [Google Scholar]
- 24.Hoa M, House JW, Linthicum FH Jr, et al. Petrous apex cholesterol granuloma: pictorial review of radiological considerations in diagnosis and surgical histopathology. J Laryngol Otol 2013; 127: 339–348. [DOI] [PMC free article] [PubMed] [Google Scholar]
- 25.Heffelfinger MJ, Dahlin DC, MacCarty CS, et al. Chordomas and cartilaginous tumors of the skull base. Cancer 1973; 32: 410–420. [DOI] [PubMed] [Google Scholar]
- 26.Almefty K, Pravdenkova S, Colli BO, et al. Chordoma and chondrosarcoma: similar, but quite different, skull base tumors. Cancer 2007; 110: 2456–2467. [DOI] [PubMed] [Google Scholar]
- 27.Yeom KW, Lober RM, Mobley BC, et al. Diffusion-weighted MRI: distinction of skull base chordoma from chondrosarcoma. Am J Neuroradiol 2013; 34: 1056–1061. [DOI] [PMC free article] [PubMed] [Google Scholar]
- 28.Foucar E, Rosai J, Dorfman R. Sinus histiocytosis with massive lymphadenopathy (Rosai–Dorfman disease): review of the entity. Semin Diagn Pathol 1990; 7: 19–73. [PubMed] [Google Scholar]
- 29.Raslan OA, Schellingerhout D, Fuller GN, et al. Rosai–Dorfman disease in neuroradiology: imaging findings in a series of 10 patients. Am J Roentgenol 2011; 196: 187–193. [DOI] [PubMed] [Google Scholar]
- 30.Hingwala D, Neelima R, Kesavadas C, et al. Advanced MRI in Rosai–Dorfman disease: correlation with histopathology. J Neuroradiol 2011; 38: 113–117. [DOI] [PubMed] [Google Scholar]
- 31.Salanitri GC, Stuckey SL, Murphy M. Extracerebral cavernous hemangioma of the cavernous sinus: diagnosis with MR imaging and labeled red cell blood pool scintigraphy. Am J Neuroradiol 2004; 25: 280–284. [PMC free article] [PubMed] [Google Scholar]
- 32.Jinhu Y, Jianping D, Xin L, et al. Dynamic enhancement features of cavernous sinus cavernous hemangiomas on conventional contrast-enhanced MR imaging. Am J Neuroradiol 2008; 29: 577–581. [DOI] [PMC free article] [PubMed] [Google Scholar]
- 33.Neemeth AJ, Hensen JW, Mullens ME, et al. Improved detection of skull metastases with diffusion weighted MR imaging. Am J Neuroradiol 2007; 28: 1088–1092. [DOI] [PMC free article] [PubMed] [Google Scholar]


